1. Introduction
The Alpine–Himalayan range is sandwiched between the Eurasian and Tibetan plates in the north and the Afro-Arabia platform in the south (Deng et al. Reference Deng, Panza, Zhang, Romanelli, Ma, Doglioni, Wang, Zhang and Teng2014; Xiao, Reference Xiao2015; Windley & Xiao, Reference Windley and Xiao2018). The Alborz magmatic belt in the central domain of the Alpine–Himalayan range is one of the most important polymetallic belts in Iran and hosts significant metal endowment. Similar to its adjacent areas, the Alborz magmatic belt hosts a variety of ore deposit types, particularly epithermal polymetallic deposits (B Hajalilo, unpub. PhD thesis, Beheshti Univ., Iran, 1999; Mehrabi et al. Reference Mehrabi, Ghasemi Siani, Goldfarb, Azizi, Ganerod and Marsh2016; Tale Fazel et al. Reference Tale Fazel, Mehrabi and Ghasemi Siani2019; Zamanian et al. Reference Zamanian, Rahmani, Zareisahamieh, Pazoki and Yang2020), Kiruna-type deposits (Nabatian et al. Reference Nabatian, Ghaderi, Daliran and Rashidnejad-Omran2013), Mo–Cu–Au mineralized deposits related to I-type granitoids (Jamali et al. Reference Jamali, Dilek, Daliran, Yaghubpur and Mehrabi2009; Aghazadeh et al. Reference Aghazadeh, Houb, Badrzadeh and Zhou2015), and fluorite deposits (Shafiei Bafti et al. Reference Shafiei Bafti, Dunkl and Madanipour2021). Most of these deposit types are spatially and temporally related to Eocene–Oligocene calc-alkaline magmatic rocks (Berberian & King, Reference Berberian and King1981; Nabatian et al. Reference Nabatian, Ghaderi, Neubauer, Honarmand, Liu, Dong, Jiang, von Quadt and Bernroider2014), generated in subduction-related and post-subduction settings associated with closure of the Neo-Tethyan Ocean basins (e.g. Rabiee et al. Reference Rabiee, Rossetti, Tecce, Asahara, Azizi, Glodny, Lucci, Nozaem, Opitz and Selby2019; Yasami & Ghaderi, Reference Yasami and Ghaderi2019; Ebrahimi et al. Reference Ebrahimi, Pan and Rezaeian2021).
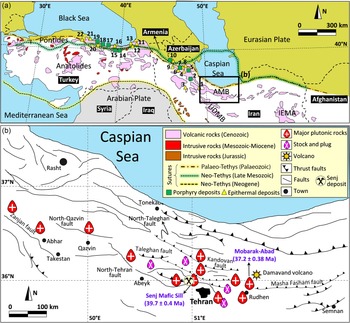
The Senj Mo–Cu deposit (36° 00′ N, 51° 00′ E), located in the central Alborz magmatic belt, northern Iran, covers an area of 7 km2 (Fig. 1). Substantial ancient mine workings by six tunnels with more than a total 400 m length were developed at the Senj (from 1956), particularly within a 1000 m long Mo–Cu vein. The mine closed due to increased production costs, largely resulting from the influx of groundwater into the deepening tunnels. The Pichab Kavosh Consulting Engineers (2007) identified some other mineralized zones in the Senj deposit, which are estimated at more than 1.3 Mt at 1.5 wt % Cu, 0.2 wt % Mo and >0.05 g t−1 Au. Valizadeh (Reference Valizadeh1987) suggested that the Senj deposit together with other polymetallic Cu (±Au–Ag) prospects in neighbouring areas (i.e. Parachan, Ziaran and Zeh-Abad) are classified as hydrothermal vein-type deposits.
(a) Simplified tectonic map of northern Iran and neighbouring regions showing the distribution of known porphyry and epithermal deposits, and permissive intrusive and volcanic rocks (compiled from Alavi, Reference Alavi1991; Yigit, Reference Yigit2006; Zanchetta et al. Reference Zanchetta, Zanchi, Villa, Poli and Muttoni2009; Richards, Reference Richards2015; Zürcher et al. Reference Zürcher, Bookstrom, Hammarstrom, Mars, Ludington, Zientek, Dunlap and Wallis2019). Various deposits that are cited in the figure: 1. Glojeh, 2. Siah-Kamar, 3. Touzlar, 4. Sonajil, 5. Zaglic, 6. Miveroud, 7. Sungun, 8. Haftcheshme, 9. Masjed Daghi, 10. Zangezur-Ordubad, 11. Yuksekoba, 12. Balcili, 13. Esendal, 14. Arzular, 15. Mustra, 16. Gumushane, 17. Kibledge, 18. Sincan, 19. Ordu, 20. Kaytangelisobasi, 21. Altintepe, 22. Barkircay. (b) Location of the Senj deposit and distribution of faults, major and minor permissive intrusive rocks in central Alborz (modified after Valizadeh et al. Reference Valizadeh, Abdollahi and Sadeghian2008). Abbreviations: AMB = Alborz Magmatic Belt, IEMA = Iranian East Magmatic Assemblage, UDMB = Urumieh-Dokhtar Magmatic Belt.

Previous research has focused on the geological evolution, tectonic history and stratigraphy of the sedimentary successions of the area (Dedual, Reference Dedual1967; Guest et al. Reference Guest, Stockli, Grove, Axen, Lam and Hassanzadeh2006; Shahidi et al. Reference Shahidi, Barrier, Brunet and Saidi2007; Ballato et al. Reference Ballato, Uba, Landgraf, Strecker, Sudo, Stockli, Friedrich and Tabatabaei2011) and, more recently, on the geochemistry, petrogenetic features and geochronology of the Senj Mafic Sill (Maghdour-Mashhour et al. Reference Maghdour-Mashhour, Esmaeily, Tabbakh Shabani, Chiaradia and Latypov2015; Nabatian et al. Reference Nabatian, Li, Wan and Honarmand2018). Geochemical and geochronological data indicate that the Senj Mo–Cu deposit is likely related to the Senj Mafic Sill emplaced at c. 40 Ma in an extensional regime associated with subduction of the Neo-Tethyan oceanic lithosphere (Maghdour-Mashhour et al. Reference Maghdour-Mashhour, Esmaeily, Tabbakh Shabani, Chiaradia and Latypov2015; Nabatian et al. Reference Nabatian, Li, Wan and Honarmand2018). Thus far, the source of metalliferous fluids and sulphur, vein paragenesis, and genetic relationships between Mo–Cu mineralization and the Senj Mafic Sill remain poorly understood.
In this contribution, we will systematically document the geological characteristics, hydrothermal alteration and vein paragenesis of the Senj deposit based on field observations, detailed logging of diamond drill holes, and petrographic studies. Then we will discuss its multiple vein generations and fluid evolution of the deposit based on the mineralization stages discerned, fluid inclusions and C–H–O–S–Pb isotope systematics (hydrogen–oxygen isotopes in multiple quartz veins, carbon–oxygen isotopes in late calcite veins, and sulphur–lead isotopes in sulphide minerals). Our work provides insights into the origin of these ores and the evolution of the mineralizing hydrothermal system, and provides constraints on the possible sources of ore-forming fluids and components (metal and sulphur) in the Senj Mo–Cu deposit. This information will also help elucidate the implications for the regional mineralization of precious- and base-metal deposits in the Alborz magmatic belt.
2. Regional geology
The Alborz magmatic belt is a main structural domain of the largest mountain belt in the world, the Alpine–Himalayan Belt, and situated 200–500 km north of the Bitlis–Zagros suture zone (Vincent et al. Reference Vincent, Allen, Ismail-Zadeh, Flecker, Foland and Simmons2005). It forms the easternmost portion of the Pontides arc – Lesser Caucasus – Alborz range in the Turkish–Iranian high plateau and includes the Damavand volcano (Fig. 1), the highest peak in the Middle East.
The Alborz magmatic belt contains extensive calc-alkaline and high-K calc-alkaline Eocene volcanic rocks (Berberian & King, Reference Berberian and King1981; Zamanian et al. Reference Zamanian, Rahmani, Zareisahamieh, Pazoki and Yang2020), which resulted from collision of the Iranian block with the Eurasian plate due to continued convergence of the Arabian and Eurasian plates (Berberian, Reference Berberian1983; Hassanzadeh et al. Reference Hassanzadeh, Ghazi, Axen and Guest2002; Allen et al. Reference Allen, Vincent, Alsop, Ismail-Zadeh and Flecker2003) (Fig. 1a). The Eocene volcanic rocks are known as the Karaj Formation, which is 3–5 km thick and formed in Central Iran and the Alborz range (Dedual, Reference Dedual1967). The Karaj Formation consists of calc-alkaline volcanic and volcano-sedimentary rocks accompanied by shale strata, which occur in an arc / back-arc system or extensional arc setting (Allen et al. Reference Allen, Vincent, Alsop, Ismail-Zadeh and Flecker2003; McQuarrie et al. Reference McQuarrie, Stock, Verdel and Wernicke2003; Hassanzadeh et al. Reference Hassanzadeh, Axen, Guest, Stockli and Ghazi2004; Vincent et al. Reference Vincent, Allen, Ismail-Zadeh, Flecker, Foland and Simmons2005; Agard et al. Reference Agard, Omrani, Jolivet, Whitechurch, Vrielynck, Spakman, Monie, Meyer and Wortel2011; Verdel et al. Reference Verdel, Wernicke, Hassanzadeh and Guest2011; Fig. 1b).
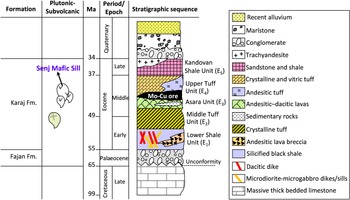
The Karaj Formation consists of up to 3300 m volcano-sedimentary rocks and is subdivided into five major units (Gansser & Huber, Reference Gansser and Huber1962; Dedual, Reference Dedual1967): (1) Lower Shale Unit (E1 ≈ 1000 m) composed of silicified black shale interlayered with lithic tuff and andesitic breccia; (2) Middle Tuff Unit (E2 ≈ 1120 m) composed of thick bedded green tuff interlayered with feldspathic tuff; (3) Asara Shale (E3 ≈ 200 m) composed of andesitic to dacitic lavas and andesitic tuff interlayered with sedimentary rocks; (4) Upper Tuff Unit (E4 ≈ 900 m) composed of crystalline tuff, vitric tuff and porphyritic basalt; and (5) Kandovan Shale (E5 ≈ 850 m) composed of tuffaceous sandstone and shale interlayered with trachyandesite lava (Fig. 2). Published zircon ages from the Karaj Formation in the central Alborz showed that andesite rocks at the base of the Karaj Formation yield an age of 47.4 ± 3.8 Ma, and biotite from a fine-grained green tuff collected at the top of the formation yields an 40Ar/39Ar age of 36.0 ± 0.2 Ma (Ballato et al. Reference Ballato, Uba, Landgraf, Strecker, Sudo, Stockli, Friedrich and Tabatabaei2011).
Stratigraphic column of the Alborz volcano-sedimentary formation/units and its plutonic and sub-volcanic magmatic events. Based on the 1:100 000 geologic map of Tehran (Amini, Reference Amini1993).

These Cenozoic strata were intruded by Middle to Late Eocene plutons, sills and dyke bodies with shoshonitic and high-K calc-alkaline affinities (M Moayyed, unpub. PhD thesis, Univ. Tabriz, Iran, 2001; Castro et al. Reference Castro, Aghazadeh, Badrzadeh and Chichorro2013; Nabatian et al. Reference Nabatian, Ghaderi, Neubauer, Honarmand, Liu, Dong, Jiang, von Quadt and Bernroider2014; Aghazadeh et al. Reference Aghazadeh, Houb, Badrzadeh and Zhou2015). Ballato et al. (Reference Ballato, Uba, Landgraf, Strecker, Sudo, Stockli, Friedrich and Tabatabaei2011) reported 40Ar/39Ar magmatic cooling ages of 39.3 ± 0.2 Ma and 36.8 ± 0.1 Ma, respectively, for biotite and K-feldspar minerals from the intrusive rocks in the central part of the Alborz magmatic belt. Moreover, an 40Ar/39Ar age of 37.2 ± 0.4 Ma has been determined by Verdel et al. (Reference Verdel, Wernicke, Hassanzadeh and Guest2011) from the biotites of the Mobarak–Abad gabbros, east of the Senj Mafic Sill (Fig. 1b).
3. Local geology
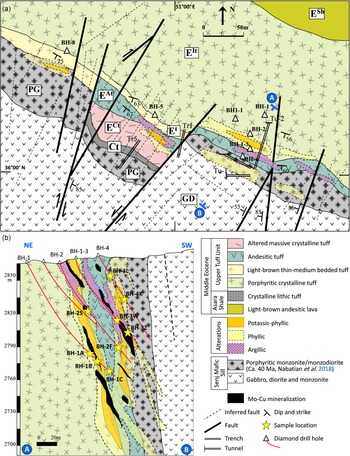
Molybdenum–copper mineralization at the Senj deposit occurs as multistage hydrothermal veins and shows a close spatial relationship with Senj Mafic Sill, which was emplaced into a succession of volcanic and volcano-sedimentary rocks of the Karaj Formation during the middle Eocene. The Senj Mafic Sill (c. 40 Ma), located in northern Karaj province, is one of several plutonic bodies in the Alborz magmatic belt that intruded into the Asara Shale (E3) and Upper Tuff Unit (E4) succession of the Karaj Formation (c. 41–45 Ma) (Fig. 3). The contacts with country rocks are clear and sharp, as they have been subjected to weak contact metamorphism (chilled margin), especially along the upper contact. The Senj mafic magma intruded as sill-shaped intrusion with 460 m thick, dip direction of c. 60° NE–SW and mainly comprises monzonite, monzodiorite, gabbro and monzogabbro with gradational transitions among the units (Meyer, Reference Meyer1967; Valizadeh et al. Reference Valizadeh, Abdollahi and Sadeghian2008; Fig. 3). Ballato et al. (Reference Ballato, Uba, Landgraf, Strecker, Sudo, Stockli, Friedrich and Tabatabaei2011) reported 40Ar/39Ar magmatic cooling ages of 39.3 ± 0.2 Ma and 36.8 ± 0.1 Ma, respectively, for biotite and K-feldspar from the intrusive rocks of the central Alborz magmatic belt.

The main lithostratigraphic units of the deposit are the middle Eocene Karaj Formation, which is composed of the lower light-brown andesitic lava and crystalline lithic tuff interlayered with tuffaceous shale (Asara Shale) and the upper dark-green thick bedded porphyritic crystalline tuff, light-brown thin–medium bedded tuff, andesitic tuff and altered massive crystalline tuff (Upper Tuff Unit). Verdel et al. (Reference Verdel, Wernicke, Hassanzadeh and Guest2011) reported a laser ablation inductively coupled plasma mass spectrometry (LA-ICP-MS) concordia zircon age of 45.3 ± 2.3 Ma for a tuff within the Asara Shale and 41.1 ± 1.6 Ma for the Upper Tuff Unit.
The Mo–Cu mineralization in the Senj deposit is mainly hosted in the dark-green thick-bedded porphyritic tuff of the Upper Tuff Unit (Fig. 3). Senj Mafic Sill has a genetic relationship with molybdenum–copper mineralization, and both porphyritic tuff and intrusion were affected by hydrothermal alteration. The mineralized zone is c. 100 m in length and 10–30 m in width, and contains 1.3 Mt hypogene sulphide ore (Pichab Kavosh Consulting Engineers, 2007). According to structural geology studies, at least two major NE- and NW-trending faults were distinguished at the Senj deposit (Fig. 3). NW-striking faults cross-cut the mineralized zone and belong to a post-mineralization stage, but NE-striking faults with dip to the SW are the main ore controls-structure in the Senj deposit.
4. Sampling and analytical methods
A total of 1000 m of core from four diamond drill holes into the Senj deposit was logged at a 5–10 m scale by Pichab Kavosh Consulting Engineers (2007). Drill cores chosen for study are located within the core of the deposit; rock types, alteration styles and multiple vein sets were recorded. Samples used for fluid inclusion analyses and stable-radiogenic isotopes (C, H, O, S, Pb) were selected from four diamond drill cores that penetrate the Senj altered-mineralized zone from a depth of 2850–2700 m above sea level (a.s.l.); sampling locations are shown in Fig. 3.
4.a. Fluid inclusion analysis
Thirteen representative conventional thin-sections were prepared for fluid inclusion analyses and 12 wafers were selected for heating and freezing measurements. Fluid inclusion studies were carried out using 100–300 µm thick double-polished sections from all paragenetic stages of the quartz–sulphide and late calcite veins. Quartz and calcite crystals that had workable FIs were sampled from four diamond drill cores (BH-1, BH-2, BH1-3 and BH-4; Fig. 3). A detailed investigation of FIs including petrography and microthermometry were performed at the Iranian Mineral Processing Research Center (Karaj, Iran). The microthermometric measurements were conducted using a Linkam THMS600 heating–freezing stage mounted on a ZEISS Axioplan2 microscope with 20×, 50× and 100× long working distance objectives. The thermocouples were calibrated by measuring the melting temperatures of pure water (0.0 °C) and pure CO2 (−56.6 °C) using synthetic fluid inclusions. The measurement accuracy of phase transitions in fluid inclusions was ±0.2 °C for temperatures below 0 °C, ±0.5 °C between 0 and 100 °C, and ±2 °C between 100 and 600 °C. Heating and cooling rates were controlled at 20 °C min−1 during heating or freezing processes most of the time, and were reduced to ±0.2 °C for ice-melting temperature and ±2 °C for homogenization (Thtotal, L + V → L) and halite-dissolution temperatures (TmNaCl). The identification of the species in solution was determined from first ice-melting temperatures (T FM) (Shepherd et al. Reference Shepherd, Rankin and Alderton1985; Van den Kerkhof & Hein, Reference Van den Kerkhof and Hein2001). Salinities of aqueous (NaCl–H2O) inclusions, expressed as wt % NaCl equiv., were calculated using the final melting temperatures of ice (Bodnar, Reference Bodnar1994). However, the salinities of halite daughter mineral-bearing inclusions were calculated using the methodology outlined by Sterner et al. (Reference Sterner, Hall and Bodnar1988). The bulk densities and pressures of FIs were calculated using the equations of Zhang and Frantz (Reference Zhang and Frantz1987) and the FLUIDS software (Bakker, Reference Bakker2003).
4.b. Stable isotope analysis
Thirty-one quartz, calcite and sulphide minerals were selected from all paragenetic stages of the veins (see Fig. 5, further below). Mineral samples were hand-picked under a binocular microscope and then crushed to <200-mesh powder in an agate mortar.
Nine quartz samples from three sulphide-bearing quartz veins were analysed in the Stable Isotope Laboratory at Cornell University (Ithaca, USA), using the Finnigan MAT-252 mass spectrometer (QFIR). For oxygen isotope analysis, oxygen was liberated from quartz by reaction with BrF5 (Clayton & Mayeda, Reference Clayton and Mayeda1963) and converted to CO2 on a platinum-coated carbon rod. The water of the fluid inclusions in quartz was released by heating the samples to above 500 °C by means of an induction furnace, and then reacted with chromium powder at 800 °C to generate hydrogen for isotope analysis (Kyser & Kerrich, Reference Kyser, Kerrich, Taylor, O’Neil and Kaplan1991). The results are expressed in the conventional delta (δ) notation as per mil (‰) deviation relative to Vienna Standard Mean Ocean Water (V-SMOW), with precisions of ±2 ‰ for δD (1σ) and ±0.2 ‰ for δ18O (2σ).
Five calcite samples from the late calcite vein stage were analysed for carbon (δ13C) and oxygen (δ18O) isotopic composition. Samples were analysed using a Kiel III device connected to a Finnigan MAT-252 isotope ratio mass spectrometer in the Department of Geological Sciences at the University of Florida. The CO2 was extracted from calcite with pure phosphoric acid at 70 °C for calcite. The C and O stable isotope data are reported in the δ notation as the ‰ deviation relative to the Vienna Pee Dee Belemnite (V-PDB) standard for carbon, and the V-SMOW for oxygen. The precision of the technique was measured with an internal standard of Carrera Marble calibrated with NSB-19, and found to be ± 0.04 ‰ for δ18O and ± 0.08 ‰ for δ13C at the 2σ level.
Twelve samples from the sulphide-bearing quartz veins were chosen for sulphur stable isotope determination, including individual crystals of chalcopyrite (five samples), molybdenite (four samples) and pyrite (three samples). Sulphur isotope compositions were analysed at the Stable Isotope Laboratory of the US Geological Survey (USGS, Denver, USA). Sulphide grains were carefully hand-picked under a binocular microscope after the samples had been crushed and cleaned, resulting in a separate of >98 % pure sulphides. Individual separated crystals were combusted and δ34S determined according to the methods of Giesemann et al. (Reference Giesemann, Jager, Norman, Krouse and Brand1994), using a CE Elantech Inc. Flash 2000 Elemental Analyzer coupled to a Thermo Finnigan Delta Plus XP™ continuous flow mass spectrometer. The δ34S is reported in the δ notation as the ‰ deviation of the isotope ratio (34S/32S) relative to the Vienna Canyon Diablo Troilite (V-CDT) standard. The analytical precision was estimated to be ±0.2 ‰ for δ34S (2σ).
4.c. Lead isotope analysis
The lead isotope analysis for five sulphide samples (molybdenite and pyrite) and three monzonite samples from the Senj Mafic Sill was carried out on a multi-collector inductively coupled plasma mass spectrometer (MC-ICP-MS) at the Radiogenic Isotope Facility of the University of Bern (Switzerland). Sulphide and monzonite samples were dissolved by concentrated HCl + HNO3 and HF + HNO3, respectively. Pb was separated and purified using AG1-X8 resin anionic ion-exchange columns with diluted HBr as eluant. A common lead isotopic standard from the National Institute for Standards and Testing (NIST SRM 981) was used for the mass-discrimination correction. The external reproducibilities (2σ level) of the USGS BCR-2 standard for Pb-isotope ratios are 0.2% for 206Pb/204Pb, 0.3% for 207Pb/204Pb, and 0.4% for 208Pb/204Pb.
5. Senj Mafic Sill
The Senj Mafic Sill is predominantly mafic rock units ranging in composition from gabbro to monzodiorite and monzonite with gradational transitions between the units; the major intrusive body in the Senj area is mainly composed of medium- to coarse-grained plagioclase and clinopyroxene with minor olivine. The plagioclase typically occurs as euhedral to subhedral crystals or tabular grains of various size, ranging from <2 mm, 2–5 mm and >5 mm. The coarse-grained plagioclases show compositional zoning and locally are saussuritized, with alteration to epidote, calcite and chlorite, especially within the crystal cores. Clinopyroxene occurs as euhedral to subhedral medium-sized (up to 3.5 mm) crystals, which are locally replaced by biotite, chlorite, calcite and iron oxides, including goethite. The ferromagnesian minerals in the monzonitic rocks are rarer than those in the gabbros and monzodiorite. The mineral assemblage of the monzonitic samples includes plagioclase, K-feldspar and clinopyroxene with accessory minerals, such as quartz, hornblende and biotite.
Nabatian et al. (Reference Nabatian, Li, Wan and Honarmand2018) have reported from zircon U–Pb dating by secondary ion mass spectrometry (SIMS) that the Senj Mafic Sill was emplaced at 39.7 ± 0.4 a (c. 40 Ma). This intrusion has low contents of SiO2 (50.7–53.1 wt %) and moderate alkalis (K2O + Na2O = 6.1–10.4 %), with K2O/Na2O, aluminium saturation index (ASI = molar Al2O3/(CaO + K2O + Na2O)) and Mg# values of 0.4 to 2.1 (in most cases <1.0), 0.8 to 1.0 (metaluminous) and 47 to 55, respectively, and as such belongs to the high-K calc-alkaline series to shoshonitic affinity. It has a narrow range of Eu/Eu* ratios (0.83–0.94), best described as weak negative Eu anomalies. It is enriched in large-ion lithophile elements (LILEs) (e.g. Cs, Rb and Ba; Rb = 14–250 ppm), but depleted in high-field-strength elements (HFSEs) (e.g. Nb, Ta and Ti; Nb = 19–34 ppm). In addition, the Senj zircon grains show a relatively large variation of initial Hf ratios (ϵ Hf(t) of +4.1 to +11.1; Nabatian et al. Reference Nabatian, Li, Wan and Honarmand2018) and might represent the composition of the subcontinental mantle that generated the Senj parental magma. Taken altogether, it is suggested that the Senj Mafic Sill was produced mainly by partial melting of continental crust that involved some enriched mantle components (Maghdour-Mashhour et al. Reference Maghdour-Mashhour, Esmaeily, Tabbakh Shabani, Chiaradia and Latypov2015; Nabatian et al. Reference Nabatian, Li, Wan and Honarmand2018).
6. Mineralization stages and wall rock alteration
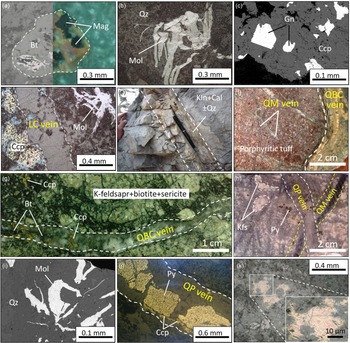
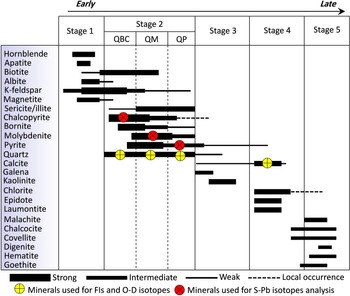
Primary ore minerals in the Senj deposit include chalcopyrite, molybdenite, bornite, magnetite, pyrite and galena. The main gangue minerals are quartz, sericite, amphibole, epidote, calcite and chlorite. Accordingly, hydrothermal mineralization–alteration process at the Senj deposit can be divided into four paragenetic stages (Figs 4, 5; Table 1). Stage 1: K-silicate pre-mineralization is characterized by the assemblage of K-feldspar–hornblende–biotite–albite–apatite ± magnetite. Magnetite is mostly disseminated, coexisting with biotite groundmass of the Senj porphyritic intrusion (Fig. 4a). Stage 2: quartz (±sulphide) vein-style mineralization is characteristic of the main Mo–Cu mineralization. These stages and their alteration assemblages are distinguished by multiple generation veins: quartz–biotite–chalcopyrite (QBC), quartz–molybdenite (QM) and quartz–pyrite (QP), respectively. Molybdenite is flaky and disseminated along veins or fractures (Fig. 4b). Stage 3: is characterized by the pyrite–calcite–kaolinite ± quartz assemblage, with galena occurring as xenomorphic to isometric grain in veins and coexisting with minor chalcopyrite (Fig. 4c). Argillic alteration is most present in stage 3. Stage 4: is characterized by the late calcite veins (LC vein), containing no opaque phases, and cross-cutting the earlier quartz–sulphide veins and altered country rocks (Fig. 4d, e). The propylitic alteration developed in stage 4. Stage 5: is characterized by the supergene or leached secondary assemblage of Fe-oxide and Cu-sulphide minerals (e.g. hematite, goethite, covellite, chalcocite and malachite).
Ore textures, mineralogy and mineralization stage of the Senj Cu–Mo deposit. Photomicrographs are taken in reflected light (//N) except (a) which is taken in transmitted light (xN). (a) Occurrence of disseminated magnetite in biotite groundmass of the porphyry rocks. (b) Flaky molybdenite in quartz. (c) Scanning electron microscope backscattered electrons (SEM-BSE) image from xenomorphic to isometric grains of galena within chalcopyrite. (d) Late calcite veins with no or little sulphide, which cross-cut the earlier quartz–sulphide stockwork veins. (e) Argillic alteration (Kln + Cal ± Qz) is mostly controlled by fractures. (f) QBC vein cut by QM quartz–sulphide stockwork veins in porphyritic tuff (BH-1, 85 m), hand specimen. (g) QBC vein consisting of quartz, chalcopyrite and biotite dispersive grains in K-feldspar–biotite–sericite host (BH1-3, 55 m), hand specimen. (h) QM vein cut by QP quartz–sulphide stockwork veins in altered porphyritic andesite–tuff (BH-2, 78 m), hand specimen. (i) Flaky molybdenite in quartz from the QM veins. (j) Open space filling texture of QP vein with quartz, pyrite and minor chalcopyrite. (k) Chalcopyrite and bornite solid-solution texture occurring in BH1-3 drill hole (depth 67 m). Abbreviations (Whitney & Evans, Reference Whitney and Evans2010): Kfs = K-feldspar, Qz = quartz, Mol = molybdenite, Ccp = chalcopyrite, Py = pyrite, Mag = magnetite, Kln = kaolinite, Bt = biotite; Gn = galena, Cal = calcite.

Paragenetic sequence of the development of various types of veins/veinlets and mineralization stages for Senj deposit. The thickness of the horizontal bars is related to the relative abundance of the veinlets.

Mineralogy, alteration types and sampling depth of quartz–sulphide stockwork mineralization in various drill cores

1 Sample number locations are shown in Fig. 3.
Hydrothermal alteration types at the Senj deposit were deduced largely from the spatial and temporal distribution of the different quartz–sulphide vein paragenesis. Cross-cutting relationships, vein mineralogy and related hydrothermal alteration were used to distinguish the relative timing of different hydrothermal stages (Fig. 5). The alteration types at the Senj deposit include, sequentially: (1) K-silicate alteration with hornblende, apatite, biotite, albite, K-feldspar and magnetite, which surrounds the Senj Mafic Sill and belongs to the pre-mineralization stage; (2) potassic–phyllic alteration with biotite, K-feldspar and sericite as predominant hydrothermal minerals, and genetically related to QBC veins; (3) phyllic alteration, mainly recognized by transformation of K-feldspar and biotite to sericite/illite, with disseminated pyrite and genetically related to QM and QP veins; (4) argillic alteration with calcite, kaolinite, pyrite and quartz, typified by transformation of K-feldspar to kaolinite and usually controlled by fractures (Fig. 4e); and (5) propylitic alteration with epidote, chlorite, tremolite–actinolite, calcite and laumontite occurring as replacement predominant hydrothermal minerals.
7. Vein paragenesis
7.a. Quartz–biotite–chalcopyrite veins (QBC veins)
The QBC veins are discontinuous, range from <0.5 to 3 cm wide and contain major quartz, chalcopyrite and biotite with minor pyrite (Fig. 4f). These veins occur in K-feldspar, biotite, sericite and minor magnetite and belong to the potassic–phyllic alteration assemblage (Fig. 4g). The QBC veins were cut by later QM veins. K-feldspar replaces plagioclase phenocrysts and itself is variably altered to sericite under the later phyllic alteration. Magnetite is finely disseminated and occurs as replacement grains in the biotite groundmass of the Senj Mafic Sill (Fig. 4a). Much of this magnetite is replaced by hematite (martitization) formed during supergene weathering.
7.b. Quartz–molybdenite veins (QM veins)
The QM veins are continuous planar fractures, ranging from 1 to 2 cm wide, with parallel walls that have been filled by anhedral to subhedral quartz, flaky molybdenite, and minor pyrite and sericitized K-feldspar (Fig. 4h). Molybdenite more typically occurs in vein selvages, together with anhedral quartz (Fig. 4i). In some QM veins, anhedral quartz has been overgrown by euhedral quartz, and central voids have been filled by chalcopyrite and/or pyrite. These veins are associated with phyllic alteration assemblage and are cross-cut by later QP veins.
7.c. Quartz–pyrite veins (QP veins)
The late generations of QP veins have regular, continuous walls, some internal banding, and vary from 1 mm to 2 cm wide. QP veins cut QM veins (Fig. 4h), and occur throughout the quartz and sericite/illite (phyllic) alteration assemblage. Pyrite is the most abundant sulphide mineral, occurring as medium to coarse grains (0.5 to 3 mm in diameter), disseminated grains and clusters of grains, and sometimes is accompanied by chalcopyrite (Fig. 4j). Chalcopyrite and bornite have solid-solution equilibrium texture (Fig. 4k) and were locally replaced by Cu-sulphide supergene assemblage, such as chalcocite, covellite and digenite.
7.d. Late calcite veins (LC veins)
All of the quartz–sulphide vein types and mineralization styles described above are cross-cut by later calcite veins. These veins are typically thicker (1–5 cm) than the earlier veinlets and consist of colourless to creamy white calcite. These veins do not contain any sulphide mineral phases (Fig. 4d).
8. Fluid inclusions
Fluid inclusions analysis was conducted on samples of the four vein parageneses (QBC, QM, QP and LC veins) using the fluid inclusion assemblage (FIA) concept (Goldstein & Reynolds, Reference Goldstein and Reynolds1994). A single FIA represents groups of temporally coeval inclusions present in clusters, in trails or along the growth zone. We then selected FIAs showing the least evidence of necking-down or shape modifications for further microthermometric measurements. Microthermometry study was carried out mainly on primary FIs in minerals interpreted to be trapped during the mineralizing event. The characteristics of the primary FIs are that they occur randomly or regularly along growth bands or healed fissures in intragranular crystals and they occasionally present as individual inclusions (Roedder, Reference Roedder1984), whereas FIs aligned along microfractures in transgranular trails were designated secondary.
8.a. Petrography and types of fluid inclusions
On the basis of nature, phase relationships and compositions at room temperature (25 °C), the FIs can be categorized into three types (Table 2; Fig. 6): two-phase, liquid-rich (L-type); two-phase, vapour-rich (V-type); and liquid-rich, solid-bearing (S-type). These occur in decreasing order of abundance, and petrographic characteristics are summarized below.
Microthermometric data of multistage veins at the Senj deposit.

Abbreviations: l, liquid; v, vapour; T FM, first ice-melting; Tmice, final ice-melting; TmNaCl, halite dissolution; TmKCl, sylvite dissolution; Thtotal, total homogenization temperature to liquid or vapour; n, the total number of available analyses inclusions of each FIA.
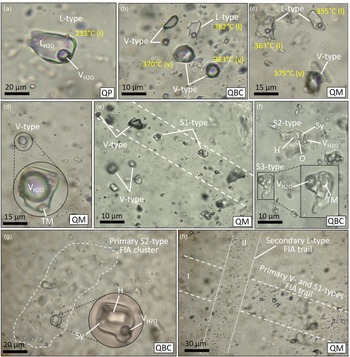
Photomicrographs of typical fluid inclusions in vein quartz from the Senj deposit (transmitted plane-polarized light, xN). (a) Liquid-rich, L-type inclusions in quartz crystals of QP vein. (b) Vapour-rich, V-type inclusions containing less than 20 vol % liquids next to liquid- and vapour-rich inclusions in a QBC vein. (c) L- and V-type fluid inclusions containing various bubble size next to liquid-rich inclusions in a QM vein. (d) Vapour-rich inclusion with transparent daughter mineral from a QM vein (the presence of daughter minerals and substantial liquid suggests that liquid and vapour may have been trapped heterogeneously in this inclusion). (e) Primary V-type next to S1-type inclusions trapped along trials of quartz growth zones in a QM vein. (f) Brine inclusion from a QBC vein characteristic of S2- and S3-type inclusions. It contains multiple daughter crystals identified as halite and sylvite, and unidentified opaque phase and transmitted daughter minerals. (g) Primary S2-type inclusions trapped along trials of quartz growth zones in a QBC vein. (h) Primary V- and S1-type inclusions assemblage cut by last secondary L-type inclusions FIA trial in a QM vein. Abbreviations: O, opaque mineral; H, halite; Sy, sylvite; TM, transparent mineral; L, liquid phase; V, vapour phase; S, solid phase; FIA, fluid inclusion assemblage.

8.a.1. L-type
Two-phase, liquid-rich fluid inclusions with consistent liquid-to-vapour ratios are the most common type in association with all stages of the mineralization (Fig. 6a). They usually contain 10–30 vol % vapour and show negative crystal internal shape, are elliptical and irregular in shape with sizes ranging from 5 to 30 µm in diameter, and mainly homogenize to liquid. They occur in clusters or coexist with V- and S-type FIs in the same crystal (Fig. 6a, c).
8.a.2. V-type
Two-phase, vapour-rich fluid inclusions are the second most abundant FIs characterized by a dark vapour bubble generally VH2O/(VH2O + LH2O) > 50% of the inclusion volume (Fig. 6b, c). These inclusions usually have lentiform or negative shape, and mainly homogenize to vapour. Their sizes range between 4 and 20 μm in diameter. Daughter minerals are usually not present, though a few inclusions contain a transparent phase, which probably is a trapped mineral (Fig. 6d). This type of FI occurs commonly in clusters with S1-type FIs (Fig. 6e–h).
8.a.3. S-type
Liquid-rich, solid-bearing fluid inclusions are composed of one, two or rarely three solid mineral phases, vapour and liquid water (Fig. 6f). They are subdivided on the basis of their daughter minerals into three types: S1-type (liquid + vapour + halite ± hematite); S2-type (liquid + vapour + halite + sylvite ± opaque); and S3-type (liquid + vapour + undetermined translucent daughter minerals). Halite and sylvite are identified from their cubic shapes and isotropy. Halite is generally larger, whereas sylvite has a rounded outline and dissolves at lower temperature on heating. A tabular birefringent mineral was tentatively identified as anhydrite. Chalcopyrite in some inclusions was identified from its triangular shape, opacity and reflection under the ore microscope. Hematite, with its characteristic red colour, is the most common opaque mineral present. S-type FIs occurs in isolation or coexist with V- and L-type FIs in the same crystal. Petrographic observation indicates that S2-type inclusions (Fig. 6g) only present in quartz of the QBC veins.
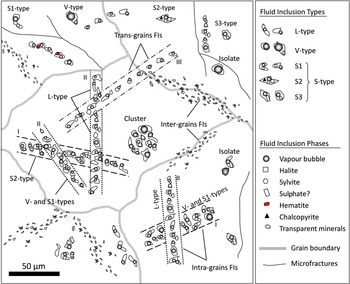
Following the work of Ulrich et al. (Reference Ulrich, Günthur and Heinrich2001), the sequence of fluid entrapment was inferred from the distribution of inclusion assemblages in all the paragenesis veins based on petrographic observations of cross-cutting trails of fluid inclusions along individual fractures. Rare cross-cutting relationships between inclusions trails in the Senj deposit indicate that S2-type inclusions are earlier than any other inclusion types, and L- and V-types are clearly earlier than fracture-controlled secondary fluid inclusions (Figs 6h 7).
Hand-drawn sketch, based on microscopic observations, showing the distribution of L-, V- and S-type FIs in the Senj deposit.

8.b. Microthermometric results
The microthermometric results and calculated total homogenization temperatures (Thtotal) and salinities parameters for fluid inclusions are summarized in Table 2 and graphically illustrated in Figures 8, 9.
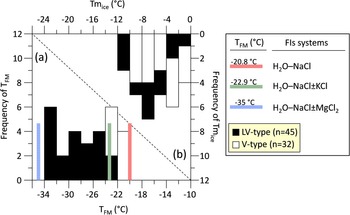
Summary of microthermometric results for L- and V-type FIs with salt-water systems (modified after Shepherd et al. Reference Shepherd, Rankin and Alderton1985; Van den Kerkhof & Hein, Reference Van den Kerkhof and Hein2001), in frequency histograms of (a) first ice-melting temperatures (T FM) and (b) final ice-melting temperatures (Tmice). n = number of FIs analysed.

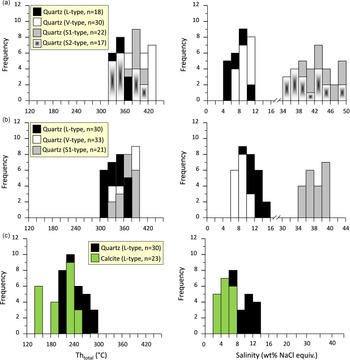
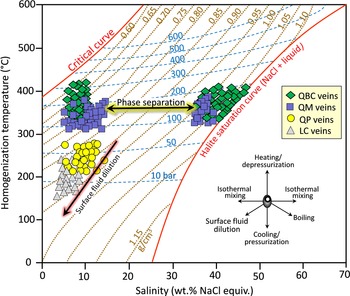
Histograms of salinities and homogenization temperatures of L-, V- and S-type FIs in multiple generation veins. (a) QBC veins. (b) QM veins. (c) QP and LC veins. n = number of FIs analysed.

8.b.1. QBC vein
L-, V- and S-type FIAs were identified in quartz crystals of the QBC vein (Fig. 6). The primary inclusions in both L- and V-type FIs show first ice-melting temperatures between −33 and −22 °C (average = −27 °C), suggesting the presence of negligible MgCl2 in addition to NaCl and KCl (Fig. 8). All the L-type FIs in QBC veins homogenize to a liquid phase during the heating process and have homogenization temperatures ranging from 324 to 412 °C (average = 365 °C, n = 18), with densities ranging from 0.75 to 0.82 g cm−3. Their final ice-melting temperatures are between −7.0 and −3.2 °C, corresponding to salinities of 5.3 to 10.5 wt % NaCl equiv. (Fig. 9a). The V-type FIs homogenize to vapour at temperatures of 347 to 425 °C (average = 390 °C, n = 30), with densities ranging from 0.58 to 0.68 g cm−3. During the freezing to heating process, observing the final ice-melting temperature for most of the V-type FIs was difficult; only a few final ice-melting temperatures were observed that ranged from −7.6 and −4.2 °C, corresponding to salinities of 6.7–11.2 wt % NaCl equiv. (Fig. 9a).
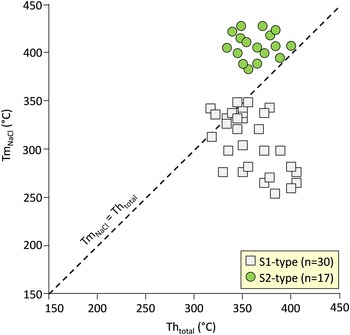
For the S1- and S2-type FIAs in QBC veins, the halite daughter mineral dissolved at temperatures (TmNaCl) ranging from 250 to 355 °C (corresponding to a salinity of 34.7 to 42.8 wt % NaCl equiv.) and 387 to 418 °C (corresponding to a salinity of 46.2 to 49.0 wt % NaCl equiv.), respectively (Fig. 9a). Microthermometric evidence shows most S2-type FIs homogenize by halite dissolution above the temperature of liquid-vapor curve (L–V) homogenization, whereas the S1-type FIs homogenize by L–-V homogenization after halite dissolution (Fig. 10). The S1- and S2-type FIAs show final homogenization by the disappearance of the vapour bubble had a Thtotal temperature range of 320 to 415 °C and 334 to 407 °C, respectively (Table 2).
Temperature of bubble homogenization vs temperature of halite dissolution in S-type inclusions. The dashed line (from Shepherd et al. Reference Shepherd, Rankin and Alderton1985) is the line along which both halite and bubble homogenize at the same temperature. All S2-type inclusions are plotted above this line, indicating that halite dissolves after bubble homogenization. Such homogenization behaviour indicates that these inclusions were not trapped on the L–V curve, but must have been trapped at some greater pressure (Bodnar, Reference Bodnar1994; Rusk et al. Reference Rusk, Reed and Dilles2008). n = number of FIs analysed.

8.b.2. QM vein
L-, V- and S1-type FIAs were identified in quartz crystals of the QM vein (Fig. 6). All the L-type FIs have homogenization temperatures of 308 to 373 °C (average = 340 °C, n = 30), with densities ranging from 0.83 to 0.86 g cm−3. The final ice-melting temperatures are between −11.3 and −4.7 °C, corresponding to salinities of 7.5 to 15.3 wt % NaCl equiv. (Fig. 9b). The V-type fluid inclusion assemblages homogenize to vapour at temperatures of 332 to 385 °C (average = 360 °C, n = 33), with densities ranging from 0.70 to 0.78 g cm−3. The final melting temperatures of ice are between −7.0 and −3.8 °C, corresponding to salinities of 6.2 to 10.5 wt % NaCl equiv. For the S1-type FIAs, the halite daughter mineral usually dissolved at temperatures ranging from 258 to 320 °C, after the vapour bubble disappeared, and their salinities were estimated as 35.2–39.7 wt % NaCl equiv. (Fig. 9b). They homogenized to a liquid phase at temperatures ranging from 325 to 390 °C, and densities of 1.05 to 1.10 g cm−3.
8.b.3. QP and LC veins
L-type FIAs are the only type recognized in the quartz and calcite crystals of QP and LC veins, respectively (Fig. 6). For the FIAs of the QP veins, final melting temperatures of ice range from −9.1 to −3.5 °C, corresponding to salinities of 5.7 to 13.0 wt % NaCl equiv. These L-type FIs were homogenized to a liquid phase at temperatures varying from 214 to 288 °C (average = 250 °C, n = 30; Fig. 9c), with densities of 0.80 to 0.95 g cm−3. The L-type FIAs of LC veins yielded final melting temperatures of ice varying from −4.5 to −1.2 °C, equivalent to salinities of 2.1 to 7.2 wt % NaCl equiv. They were homogenized to a liquid phase at temperatures ranging from 145 to 243 °C (average = 190 °C, n = 23), with densities ranging from 0.85 to 0.96 g cm−3 (Fig. 9c).
9. Stable and radiogenic isotope analysis
9.a. Sulphur isotope
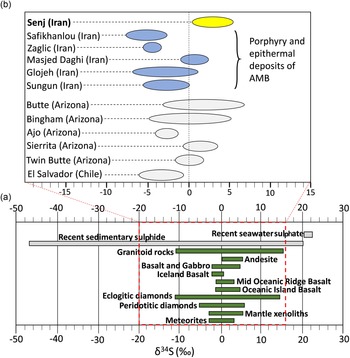
Sulphur isotope data from sulphide minerals selected from the three sulphide-bearing quartz veins are presented in Table 3 and shown in Figure 11. Sulphide minerals from the Senj deposit exhibit a narrow range between 0.8 and 5.1 ‰, with an average value of 3.0 ± 1.2 ‰ (n = 12). Five chalcopyrite samples from a QBC veinlet yielded δ34S values between 0.8 and 3.2 ‰ (average = 1.9 ± 0.9 ‰), whereas four molybdenite samples from a QM veinlet have δ34S values of 3.6 to 5.1 ‰ (average = 4.3 ± 0.6 ‰). The δ34S values for three pyrite samples from a QP veinlet are 3.8 to 4.2 ‰ (average = 4.0 ± 0.1 ‰).
Oxygen and hydrogen stable isotope values of the Senj deposit

Notes: δ18OH2O was calculated according to δ18OH2O = δ18Oquartz − 3.38 × (106 × T –2) + 3.4 (Clayton et al. Reference Clayton, O’Neil and Meyeda1972). Temperatures are based on the average homogenization temperatures of fluid inclusions from each vein stage. Thtotal, total homogenization temperature.
(a) Range of sulphur isotope values (δ34S ‰) for sulphides and sulphates from various rock reservoirs (data from Marini et al. Reference Marini, Moretti and Accornero2011; Qiu et al. Reference Qiu, Taylor, Song, Yu, Song and Li2016). (b) Sulphur isotope compositions of sulphides from the Senj Mo–Cu deposit, with comparison to those of sulphides from typical porphyry deposits worldwide (data from Ohmoto & Goldhaber, Reference Ohmoto, Goldhaber and Barnes1997) and porphyry and epithermal deposits of the AMB (data from Calagari, Reference Calagari2003; Mehrabi et al. Reference Mehrabi, Ghasemi Siani, Goldfarb, Azizi, Ganerod and Marsh2016; Ebrahimi et al. Reference Ebrahimi, Alirezaei, Pan and Mohammadi2017, Reference Ebrahimi, Pan and Rezaeian2021).

9.b. Lead isotopes
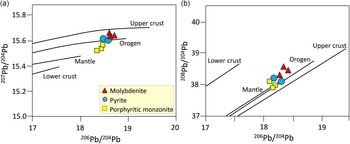
Lead isotope data of sulphide minerals are reported in Table 4 and shown in Figure 12. Three molybdenite samples have Pb isotope ratios of 206Pb/204Pb = 18.536 to 18.723, 207Pb/204Pb = 15.604 to 15.652, and 208Pb/204Pb = 38.287 to 38.566. Two pyrite samples from QP veins have 206Pb/204Pb ratios of 18.423 to 18.567, 207Pb/204Pb ratios of 15.583 to 15.623 and 208Pb/204Pb ratios of 38.035 to 38.224. Pb isotope compositions of porphyritic monzonite from the Senj Mafic Sill samples have 206Pb/204Pb = 18.324 to 18.456, 207Pb/204Pb = 15.509 to 15.451 and 208Pb/204Pb = 37.851 to 38.123.
Sulphur isotope data of sulphides at the Senj deposit

Plots of 207Pb/204Pb vs 206Pb/204Pb (a) and 208Pb/204Pb vs 206Pb/204Pb (b) for sulphide minerals and porphyritic monzonite from the Senj Mo–Cu deposit. The lead isotopic figure and fields are from Zartman and Doe (Reference Zartman and Doe1981).

9.c. Hydrogen and oxygen isotopes
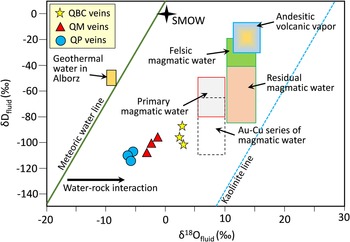
Oxygen and hydrogen isotope data in three QBC, QM and QP vein parageneses at the Senj deposit are listed in Table 5 and shown in Fig. 13. The δ18OH2O values were calculated using the quartz–water equilibrium function (Clayton et al. Reference Clayton, O’Neil and Meyeda1972), 1000 ln αquartz-water = 3.38 × 10⁶ × T −2 − 3.40. Temperatures used for calculation of δ18OH2O from δ18OQuartz are average homogenization temperatures of fluid inclusions from the same stage. The measured δ18Oquartz values of nine quartz samples from different stages range from 1.50 to 9.43 ‰. The calculated δ18OH2O values for QBC, QM and QP veins are 2.10 to 3.23 ‰, −3.63 to −1.18 ‰ and −6.10 to −5.17 ‰, respectively (Fig. 13). The δD values of fluids entrapped in inclusions for QBC, QM and QP mineralizing stages are −102.3 to −86.0 ‰, −108.6 to −98.6 ‰ and −115.6 to −106.8 ‰, respectively (Fig. 13).
Lead isotope data of various sulphides and Senj Mafic Sill in the Senj deposit

Plot of δD vs δ18O, showing the calculated compositions for the ore-forming fluids in the Senj Mo–Cu deposit. Primary magmatic water field and meteoric water line are from Taylor (Reference Taylor1974). Addition of data for andesite volcanic vapour field from Giggenbach (Reference Giggenbach1992), the felsic magmatic water field from Taylor (Reference Taylor1992), the Au–Cu series magmatic water box from Sun et al. (Reference Sun, Yunsheng, Peng, Yujie and Yu2019), and residual magmatic water field from Taylor (Reference Taylor1974). Cenozoic geothermal water in Alborz is from Bagheri et al. (Reference Bagheri, Karami, Jafari, Eggenkamp and Shamsi2019). SMOW = standard mean ocean water.

9.d. Carbon and oxygen isotopes
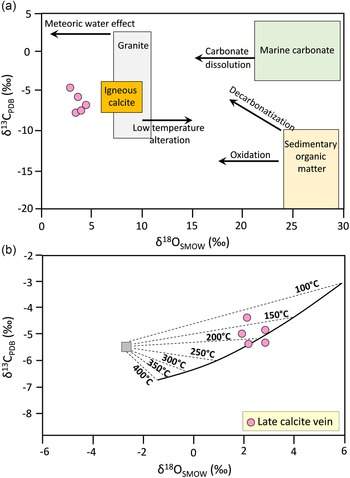
Carbon and oxygen isotope data of five separated calcite crystals from the late vein stage are listed in Table 6 and plotted in Fig. 14. Calcite has δ13CPDB values of –8.2 to –4.6 ‰ and δ18OPDB values of –27.2 to –25.5 ‰ (Table 6). The δ13Cfluid and δ18Ofluid values in equilibrium with calcite were calculated using the CO2–calcite fractionation equation of Bottinga (Reference Bottinga1968) and the calcite–water fractionation equation of O’Neil et al. (Reference O’Neil, Clayton and Mayeda1969), respectively. With an average homogenization temperature of 190 °C, the δ13Cfluid values that range from –8.0 to –4.4 ‰ (average = –6.5 ± 0.5 ‰) were calculated using the function of 1000 ln α (CO2-calcite) = –2.4612 + 7.663 × 10³/(T + 273.15) – 2.988 × 10⁶/(T + 273.15)2 (Bottinga, Reference Bottinga1968). Similarly, the δ18Ofluid values that vary from –5.3 to –3.1 ‰ (average = –4.0 ± 0.7 ‰) were calculated using the function of 1000 ln α (calcite-H2O) = 2.78 × 10⁶/(T + 273.15)2 – 3.39 (O’Neil et al. Reference O’Neil, Clayton and Mayeda1969).
Carbon and oxygen isotope data of calcite in the Senj deposit

Notes: δ18OSMOW = 1.03086 × δ18OPDB + 30.86 (Friedman & O’Neil, Reference Friedman and O’Neil1977); the error is ±0.2 ‰ (2σ) for δ13C and ±1 ‰ (2σ) for δ18O. δ13C values of fluids in equilibrium with calcite were calculated using equations of Bottinga (Reference Bottinga1968), and δ18Ofluid values were calculated using the fractionation factors between calcite and water (O’Neil et al. Reference O’Neil, Clayton and Mayeda1969); the calculations are based on T = 190 °C from fluid inclusion analysis in late calcite stage.
(a) Diagram of δ13CPDB vs δ18OSMOW for the late calcite veins of the Senj deposit, and comparison with the isotope composition of mostly known rock types (Sheppard, Reference Sheppard1984; Hoefs, Reference Hoefs2015). (b) The theoretical compositions of calcite that precipitated from an H2CO3-dominant cooling water with a bulk isotopic composition of −2.6 ‰ (δ18OSMOW) and −5.5 ‰ (δ13CPDB) were calculated by fractionation equations of Field and Fifarek (Reference Field and Fifarek1985) and Friedman and O’Neil (Reference Friedman and O’Neil1977). The late calcite veins of the Senj deposit are broadly coincident with the theoretical cooling trend, showing that calcite precipitation could have formed from a meteoric water approximately through 100 to 200°C temperature range.

10. Discussion
10.a. Trapping pressure and mineralization depth
There are several methods for estimation of mineralization depth and trapping pressure from fluid inclusion systematics (cf. Roedder, Reference Roedder1984; Rusk et al. Reference Rusk, Reed and Dilles2008). The association of liquid-rich-brine inclusions (S-type) with vapour-rich inclusions (V-type) that contain no visible liquid (Fig. 6e) supports the Senj deposit likely forming at shallow depth (Beane & Bodnar, Reference Beane, Bodnar, Pierce and Bohm1995; Bodnar, Reference Bodnar and Thompson1995). This fluid inclusion assemblage is interpreted to have resulted from the trapping of separate vapour and hypersaline liquid (brine) phases with similar homogenization temperatures in the early QBC veins (Fig. 9a), which provides evidence for fluid phase separation through sulphide mineralization (Bodnar, Reference Bodnar and Thompson1995; Fournier, Reference Fournier1999; Brathwaite et al. Reference Brathwaite, Simpson, Faure and Skinner2001). Moreover, a small number of vapour-rich FIAs have identified in the middle QM veins, and these sometimes coexist with liquid-rich fluid inclusions (Fig. 6c), showing that these inclusions record a boiling event. Considering the evidence of fluid boiling or immiscibility phenomena in the hydrothermal system, homogenization temperatures are interpreted to closely approximate trapping temperatures (Roedder & Bodnar, Reference Roedder and Bodnar1980). Based on the total homogenization temperatures and salinities of three types of fluid inclusions in the Senj, the minimum trapping pressures of FIs were estimated in a simple NaCl–H2O system using the formula given by Driesner and Heinrich (Reference Driesner and Heinrich2007).
The trapping pressures in the early QBC veins range from ∼100 to 340 bar, with an average of ∼220 bar, corresponding to depths of 0.4 to 1.2 km (Fig. 15) under lithostatic conditions (based on a lithostatic pressure gradient of 27 MPa km−1). For the QM stage, the trapping pressures of FIs are estimated to range from <100 to 200 bar and are mostly concentrated at 150 bar (Fig. 15), equivalent to a depth of ∼0.4 to 0.7 km assuming hydrostatic conditions (based on a hydrostatic pressure gradient of 10 MPa km−1). The QP and LC vein stage FIs are also shown in Figure 15, and the trapping pressures are mostly less than 50 bar, equivalent to a depth of <0.5 km, representing their minimum trapping pressures. These estimates imply that the trapping pressures of the FIs gradually decreased from early to late ore-stage during progressive exhumation of the mineralizing system, similar to other Mo deposits in the Alborz magmatic belt (e.g. Siah-Kamar Mo deposit (Rabiee et al. Reference Rabiee, Rossetti, Tecce, Asahara, Azizi, Glodny, Lucci, Nozaem, Opitz and Selby2019)).
Pressure estimation for various types of veins and mineralization stage fluid inclusions at the Senj deposit. L-, V- and S-type inclusions in various veins trapped under hydrostatic conditions; thus, the estimated pressures can represent the actual trapping pressures. NaCl saturation and critical curves from Ahmad and Rose (Reference Ahmad and Rose1980). Isobars were calculated from the equations of Driesner and Heinrich (Reference Driesner and Heinrich2007). Diagonal contours show fluid densities of NaCl–H2O systems in g cm−3 for pressures along the L–V curve (Haas, Reference Haas1971), and arrows representing fluid evolution trends are modified after Wilkinson (Reference Wilkinson2001).

10.b. Ore genesis
10.b.1. Sources of sulphur and metals
As the consequence of isotopic fractionation between hydrothermal fluids and cogenetic sulphide minerals during the hydrothermal process, the δ34S values of sulphides are not equal to the total δ34S values of the hydrothermal fluid but are a function of the total S isotopic composition (Σδ34S), oxygen fugacity (fO2), pH and temperature of the ore-forming fluid (Ohmoto, Reference Ohmoto1972). Hence, the Σδ34S of the ore-forming fluid is not equivalent to the δ34S value of individual sulphide minerals, but it can be determined from the mineral assemblage (Cheng et al. Reference Cheng, Yang, Zhang and Yang2019). The sulphur isotopic compositions of sulphide minerals at the Senj deposit show the relationship of δ34Spy > δ34SCcp, implying that the sulphur isotopes had reached equilibrium (Ohmoto & Goldhaber, Reference Ohmoto, Goldhaber and Barnes1997). The δ34SVCDT values of sulphides in the Senj Mo–Cu deposit range from 0.8 to +5.1 % (average of 3.0 ‰), indicating a homogeneous sulphur source. Unlike sedimentary rocks, which usually have a negative or wide range of δ34S values (Fig. 11a; Seal, Reference Seal2006), the δ34S values of sulphides in the Senj deposit are relatively concentrated, and slightly more than the range of the mantle sulphur (0 ± 2 ‰; Hoefs, Reference Hoefs2015), which corresponds to the range of values from granitic rocks worldwide (1.0 ± 6.1 ‰) (Seal, Reference Seal2006). The narrow range of sulphur isotopic compositions in the sulphide minerals is suggestive of relatively constant physicochemical conditions in the ore-forming fluids in this stage.
Sulphide samples at the Senj deposit are characterized by Pb isotopic compositions, with 208Pb/204Pb, 207Pb/204Pb and 206Pb/204Pb values of 37.854–38.566, 15.509–15.652 and 18.324–18.723, respectively, which are broadly comparable to values of the associated Senj Mafic Sill (Fig. 12). Because these sulphides usually contain very low concentrations of U and Th, and almost no radiogenic Pb was generated after mineral formation, these Pb isotopic compositions likely reflect the initial Pb isotopic compositions of the ore-forming hydrothermal fluid, thus tracking its source (Zhou et al. Reference Zhou, Dou, Huang, Cui, Ye, Li, Gan and Sun2016, Reference Zhou, Xiang, Zhou, Feng, Luo, Huang and Wu2018; Liu et al. Reference Liu, Li, Zhu, Zhou and Yu2020). We suggest that the monzonitic magma and volcano-sedimentary country rocks contributed most of the lead and ore-forming metals. This result coincides well with the petrographic observation of porphyritic monzonite bearing extensive potassic–phyllic alteration assemblages as well as some disseminated Mo–Cu mineralization (Fig. 4g). The lead isotope data form a narrow linear trend that transects the defined growth curves (Stacey & Kramers, Reference Stacey and Kramers1975; Leng et al. Reference Leng, Zhang, Huang, Huang, Wang, Ma, Luo, Li and Li2015), with molybdenite samples showing 208Pb/204Pb and 207Pb/204Pb ratios relatively higher than those of pyrite (Fig. 12). A probable mechanism for the Pb isotope variations interpreted from the mixing of two or more isotopically different sources was involved in mineralization (Zindler & Hart, Reference Zindler and Hart1986; Tosdal & Munizaga, Reference Tosdal and Munizaga2003; Chiaradia et al. Reference Chiaradia, Konopelko, Seltmann and Cliff2006; Wang et al. Reference Wang, Zhang, Liu, Xue, Li and Xian2018). Thus, in the Senj deposit, mixing a low 208Pb/204Pb and 207Pb/204Pb magmatic fluid from the underlying porphyries with isotopically evolved crustal materials is a plausible explanation. As mentioned earlier, molybdenite formed in QM veins shows relatively high δ34S values, and pyrite in QP veins shows decreasing δ34S values relative to molybdenite (Table 4). Combining the S and Pb isotope data, one may speculate that Mo, which precipitated during QM veins, was sourced from magmatic fluids and some upper crustal materials at the Senj, whereas pyrite in QP veins precipitated at a later stage with crustal components (Fig. 12). Finally, we proposed that the metal and sulphur were probably sourced from hydrothermal magmatic fluids with a little contribution of crustal materials.
10.b.2. Sources of the ore-forming fluids
The δDH2O and δ18OH2O values determined for the Senj deposit are plotted on a δD vs δ18O diagram in Fig. 13. Three QBC vein samples plot adjacent to the box of primary magmatic water in the δD vs δ18O plot (Fig. 13), indicating that the ore-forming fluid of the QBC vein stage is magmatic-dominated in origin, with no input of meteoric water. The values of δ18OH2O in the QM vein stage range from −3.63 to −1.18 ‰, and they are closed to the values for magmatic water. The values of δ18OH2O for the QP vein stage range from −6.10 to −5.17 ‰. These values are lower than those for the QM vein and show that the QP vein fluids were dominated by meteoric water. According to fluid inclusions and O–D isotope analysis, the ore-forming fluids of the Senj Mo–Cu deposit were derived mainly from a magmatic source in the early stage and meteoric water in the late stage, and this corresponds to the evolution from a medium- to high temperature, high-salinity fluid to a low-temperature and -salinity fluid.
The δ13CPDB and δ18OSMOW values for late calcite veins (LC) at the Senj deposit range from –8.2 to –4.6 ‰ and 2.8 to 4.6 ‰, respectively. These ranges are variously from marine carbonate-derived CO2 (δ13CPDB = –4 to +4 ‰ and δ18OSMOW = 20 to 30 ‰; Veizer & Hoefs, Reference Veizer and Hoefs1976) and sedimentary organic matter-derived CO2 (δ13CPDB = –30 to –15 ‰ and δ18OSMOW = 24 to 30 ‰; Hoefs, Reference Hoefs2015), but are comparable with the igneous calcite-derived CO2 (δ13CPDB = –8 to –4 ‰ and δ18OSMOW = 6 to 10 ‰; Taylor et al. Reference Taylor, Frechen and Degens1967; Demény et al. Reference Demény, Ahijado, Casillas and Vennemann1998) (Fig. 14a). The δ13C vs δ18O diagram, in which five calcite samples are plotted on a theoretical cooling curve for an H2CO3-dominant hydrothermal water with a δ13C value of –5.5 ‰ (Fig. 14b) implies that the carbon was likely to originate from deep-seated magmatic CO2 (Schidlowski, Reference Schidlowski1998). The calculated δ18O value of −2.6 ‰ for this cooling pattern is compatible with a prevailing meteoric water through calcite precipitation in the late calcite veins.
10.c. Fluid evolution and Mo–Cu mineralization
10.c.1. Fluid evolution
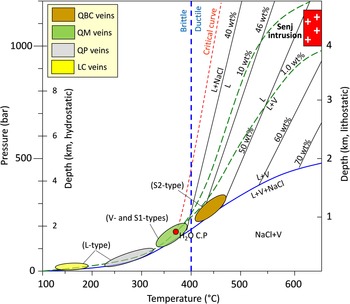
A reasonable model for Mo–Cu mineralization at the Senj deposit can be constructed by considering the phase relationships in the NaCl–H2O system (Fig. 16). Fluid inclusions in quartz and calcite crystals of multiple vein generations (e.g. QBC, QM, QP and LC veins) recorded the fluid evolution in the Senj deposit (Fig. 16). It seems that magnetite crystallization during the formation of S-type FIs leads to the progressive reduction of sulphates (12FeO + H2SO4 = 4Fe3O4 + H2S; Liang et al. Reference Liang, Sun, Su and Zartman2009; Zarasvandi et al. Reference Zarasvandi, Rezaei, Raith, Lentz, Azimzadeh and Pourkaseb2015) and oversaturation of S2− resulting in deposition of sulphide minerals during hydrothermal boiling synchronous with the formation of L- and V-type FIs. This event results from episodic hydraulic fracturing and healing caused by fluid boiling and mixing, the fluid system evolved toward low-temperature, low-salinity conditions, which only happened with L-type inclusions (e.g. QP and LC veins) (Fig. 16).
Pressure–temperature diagram showing phase relationships in the NaCl–H2O system at lithostatic and hydrostatic pressures (adapted from Bodnar et al. Reference Bodnar, Burnham and Sterner1985; Fournier, Reference Fournier1999; Muntean & Einaudi, Reference Muntean and Einaudi2001). Depth of Senj intrusion (c. 4.5 km) was reported by Maghdour-Mashhour et al. (Reference Maghdour-Mashhour, Esmaeily, Tabbakh Shabani, Chiaradia and Latypov2015). Liquids curves from Bodnar (Reference Bodnar1994) and Cline and Bodnar (Reference Cline and Bodnar1994). The vertical dashed line shows the approximate temperature of the brittle–ductile boundary for a strain rate of 10–14 s–1 (Fournier, Reference Fournier1999). H2O C.P = critical point of water, L = liquid, NaCl = halite, V = vapour.

The interpretation of fluid evolution in Fig. 16 is only one possible scenario guided by average trapping temperatures and salinities observed in the fluid inclusions. Unlike porphyry Cu deposits in arc settings (e.g. Bajo de la Alumbrera), in which parental ore fluids are hot (>700 °C), saline (52 to 58 wt % NaCl equiv.) and orthomagmatic (Ulrich et al. Reference Ulrich, Günthur and Heinrich2001; Harris et al. Reference Harris, Golding and White2005; Bodnar et al. Reference Bodnar, Lecumberri-Sanchez, Moncada, Steele-MacInnis, Holland and Turekian2014), no inclusions with high T (>700 °C) and very high salinity (>52 wt % NaCl equiv.) have been distinguished in the Senj deposit (Figs 15, 16). As seen in Fig. 16, S-type fluid inclusions in QBC veins may generally represent the parental or pre-boiled fluid derived from a Cl−OH-bearing high-K calc-alkaline magma (Hou et al. Reference Hou, Yang, Qu, Meng, Li, Beaudoin, Rui, Gao and Zaw2009). This is based on two observed facts: firstly, these inclusions are generally earlier than other inclusion types, and usually contain solid phases, such as chalcopyrite, anhydrite and opaque minerals, suggesting the earliest trapping; secondly, these inclusions homogenize by halite dissolution (S2-type), and have relatively high homogenization temperature (400 to 450 °C) and minimum pressure (200 to 300 bar). As seen in Fig. 16, high-saline and high-temperature fluids derived from the magmatic source underwent decreasing temperature and depth, reaching a condition under which S2-type inclusion formed in QBC veins, and subsequently a rapid decrease in salinity (<40 wt % NaCl equiv.) with decreasing temperature (∼400 °C) culminated in the formation of S1 as well as V-type inclusions in quartz which occurred in QM veins. Finally, from (S1 + V)-type inclusion boiling conditions to L-type inclusion conditions, the system experienced high-temperature fluid boiling and subsequent development of hydraulic fracturing. Moreover, the plastic behaviour of the system, which is characteristic of lithostatic conditions changed to brittle conditions, indicates a hydrostatic-dominated pressure regime (Fournier, Reference Fournier1999) characterized by mineralization occurrences in open-space filling (Fig. 4j). All these phenomena paved the way for the inflow and/or mixing of early magmatic fluids with circulating meteoric waters, leading to the evolution toward low-salinity (<13 wt % NaCl equiv.) and low-temperature (<300 °C) liquid-rich inclusions during the formation of QP and LC veins. These inclusions show a positive linear correlation between homogenization temperatures and salinities (Fig. 15) and calcite crystals in LC veins formed at lower δ18Ofluid values (<−3.1 ‰; Table 6).
10.c.2. Mo–Cu saturation and precipitation
Mo–Cu precipitation in magmatic–hydrothermal systems may be triggered by one or several of the following parameters: (1) decrease in salinity; (2) decrease in Cu−Cl and Mo−OH solubility with decrease in temperature and pressure; (3) changes in H2S content and sulphur fugacity (fS2); and (4) changes in oxygen fugacity (fO2) and pH (Klemm et al. Reference Klemm, Pettke, Heinrich and Campos2007; Williams-Jones et al. Reference Williams-Jones, Samson, Ault, Gagnon and Fryer2010; Seo et al. Reference Seo, Guillong and Heinrich2012; Chiaradia, Reference Chiaradia2014; Zarasvandi et al. Reference Zarasvandi, Rezaei, Raith, Lentz, Azimzadeh and Pourkaseb2015). In the Senj deposit, the fluid salinity did not vary significantly until the sulphide precipitation stage (Fig. 9), suggesting that the change of salinity was not a critical factor controlling the Mo–Cu saturation. In contrast, there is a clear trend of strongly decreasing temperatures from the early to late stages of ore formation (Figs 9, 15). During the early stage (QBC veins), the homogenization temperatures were mainly in the 320 to 425 °C range, whereas the temperatures decreased to the range of 308° to 390 °C during the middle stage (QM veins). One possible explanation for such a decrease in temperature is a fluid phase separation event that occurred during the main ore stage; an alternative could be a fluid mixing with minor amounts of meteoric water. Thus, the temperature change and fluctuation solubility of Cu−Cl and Mo−OH complexes might be one of the essential factors for Mo–Cu mineralization. In magmatic–hydrothermal systems, the ore-forming processes are often genetically related to the alteration processes. The earliest hydrothermal fluids interacted with the Senj Mafic Sill and the volcanic and volcano-sedimentary host rocks in the Senj Mo–Cu deposit, leading to extensive potassic ± phyllic alteration. At this stage, fluids were relatively oxidizing, high-saline and H2S-poor, and thus unfavourable for sulphide deposition and Mo–Cu mineralization. Because of the consumption of heat energy, alkali ions (Na+ and K+) and OH complexes during the potassic alteration, the main Mo–Cu mineralization stage fluids became more reduced and acidic with the increasing activity of H+ and S2– (4SO2 + 4H2O → 3HSO4– + 3H+ + H2S; Ulrich and Mavrogenes, Reference Ulrich and Mavrogenes2008; Sillitoe, Reference Sillitoe2010; Simon & Ripley, Reference Simon and Ripley2011). The transition of the redox state from alkalinity to acidity led to increased escape of CO2, i.e. 2H+ + CO32– → H2O +CO2 ↑. Therefore, these changes forced the pH to rise and the oxygen fugacity to decrease, consequently reducing the stability of Mo(VI) complexes (Keppler & Wyllie, Reference Keppler and Wyllie1991; Seo et al. Reference Seo, Guillong and Heinrich2012) and leading to large-scale deposition of molybdenite (MoS2) in QM veins. Moreover, further cooling of the hydrothermal system and little mixing with meteoric water caused the development of late calcite veins.
Molybdenum is an incompatible element formed in the (MoO4)2− species in plagioclase structure during the magma cooling and crystallization (Shao et al. Reference Shao, Zhang and Mu2011). Mo is transported within felsic melts and associated with aqueous fluids at medium to high temperatures by two complexes: K2MoO4 (Webster, Reference Webster1997; Kravchuk et al. Reference Kravchuk, Malinin, Senin and Dernov2000) and KHMoO4 (Ulrich & Mavrogenes, Reference Ulrich and Mavrogenes2008). In the early stage, Mo might be transported as K2MoO4 complex, which resulted in decreasing K+ with corresponding potassic alteration during water–rock interaction (Nast & Williams-Jones, Reference Nast and Williams-Jones1991). With continuous water–rock interaction, the properties of the ore-forming fluid changed, causing H+ and H2S to increase and the Mo complex to be destabilized and precipitate as MoS2 in QM veins (Sun et al. Reference Sun, Huang, Li, Hu, Zhang, Sun, Zhang, Ding, Li, Zartman and Ling2015; Yang et al. Reference Yang, Chen, Pirajno and Li2015; Wang et al. Reference Wang, Zhang, Liu, Xue, Li and Xian2018). Moreover, the first K-feldspar alteration stage within the deposit is indicative of hydrothermal fluids with a high KCl/NaCl ratio, and suggests that K-rich fluids may partly control the transport of molybdenum. The S2-, L- and V-type inclusions that formed during QM veins do not contain any petrographic evidence of post-trapping changes or successive trapping of different fluids, suggesting that these fluid inclusions coexist, and revealing that the fluids that formed the Senj deposit underwent fluid phase separation after intrusion of the porphyritic monzonite, causing water–rock interaction. In addition, fluid inclusions within the Senj deposit record a decrease in temperature and pressure from QBC to LC vein stages (Figss 9, 15), indicating that late-stage H2O–NaCl fluids that are responsible for the formation of late calcite veins are also associated with calcite and quartz deposition, but without Mo–Cu mineralization. Overall, the available data suggest that the decreasing temperatures, increasing water–rock interaction, phase separation/boiling and the changes in oxygen fugacity (fO2) are the main ore-controls on precipitation of sulphide minerals at the Senj deposit.
10.d. Mineralization model and comparison with typical porphyry systems
In the Senj area, Senj Mafic Sill intruded at the middle Eocene (39.7 ± 0.4 Ma) into Karaj Formation that was erupted from the early to late Eocene (c. 41−45 Ma). The early hydrothermal fluid responsible for the occurrence of the QBC veins was composed of hypersaline brine (salinity > 40 wt % NaCl equiv.) and vapour that was trapped at temperatures greater than 450 °C (Fig. 16). Fluid overpressuring and decompression cycling can account for brine inclusions that homogenize by halite dissolution (S2-type) in quartz crystals of QBC veins. These veins also contain brine inclusions that homogenize by the disappearance of the vapour bubble (S1-type), which is probably formed by phase separation when the rock fractured.
The highest concentrations of molybdenite occur in QM veins within the Senj deposit. Fluid inclusion microthermometry suggests that molybdenite was deposited with the quartz at temperatures between 350 and 400 ºC with an average salinity of 20 wt % NaCl equiv. These fluids were cooler than those that caused the K-feldspar–biotite–sericite alteration and QBC-related veins (∼450 ºC). Thus molybdenite-bearing veins most likely formed as the Senj deposit cooled and crystallized. The sericite/illite alteration assemblage at the Senj deposit possibly reflects a domain of early acid neutralization by K-feldspar and plagioclase altered wall rocks (e.g. Heinrich, Reference Heinrich2003). Fluid inclusion evidence indicates that the QP veins associated with the quartz–sericite/illite alteration zone formed at about 250 ºC with an average salinity of 10 wt % NaCl equiv. The formation of quartz–sericite–pyrite phyllic alteration assemblages, which overprint both the potassic alterations, is inferred to be due to the condensation of magmatic vapour at a late stage in the crystallization of the Senj deposit. At hydrostatic pressure, the temperatures of QM and QP veins are consistent with palaeowater table depths of c. 2 km (Fig. 16). The above-mentioned distinctive features of the Senj deposit may imply that the ore-forming fluids migrated along the fault-fracture zone, and the temperature of the hydrothermal system decreased rapidly due to interaction with meteoric waters. The rapid temperature decrease could have prematurely terminated potassic alteration, with extensive phyllic alteration becoming dominant and leading to Mo–Cu mineralization that is mainly associated with phyllic alteration (e.g. Ohio Creek in New Zealand; Brathwaite et al. Reference Brathwaite, Simpson, Faure and Skinner2001), but not with potassic alteration. The early quartz stockwork vein (QBC) mineralization at the Senj deposit might also belong to a porphyry system (e.g. Li et al. Reference Li, Ni, Wang, Zhu, Pan, Chen, Huang, Yuan, Wang and Fang2017; Cao et al. Reference Cao, Yang, Mavrogenes, White, Xu, Li and Li2019).
Some characteristics of the Senj deposit are similar to some alkaline Mo–Cu porphyry-like systems (e.g. Xiongcun in Tibet; Xu et al. Reference Xu, Pan, Qu, Hou, Yang, Chen, Yang and Cui2009), such as (1) a structurally controlled mechanism of mineralization, (2) multiple hydrothermal periods and associated sequential veins, (3) occurrence of sericite/illite, biotitization and K-feldspar alteration, (4) Mo–Cu mineralization accompanied by calc-alkaline high-K host rocks, and (5) shallow mineralization depth (about 2 km). The Senj Mo–Cu deposit may thus be genetically related to the alkaline system, but no causative porphyritic alkaline rocks have yet been found in the Senj area. The Senj deposit is also distinct from typical alkaline systems (Jensen & Barton, Reference Jensen, Barton, Hagemann and Brown2000) by the rarity of telluride-bearing minerals.
11. Conclusions
The Senj Mo–Cu deposit is located within altered volcano-sedimentary and calc-alkaline high-K intrusive rocks, in a back-arc tectonic setting. It is proposed here that the formation of quartz stockwork Mo–Cu mineralization is synchronous with the emplacement of a middle Eocene (39.7 ± 0.4 Ma) monzonitic sill within porphyritic crystalline tuff (Karaj Formation). The abundance of multitype FIs (L-, V- and S-type inclusions) coinciding with the highest-grade Cu mineralization (QBC veins) suggests that brine–vapour unmixing and phase separation plays a vital role in metal precipitation and alteration zonation. Consequently, in the later phase of hydrothermal fluid evolution, where reduced conditions prevailed, sulphide mineralization occurred in a pressure-temperature (PT) condition reflected by the L- and V-type fluid inclusions. This is followed by the main molybdenum mineralization in the QM veins. After the episodic boiling and expansion of water–rock interaction, the magmatic–hydrothermal system evolved towards lower temperatures, and lower-salinity conditions associated with the generation of late-stage quartz–sericite/illite alteration–mineralization (QP veins). Finally, as the hydrothermal system waned and cooled (<250 °C) in the late calcite veins, low-temperature and -salinity fluids were likely added to the hydrothermal system after the main ore stage, which likely originated from the surficial meteoric waters.
Acknowledgements
This work was funded by the Bu-Ali Sina University (grant number. 296-99/A), from which the first author received financial support. The authors acknowledge financial support from the Iranian Mines and Mineral Industries Development and Renovation Organization (IMIDRO). We thank K Sparks and JH Curtis for help with isotopic analyses. We also wish to thank many geologists and the management of Pichab Kavosh Consulting Engineers (PKCE) for their generous assistance during fieldwork and drill hole sampling. We are also grateful to Editor Dr Tim Johnson, and anonymous reviewers for their critical and constructive reviews, which significantly improved the manuscript. We thank Camilla M. Wilkinson (Geological Survey of Norway) for language improvement.