

As a core principle of democratic theory, political scientists stress the importance of more inclusive and diverse elected bodies (Mansbridge Reference Mansbridge1999; Phillips Reference Phillips1995; Pitkin Reference Pitkin1967; Williams Reference Williams1998; Young Reference Young2000). A large portion of that literature discusses the positive symbolic effects of elected bodies when they come closer to mirroring the population from which they are drawn. For underrepresented groups, increases in their descriptive representation symbolize a more open political arena. This improves the group's political participation as well as beliefs about the group's role in politics.
Given their history of political exclusion and disadvantage, women are often the focus of this research (Mansbridge Reference Mansbridge1999; Phillips Reference Phillips1995; Sapiro Reference Sapiro1981; Williams Reference Williams1998; Young Reference Young2000). Scholars evaluate many “attitudinal and behavioral effects that women's presence in positions of political power might confer to women citizens” (Lawless Reference Lawless2004, 81), but improvement in the belief in women's ability to govern is understudied. So far, empirical investigations of the symbolic effects of women's descriptive representation do not thoroughly investigate this potential effect. Existing studies focus on other political attitudes and behaviors, such as women's political engagement, interest, and participation (Atkeson Reference Atkeson2003; Atkeson and Carrillo Reference Atkeson and Carrillo2007; Barns and Burchard 2010; Burns, Schlozman, and Verba 2001; Norris and Krook Reference Norris and Krook2009; Reingold and Harrell Reference Reingold and Harrell2009; Wolbrecht and Campbell Reference Wolbrecht and Campbell2007).
The small number of comparative and longitudinal studies also limits the current research. Only a handful of studies are cross-national, leading to strong calls to expand the analysis to more regions and countries (Burns, Schlozman, and Verba 2001, 349; Desposato and Norrander Reference Desposato and Norrander2009, 162). Furthermore, only Barns and Burchard (2010) employ a comparative, longitudinal design that establishes a dynamic relationship between women's descriptive representation and symbolic effects for women. Yet the analysis is limited to Sub-Saharan Africa.
This article is the first to present a broadly comparative, longitudinal analysis of the mutual influence between change in women's presence in parliaments and change in women's beliefs in women's ability to govern. I evaluate the relationship between change in the percentage of women in parliaments and change in the belief in women's ability to govern from the early 1990s to the mid-2000s across 25 developmentally and culturally diverse nations. The sample of 25 countries not only covers nearly every cultural zone, but, population-wise, it also includes some of the largest countries from different regions. Granted, while the sample of nations is diverse and covers the longitudinal dimension, it is small. The evidence base is far from being exhaustive in either space or time. Nonetheless, until a wider base is available, the analysis presented here is a step forward from what has been done comparatively and longitudinally in the existing literature.
The analysis of the relationship between women's presence in parliaments and women's beliefs in women's ability to govern is conducted in two stages. First, I use hierarchical linear modeling (HLM) to establish whether change in the percentage of women in parliament from the early 1990s to the mid-2000s explains the variation in support for women's ability to govern in the mid-2000s (among 30,000 individuals nested in 25 countries), especially among women. Establishing a cross-level relationship between change in the percentage of women in parliament and women's support for women's ability to govern is a necessary first step before moving on to the second stage: the comparative, longitudinal analysis of the mutual influence between country-level change in women's presence in parliaments and country-level change in women's beliefs in women's ability to govern. To conduct this analysis, I use seemingly unrelated regression (SUR) to identify the extent to which this relationship operates as a virtuous cycle of empowerment for women.
THE LITERATURE
Among the reasons highlighted in support of descriptive representation is the symbolic benefit it has for members of groups that have experienced political exclusion (Mansbridge Reference Mansbridge1999; Phillips Reference Phillips1995; Sapiro Reference Sapiro1981; Williams Reference Williams1998; Young Reference Young2000). As Mansbridge (Reference Mansbridge1999, 2) puts it, descriptive representation can create “a social meaning of ability to rule for members of a group in historical contexts where that ability has been seriously questioned.” In similar fashion, Phillips explains that this sort of inclusion is considered necessary “for reversing previous histories of exclusion and the way these constituted certain kinds of people as less suited to govern than the rest” (1995, 40). Williams (Reference Williams1998) finds the same logic invoked in the women's suffrage movement in the United States. Suffragists like Anne Martin argued that the male dominance of politics and other areas of life led women to internalize a belief in their own inferiority to men and underestimate their capacities in areas historically dominated by men (Williams Reference Williams1998, 133). Indeed, all of these scholars agree that, as a group, women's historical exclusion from positions of political representation and their continued underrepresentation make them and their male counterparts susceptible to a belief in women's inferiority in governing in every country in the world.
Descriptive representation potentially reverses the harmful internalization of women's inferiority in political leadership by reversing the observation that women do not govern and challenging the notion that women are absent because they are unfit to govern. With improvements in women's descriptive representation, “cues” in the political environment responsible for these psychological barriers begin to change (Atkeson Reference Atkeson2003; Hansen Reference Hansen1997). When people observe women governing in the news or at political events, these observations may change discriminatory assumptions about the ideal profile of leaders and, consequently, women's ability to govern.
The change is more likely to occur among women. There is convincing evidence in the United States that increases in women's presence in political office strengthens women's involvement in politics. Scholars do not look directly at women's beliefs in women's ability to govern, but they focus on related attitudes and behaviors. These studies evaluate the impact of increases of women in legislatures on women and girl's political discussion and political activity (Wolbrecht and Campbell Reference Wolbrecht and Campbell2007), women's political engagement and activity (Atkeson Reference Atkeson2003; Burns, Schlozman, and Verba 2001; Hansen Reference Hansen1997; High-Pippert and Comer Reference High-Pippert and Comer1998; Koch Reference Koch1997; Norris and Krook Reference Norris and Krook2009; Reingold and Harrell Reference Reingold and Harrell2009; Sapiro and Conover Reference Sapiro and Connover1997), women's entry into the political arena (Carroll Reference Carroll1985), and women's campaign volunteerism and turnout (Norris, Lovenduski, and Campbell Reference Norris, Lovenduski and Campbell2004). The research shows that women are more knowledgeable, engaged, and participatory when they see women running for and occupying public office.Footnote 1
While the majority of this research supports the importance of the symbolic effects of descriptive representation for women, there are important exceptions. For instance, Lawless (Reference Lawless2004) examines pooled National Election Studies (NES) data from 1980–1998 and finds that while women represented by women in Congress offer more positive evaluations of their members of Congress, the evidence does not extend to support additional symbolic effects on women's political attitudes and behaviors. In addition, Dolan (Reference Dolan2006) examines NES data from 1990–2004 and finds little evidence that female candidates have an influence on voter attitudes and behaviors.
Fewer studies extend the analysis beyond the United States, fostering calls in the literature for more cross-national analysis (Burns, Schlozman, and Verba 2001, 349; Desposato and Norrander Reference Desposato and Norrander2009, 162). Moreover, this handful of studies follows the literature in the United States and neglects analysis of the relationship between women's descriptive representation and the belief in women's ability to govern. They look at other political attitudes and behaviors that fall under the symbolic representation thesis. Yet, importantly, this research shows that the symbolic effect of women's parliamentary presence on other attitudes and behaviors holds across culturally and developmentally diverse nations. Controlling for a country's level of development and level of democracy, they find that women's presence in parliaments positively influences women's political engagement, political interest, and participation (Barnes and Burchard Reference Barnes and Burchard2010; Desposato and Norrander Reference Desposato and Norrander2009; Kittilson and Schwindt-Bayer Reference Kittilson and Schwindt-Bayer2010; Norris and Krook Reference Norris and Krook2009).
Only one comparative study is more mixed in its findings, showing that while female representation is positively associated with attitudes about the political process, this representation does not have a stronger effect on women than men (Karp and Banducci Reference Karp and Banducci2008). Similarly, a case study of the symbolic effects of women's presence on local councils in Uganda finds both women and men's attitudes toward female leaders improve (Johnson, Kabuchu, and Kayonga Reference Johnson, Kabuchu and Kayonga2003).
Overall, both the single country and cross-national research offers more evidence in favor of, rather than against, the symbolic effects of descriptive representation for women, suggesting that women's representation should matter more for women's beliefs in women's ability to govern. I, therefore, suggest the following hypothesis:
H1.Increases in women's presence in national parliaments will have a stronger, positive influence on women's beliefs in women's ability to govern than on men's beliefs in women's ability to govern.
The literature largely neglects a cross-national, longitudinal test of the effect posited in H1. Just one study by Paxton and Kunovich (Reference Paxton and Kunovich2003) starts to move in this direction. Although they are ultimately interested in the influence of gender egalitarian attitudes on increases in women's descriptive representation, they test whether their measure of gender egalitarian attitudes is endogenous to the percentage of women in parliaments. They look at whether these attitudes affect the percentage of women in parliaments and whether the attitudes are reciprocally affected by the percentage of women in parliaments. Their test shows that the percentage of women in the legislature does not have a reciprocal effect on gender egalitarian attitudes (102). They stress, however, that the endogeneity test is inconclusive: it does not truly rule out reciprocity because a conclusive elimination is impossible with a purely cross-sectional analysis that does not cover at least two points in time. With data that cover two points in time, this study offers a more conclusive test of reciprocity.
The idea of a reciprocal relationship between change in the percentage of women in parliaments and change in women's beliefs in women's ability to govern is a virtuous cycle. Increases in women's presence in parliament will improve women's beliefs in women's ability to govern, which will lead more women to pursue political office, which ultimately increases women's presence in parliament. These are the underlying assumptions that guide the second hypothesis:
H2.There is a positive, reciprocal relationship between change in women's parliamentary presence and change in women's beliefs in women's ability to govern.
In addition to change in women's presence in parliament, there are other characteristics of countries that likely affect support for women's ability to govern, as discussed below.
Development
Increases in the level of societal development in a country are strongly linked to increases in gender equality values, including the acceptance of women as political leaders (Alexander and Welzel Reference Alexander and Welzel2011a; Inglehart and Norris Reference Inglehart and Norris2003, 127–146). In their path-breaking work on this topic, Inglehart and Norris conclude that “egalitarian attitudes toward women in office are more widespread in postindustrial societies, reflecting broad patterns of socioeconomic development and cultural modernization” (2003, 144). Indeed, as societies modernize, conditions and traditional authority structures that perpetuate women's public exclusion erode, and shifts in concern with the scarcity of women's public involvement and power rise. Thus, in less developed democracies with agrarian and industrial economies, the level of societal development creates a cultural barrier to the development of gender egalitarian orientations and the practice of gender equality. The belief in women's ability to govern and gender equality in women's recruitment and presence in national parliaments are among these views and practices (Inglehart and Norris Reference Inglehart and Norris2003). An important question, then, is whether increases in women's descriptive representation in parliaments still matter for the belief in women's ability to govern even if varying levels of societal development are taken into account.
Religious Beliefs
In addition to societal development, a broader literature identifies religion as a primary agent of socialization with regard to gender roles in every society in the world (Franzmann Reference Franzmann2000; Inglehart and Norris Reference Inglehart and Norris2003). There is evidence that religious organizations from all religious faiths support traditional and subordinate roles for women (Alexander and Welzel Reference Alexander and Welzel2011b; Inglehart and Norris Reference Inglehart and Norris2003). When it comes to women's political leadership, in particular, cross-national studies link religious beliefs to fewer women in parliaments (Kenworthy and Malami Reference Kenworthy and Malami1999; Paxton and Hughes Reference Paxton and Hughes2007; Paxton and Kunovich Reference Paxton and Kunovich2003). Thus, this study evaluates religiosity as another key control of the relationship between the presence of women in parliament and the belief in women's ability to govern.
The Communist Legacy
Whether countries have a communist legacy is also relevant to the development of women's representation and the acceptance of women as political leaders. The communist countries of Eastern Europe were leading examples of high percentages of women in parliaments from 1950 to 1985 (Wide Reference Wide2002, 3). To conform to Marxist-Leninist ideology and more quickly industrialize, these countries mandated that women enter the workforce and created policies designed to facilitate women's dual roles as worker and mother (Gal and Kligman Reference Gal and Kligman2000; Kolinsky Reference Kolinsky1993; Rueschemeyer and Schissler Reference Rueschemeyer and Schlisser1990; Wolchik and Meyer 1985). Banaszak's (2006) comparison of East and West Germany from 1991 to 2004, for example, suggests that a communist legacy could have a positive effect on the belief in women's ability to govern. Compared to West Germans, East Germans showed stronger support for gender equality, and these differences lasted nearly fifteen years beyond unification (Banaszak Reference Banaszak2006, 52).
To the contrary, the communist legacy—combined with the social, economic, and political instability that followed the fall of communism—led to the end of quotas for women and a dramatic decline in the percentage of women elected to parliament (Rueschemeyer Reference Rueschemeyer1995; Saxonberg Reference Saxonberg2000). And, while Banaszak's study suggests otherwise, Einhorn (Reference Einhorn1993) and Duffy (Reference Duffy2000) find that women have since failed to mobilize around feminist aims in these societies. Rueschemeyer (Reference Rueschemeyer1995) suggests that an antifeminist political culture emerged after the fall of communism, which linked discussions of gender equality to communist rhetoric over equality and exploitation. Moreover, some scholars suggest that parliaments were symbolic sites of power under communism, and this is one of the reasons women had higher percentages in parliaments relative to other positions of power (Galligan and Clavero Reference Galligan and Clavero2008, 152; Saxonberg Reference Saxonberg2000). The ambiguity of effects across studies makes the communist legacy a key control for this analysis.
Level of Democracy
Through the provision of political liberties and civil rights, democracy enhances political participation and social representation. The impartial institutionalization of these liberties and rights establishes norms that support human autonomy and tolerance of social diversity, contributing to a political climate that is conducive to gender egalitarian attitudes and women's formal representation. Thus, many of the cross-national studies in the literature include a measure of a country's level of democracy (see, for instance, Karp and Banducci Reference Karp and Banducci2008; Norris and Krook Reference Norris and Krook2009).
DATA AND METHODS
Hypothesis 1: Individual-Level Beliefs in Women's Ability to Govern
H1 posits that change in the percentage of women in parliament has a stronger, positive effect on women's support for women's ability to govern. To measure the dependent variable in this hypothesis, I use the World Values Survey (henceforth WVS) data for 30,000 individuals nested in the 25 countries who responded to the following question: “For the following statement I read out, can you tell me how strongly you agree or disagree? Do you strongly agree, agree, disagree, or strongly disagree?” Then the item reads: “On the whole men make better political leaders than women do.”Footnote 2 For each respondent, a higher score indicates greater disagreement with the statement that men make better political leaders than women and greater support for women's ability to govern. To test H1, I use the fifth wave data which were collected in the mid-to-late 2000s. These data are measured temporally after the measure of the change in the percentage of women in parliament. In all multivariate analyses, the variables are standardized on a 0–1 scale. The change variable's range is standardized to run from -1–1.
The analysis also includes a series of independent variables:
Change in the Percentage of Women in Parliament and Gender: Variation in the change in women's presence in parliament is measured for each country between 1990 and 2005 based on data on the percentage of women in the lower house from the Inter Parliamentary Union. The time points used to calculate the measures of change for each country were carefully selected for the analysis of H2 (see footnote 8 and Appendix). Again, in all multivariate analyses, the variables are standardized on a 0–1 scale. The change variable's range is standardized to run from −1–1. I also use the WVS's measure of gender among the 30,000 respondents to determine whether change in the percentage of women in parliament positively interacts with the gender of the respondents to explain support for women's ability to govern. Gender is coded 1 for female and 0 for male. Therefore, I expect a positive cross-level interaction between change in the percentage of women in parliament and gender to confirm H1.Footnote 3
Individual-Level Controls: As standard demographic controls, I use the fifth wave WVS data to control for a respondent's education, age, and religiosity. Respondents with a university education are given a 1, and all other respondents a 0. Age is measured in years since birth. Religiosity is measured on a 10-point scale ranging from “very important” to “not at all important” in response to the following question: “How important is God in your life?” I standardize the measure from 0–1.
Country-Level Controls: As previously discussed, I control for development with an indicator that directly measures countries’ level of gender development: the United Nations’ Development Programme's (UNDP) Gender Development Index (GDI). The GDI runs from 0 (total gender inequality in development) to 1.0 (no gender inequality in development). The index measures inequalities between women and men in basic living conditions and resources, like life expectancy, literacy, and education. I control for a country's level of gender development by looking at the influence of both the change per country from 1995 to 2005 and the average level of gender development per country during this time period.Footnote 4 I also measure whether countries are postcommunist (countries with a communist legacy are scored a 1 and all others a 0). Finally, to measure the level of democracy, I use the political rights and civil liberties index from Freedom House. I invert the scale so that higher scores indicate a higher level of democracy and take the average score from 1995–2005. This variable is then standardized to run from 0–1.
Hypothesis 2: Country-Level Change in Women's Beliefs in Women's Ability to Govern and Change in the Percentage of Women in Parliaments
H2 expects a dynamic, reciprocal relationship between change in women's descriptive representation and change in women's beliefs in women's ability to govern. The two variables are conceived of as a reciprocal system of mutually reinforcing empowerments for women. Due to data limitations, it is only possible to evaluate this reciprocity by measuring the relationship between change in women's representation and change in women's beliefs in women's ability to govern at the country-level.Footnote 5 To evaluate H2, I take the average support among women per country in the mid-1990s as my t1 measure of attitudes and the average support among women per country in the mid-to-late 2000s as my t2 measure of attitudes.Footnote 6 Then, I analyze change in this country-level measure of women's beliefs in women's ability to govern using a lagged dependent variable approach.Footnote 7 Specifically, I analyze the influence of change in the percentage of women in parliament on women's beliefs in women's ability to govern measured according to the country average in the mid-2000s, controlling for women's beliefs in women's ability measured according to the country average in the mid-1990s.Footnote 8 If change in the percentage of women in parliament passes the lagged dependent variable control, then this shows how much this variable contributes to an increase in women's beliefs in women's ability to govern above the level that the earlier perception among women suggests. In all multivariate analyses, for each time point, the variables are standardized to run from 0–1, and the change variable is standardized to run from −1–1.
Since H2 posits a bidirectional relationship, change in the percentage of women in parliament is also analyzed as a dependent variable. Under the reciprocity thesis, H2 expects the change in women's attitudes to have a positive effect on the change in women's presence in parliaments. In this case, the measurement of change in the percentage of women in parliaments mirrors the measurement of change in women's beliefs in women's ability to govern described above. I analyze the influence of change in women's beliefs in women's ability to govern on the percentage of women in parliament measured in the mid-2000s, controlling for the percentage of women in parliament in the mid-1990s. Here, too, for each time point, the variables are standardized to run from 0–1, and the change variable is standardized to run from −1–1. Seemingly unrelated regression (SUR) allows me to treat these two equations as a reciprocal system.Footnote 9 The analyses also include any significant controls in the analysis of H1 as control variables in the analysis of H2. If religiosity, measured at the individual level in the analysis of H1, is significant, then the country-level average will be used as a control variable in the analysis of H2.
FINDINGS
Change in the Belief in Women's Ability to Govern
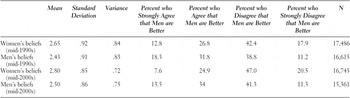
Table 1 presents the pooled individual-level data on beliefs in women's ability to govern for 25 countries. Women are more supportive than men of women's ability to govern both in the mid-1990s and the mid-2000s (p < .001). And there is a larger positive change in these attitudes among women over the time period compared to men. The mean response for women increased from a 2.65 to a 2.80, while men moved from a 2.43 to a 2.50. Thus, the gender gap in support for women's ability to govern has grown over time; it is larger in the mid-2000s. For both women and men and for both time periods, the distribution of support for women's ability to govern is slightly skewed to the left.
Descriptive statistics and frequencies for the belief in women's ability to govern (pooled cross-national dataset)

Source: Worlds Values Surveys, Waves 3 and 5. Descriptive statistics are based on responses to the question of whether men make better political leaders than women using the original four-point response scale.
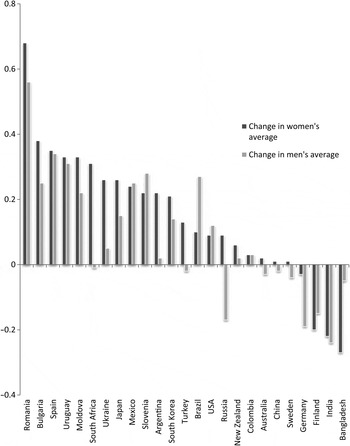
When the data are disaggregated by the change in attitudes per country, there is considerable cross-national variation.Footnote 10 Most countries have seen some increase in support for women's ability to govern. Moreover, in the majority of countries, women have grown more supportive of women's ability to govern relative to men. The positive change in women's attitudes is considerably larger, for instance, in South Africa, Ukraine, Argentina, and Turkey.
Of course, there are some important exceptions. In India and Bangladesh, a substantial decline in support for women's ability to govern has occurred among both women and men over the time period. There are also some cases where the change in attitudes for both women and men is unexpectedly low or negative. This is the case for Sweden, Germany, and Finland. We may be encountering a problem of ceiling effects with these cases. Respondents in these countries already had a high level of average support for women as leaders as measured by the WVS at t1 and, therefore, may simply have very little “room” to change given their high start values in the measure of the change in attitudes.Footnote 11
Change in Women's Presence in Parliaments
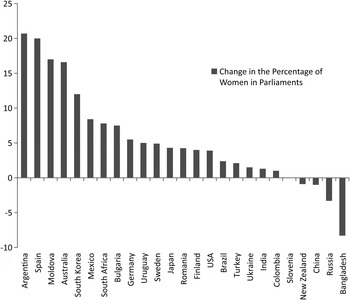
Figure 2 presents the cross-national variation in the raw change scores for women's presence in parliament. Again, there is considerable variation ranging from a minimum score of −8.3 to a maximum 20.7 with a standard deviation of 7.1. If we compare this to Figure 1, many of the countries in the top half of the distribution in the measure of change in the percentage of women in parliament are also found in the top half of the distribution in the measure of change in the belief in women's ability to govern. This is the case, for instance, for Spain, Uruguay, South Africa, Moldova, Mexico, Argentina, and South Korea. In addition, Bangladesh, the case that performed the worst in Figure 1, also performs the worst in Figure 2. The other case that performed poorly with respect to attitudes, India, is also in the bottom half of the distribution in Figure 2.
Change in the average belief in women's ability to govern, 1995–2007.
Source: World Values Surveys, Waves 3 and 5. Bars represent change in average response to the question of whether men make better political leaders than women. The change score is based on change in the average response to the original four-point scale per country from t1 to t2.

We see the largest increase in the percentage of women in parliaments in Argentina and Spain. These countries both benefited from some form of quota adoption, whether by political parties or as a matter of electoral or constitutional law.Footnote 12 Quota adoption influenced many countries around the globe over the time period covered by this study, accelerating women's progress in political representation in these countries. For instance, in countries like Argentina and South Africa, the gain in women's presence in parliament achieved over this period does not match the existential conditions women face on a daily basis. Argentina ranks 6th in the world in the percentage of women in parliaments, but 37th according to its score on the GDI (United Nations Development Program 2008). South Africa is an additional case that saw a considerable gain in women's presence in parliaments that does not match the country's level of gender development.Footnote 13 South Africa ranks 17th in the world in the percentage of women in parliaments (Inter Parliamentary Union 2009), but 95th in the world according to its score on the GDI (United Nations Development Program 2008). Cases like these demonstrate the importance and relevance of a diverse, longitudinal analysis of the influence of women's descriptive representation on the belief in women's ability to govern, particularly over a time period that has seen significant global improvements to women's representation due to quota adoption.
As a final point of comparison between Figure 1 and Figure 2, it is important to note that many of the countries with a large increase in the belief in women's ability to govern but only a minor increase in the percentage of women in parliaments are postcommunist: Romania, Bulgaria, Slovenia, and Ukraine. This suggests that there may be a positive relationship between a postcommunist legacy and change in the belief in women's ability to govern.Footnote 14 Russia, however, remains somewhat stable in its position.Footnote 15
Change in the percentage of women in parliaments, 1990–2005.
Note: Bars represent change in the percentage of women in parliament per country from t1 to t2. For specific election years, see Appendix. Source: Inter Parliamentary Union's Election Archive.

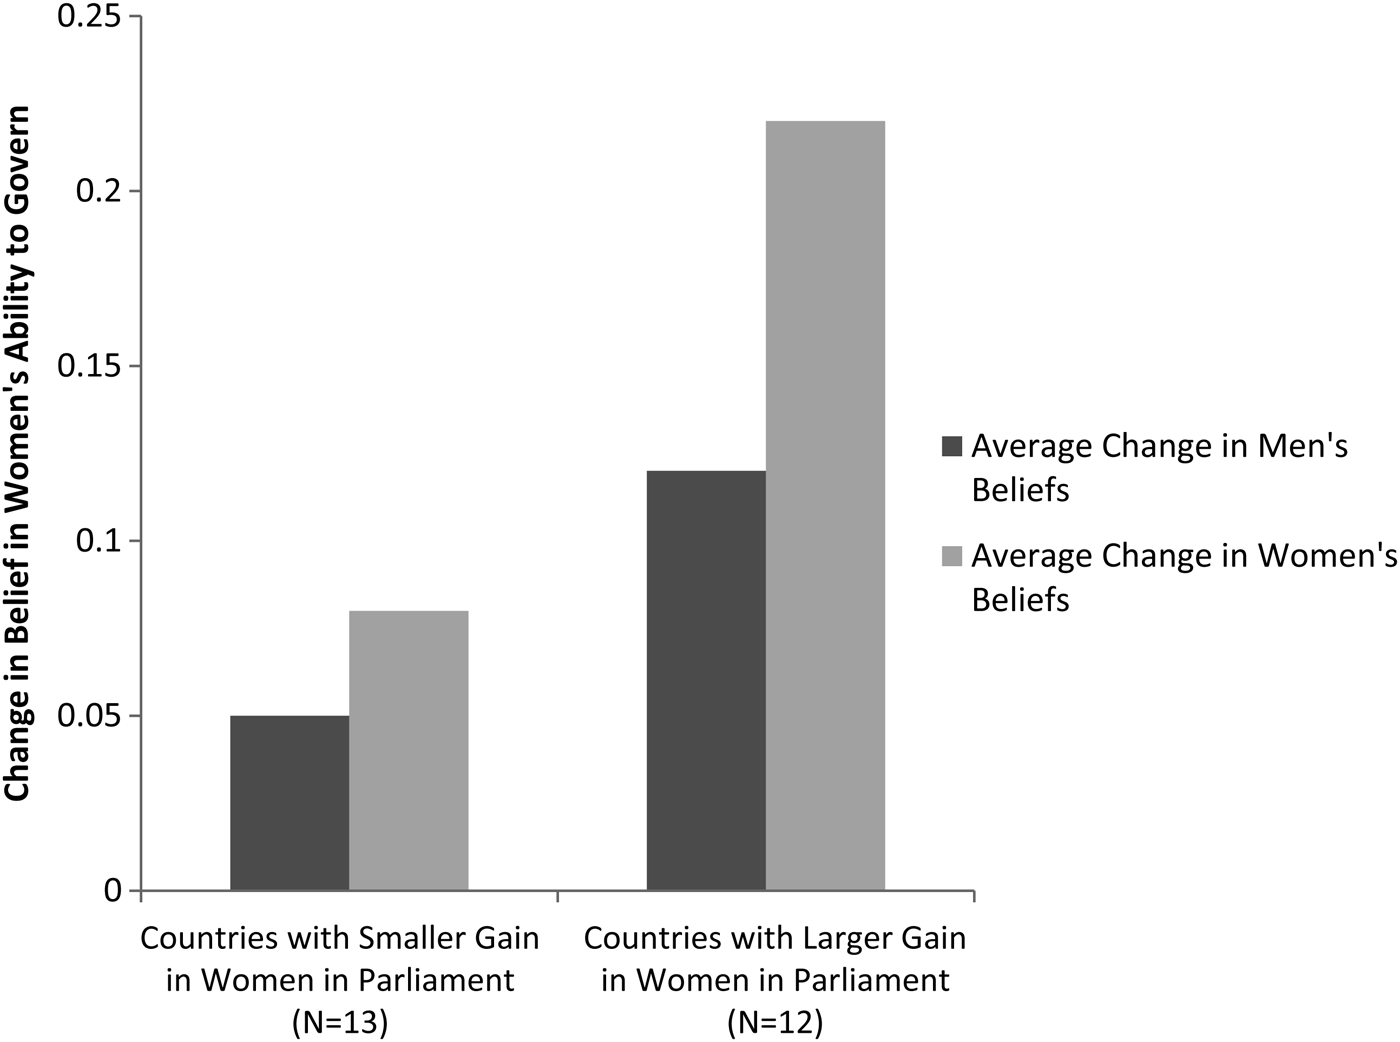
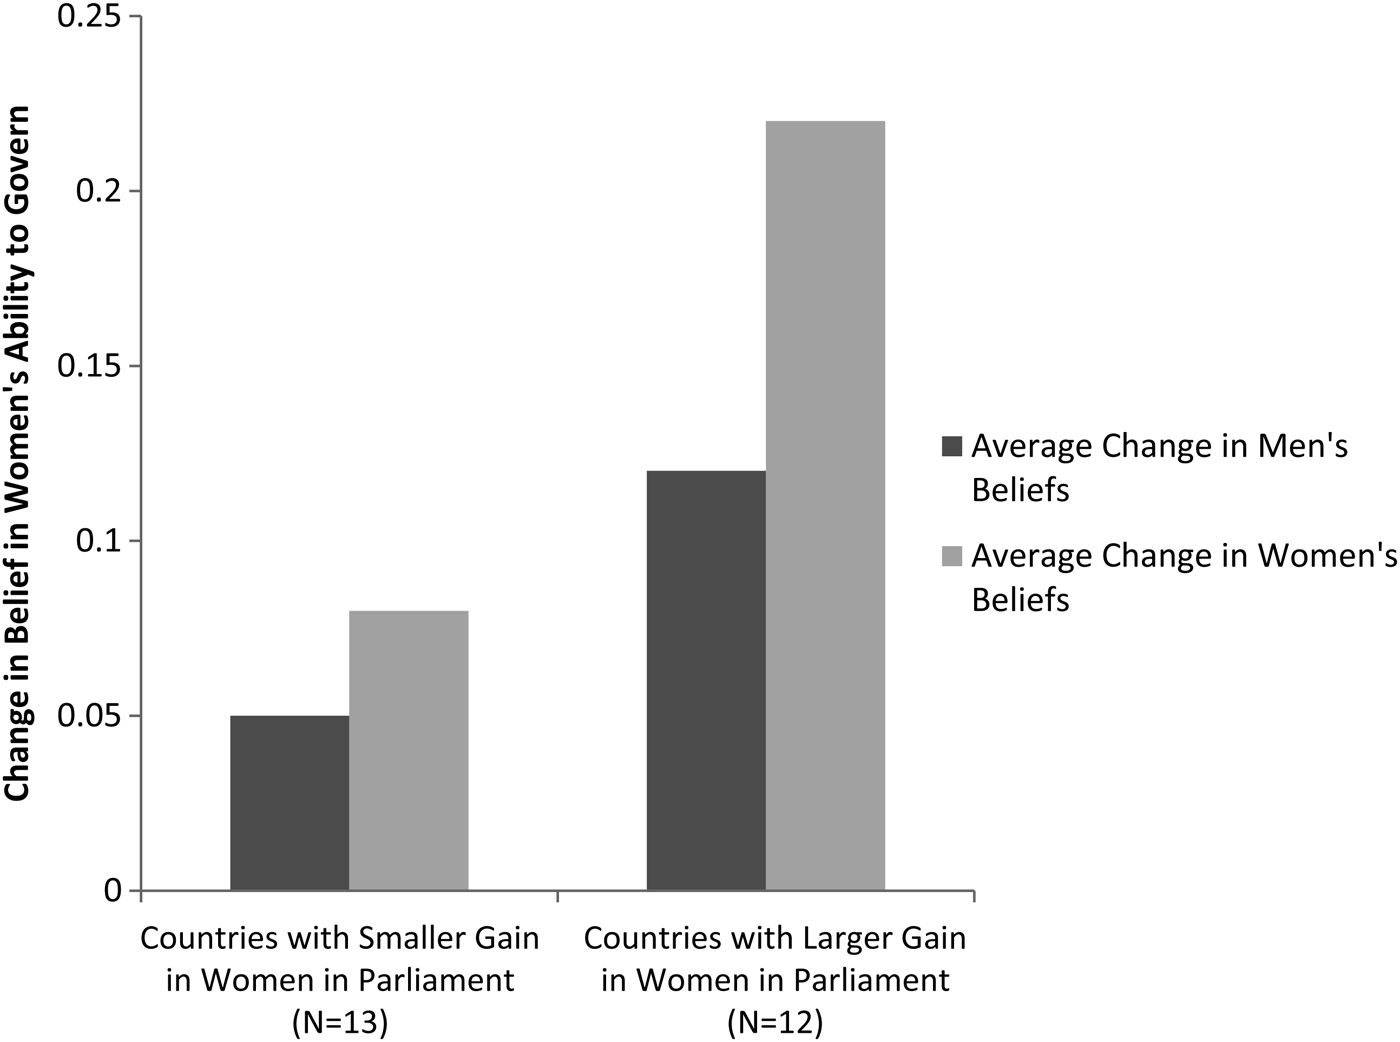
While there are some supportive patterns in the comparison of Figure 1 and Figure 2, Figure 3 directly compares the average change in support in women's ability to govern among women and men according to the level of change in women's presence in parliaments. Along the x-axis, countries are grouped according to the sample's median level of change in women's presence in parliament. Countries with a change in women's presence that is equal to or less than the sample's median are categorized as smaller gain countries, while countries with a change in women's presence that is above the sample's median are categorized as larger gain countries. Then, the average change in attitudes for men and women are compared in each category. If positive change in women's presence in parliaments more strongly increases change in women's beliefs in women's ability to govern, then, compared to men, we would expect women to have a larger average increase when moving from countries with a small gain in women's presence in parliament to countries with a large gain in women's presence in parliament. This is what we see in Figure 3. In addition, not only is the female difference larger, but the female difference is significant at p < .10, while the male difference is not.
Level of change in the % of women in parliament and change in the belief in women's ability to govern by gender.
Note: Sources are the Inter Parliamentary Union and World Values Surveys. Countries are categorized as having a smaller or larger change in women in parliament based on whether they fall below or above the median. Change scores are calculated by subtracting t1 from t2. t1: 1995–1998 for belief in ability of women to govern; 1991–1996 for women's representation. t2: 2005–2007 for belief in ability of women to govern; 2002–2007 for women's representation. Bars represent change in average response to the question of whether men make better political leaders than women. The change score is based on change in the average response to the original four-point scale.
Multivariate Analysis of H1Footnote 16
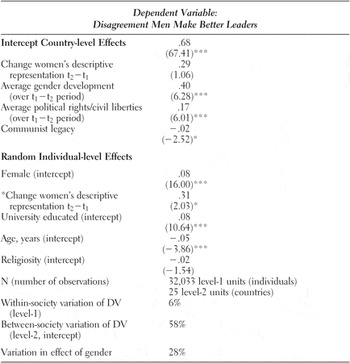
H1 expects a cross-level relationship between change in the percentage of women in parliament and women's support for women's ability to govern. Table 2 presents the results of the HLM model that tests H1. The result of the cross-level interaction between change in the percentage of women in parliaments and gender is displayed under Random Individual-Level Effects. The interaction is positive and significant (p < .05). Thus, in countries with a larger positive change in the percentage of women in parliaments, women are significantly more supportive of women's ability to govern. More precisely, one adds to women's beliefs in women's ability to govern a .30 fraction of the product term between female gender and the increase in women's descriptive representation, in addition to what female gender and the increase in representation add by themselves. In terms of explained variance, change in the percentage of women in parliaments explains about 30% of the cross-national variation in the effect of gender on the belief in women's ability to govern.Footnote 17
Cross-level explanation of the belief in women's ability to govern

Note: Entries are unstandardized regression coefficients based on robust standard errors, with t-ratios in parentheses. Individual-level variables are country-mean centered. Country-level variables are global-mean centered. Explained variances calculated from change in random variance component related to “null model.” Significance levels: *p < .05, **p < .01, ***p < .001. Analyses conducted with HLM 6.08. t1: 1995–1998 for belief in ability of women to govern; 1991–1996 for women's representation. t2: 2005–2007 for belief in ability of women to govern; 2002–2007 for women's representation.
Furthermore, country-level change in the percentage of women in parliament clearly depends on the interaction with gender for its effect on support for women's ability to govern. Under Country-level effects, change in the percentage of women in parliament is not a significant predictor of societies’ mean level of support for women's ability to govern. According to this result, change in the percentage of women in parliament affects women's beliefs, but not men's beliefs, in women's ability to govern. Thus, the cross-level analysis confirms H1. The results tell us that increases in women's presence in national parliament only improve women's beliefs in women's ability to govern.
In addition to the significant interaction, there are significant country-level and individual-level effects. At the country level, all three control variables are significant. A country's level of gender developmentFootnote 18 and level of democracy have a significant, positive effect on the mean level of support for women's ability to govern. A communist legacy relates negatively to the mean level of support for women's ability to govern. At the individual level, female respondents, younger respondents, and university respondents are more supportive of women's ability to govern. Religiosity is not significant.
Multivariate Analysis of H2
H2 suggests that increases in women's descriptive representation and women's beliefs in women's ability to govern constitute a coevolutionary system of mutually reinforcing improvements: women's achievement of political power influences women's beliefs in women's ability to govern, and women's beliefs in women's ability to govern influence women's achievement of political power. Taken together, this constitutes a virtuous cycle of mutually supportive empowerments that can be expressed in the following two equations:
 $$\eqalign{&\hbox{Women's Beliefs}\colon \;Women's \;Beliefs\;_{t2}=b_{0}+b_{1}^{\ast}Women's\; Beliefs\;_{t1} \cr &\quad +b_{2}^{\;\ast}\Delta Women \;Parliament\;_{t2-t1}+\varepsilon}$$
 $$\eqalign{&\hbox{Women's Descriptive Representation}\colon \;Women \;Parliament\;_{t2} \cr &\quad =b_{0}+b_{1}^{\;\ast}\;Women \;Parliament\;_{t1}+b_{2}^{\;\ast}\Delta Women's \;Beliefs\;_{t2-t1}+\varepsilon }$$
The first equation explains women's beliefs in women's ability to govern at time t 2 as a function of (a) its level at time t 1 and (b) change in women's descriptive representation from time t 1 to time t 2. The second equation reverses the causal arrow and explains women's descriptive representation at time t 2 as a function of (a) its level at time t 1 and (b) change in women's beliefs in women's ability to govern from time t 1 to time t 2.
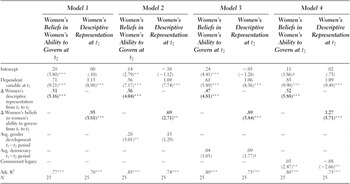
The SUR models in Table 3 treat these two equations as a reciprocal system and include the lagged variables and the control variables. The inclusion of the lagged dependent variable in both equations, as well as the inclusion of “third” external variables, will tell us whether the reciprocity is symmetrical or asymmetrical by showing whether there is a stronger effect in one direction than in the other. The regressions are kept simple. Model 1 in Table 3 displays the results of the SUR analysis including only the change variables and the lagged dependent variables. In the remaining models only one additional predictor at a time is included. This is done given the study's small sample size.Footnote 19
Women's descriptive representation and women's beliefs in women's ability to govern as a system of reciprocal relations

Note: Analysis based on Seemingly Unrelated Regression. Entries are unstandardized regression coefficients with t-statistics in parentheses. *p < .05, **p < .01, ***p < .001. t1: 1995–1998 for belief in women's ability to govern; 1991–1996 for women's representation. t2: 2005–2007 for belief in women's ability to govern; 2002–2007 for women's representation.
The models in Table 3 provide formidable tests of the direction of the relationship between increases in women's descriptive representation and women's beliefs in women's ability to govern. If the relationship only operates from descriptive representation to belief in ability, then only the b 2 coefficient of the first equation will be significant. If the opposite is true, then only the b 2 coefficient of the second equation will be significant. If, however, the relationship is indeed reciprocal and operates both ways, then both b 2 coefficients will be significant.
The key results are highlighted in boldface in all models in Table 3. All models evidence a reciprocal relationship between women's descriptive representation and women's beliefs in women's ability to govern. Change in women's descriptive representation significantly explains women's beliefs in women's ability to govern at time t 2 controlling for its level at time t 1, and change in women's beliefs in women's ability to govern significantly explains women's descriptive representation at time t 2 controlling for its level at time t 1. This system of mutually reinforcing improvements holds under control of countries’ gender development, democracy, and communist legacy.
Yet it is important to note that while the reciprocity thesis is confirmed, there is some asymmetry in this cycle of empowerment. Since all variables have been standardized, the coefficients indicate which of the two change variables has a stronger influence. Based on the size of the coefficients, in every model, the relationship operates stronger from change in women's beliefs in women's ability to govern to change in women's descriptive representation rather than the other way around. But the finding that the strength of the influence of change in women's beliefs of women's ability to govern on change in women's representation is stronger does not invalidate H2. The SUR results still demonstrate that change in women's descriptive representation and change in women's perceptions of women's ability to govern is a system of mutually reinforcing improvements in women's political leadership.
CONCLUSION
Scholars have often argued that women's descriptive representation holds symbolic importance for women. Over the last two decades, this claim has become even more relevant as the world has seen dramatic changes in women's presence in parliaments in a diversity of countries. Over this time period, women's presence in parliaments increased rapidly instead of following glacial social and cultural changes (Dahlerup and Freidenvall Reference Dahlerup and Freidenvall2005; Tripp and Kang Reference Tripp and Kang2008). Transitions to democracy and—in many African and Latin American nations—political conflicts created opportunities for domestic and international women's movements to campaign for gender quotas for national parliaments. This led to quota-induced gains in women's presence in national parliaments that do not match the level of gender inequality in other areas of life and work in these countries. These improvements in women's parliamentary presence have created new opportunities to expand the analysis of the symbolic importance of descriptive representation for women to a more diverse set of nations. So far, the comparative literature largely confirms the symbolic importance of these changes for women's political interest and participation, but the question of women's beliefs in women's ability to govern is understudied.
This study is the first to offer comparative and longitudinal evidence in support of the assumption that women's descriptive representation challenges the belief that women are unfit to govern. Among 25 countries and under important controls, an increase in the percentage of women in parliament contributes to an increase in women's beliefs in women's ability to govern. Ultimately, the analyses show that the most accurate portrayal of the relationship between women's presence in parliament and women's beliefs in women's ability to govern is a virtuous cycle of mutually reinforcing changes in women's empowerment as political leaders.
These findings have important implications. Evidence of the positive influence of increases in women's presence in parliament on women's beliefs in women's ability to govern indicates that positive strategies aimed at accelerating women's descriptive representation are potentially effective tools for eroding cultural barriers to women's political empowerment, particularly concerning women's beliefs. Evidence of the positive influence of increases in women's beliefs in women's ability to govern on women's presence in parliaments also confirms the role of culture in women's recruitment and election to public office. An extensive literature finds that women's support of women's ability as political leaders affects all aspects of the political recruitment model (Matland Reference Matland and Karam2002; Norris Reference Norris, Lovenduski and Norris1993) from women's eligibility and aspirations for political leadership to political parties’ perception of the strategic value of women's recruitment and election for winning women's votes (Paxton and Hughes Reference Paxton and Hughes2007, 103–21).
These are important findings, but this article is only a first step toward a more developed understanding of the relationship between women's presence in parliaments and the belief in women's ability to govern. This study's sample of just 25 countries and two points in time leaves open the question of whether the results generalize to a larger cross-national and longitudinal evidence base. These data limitations underscore the demands for more comparative, longitudinal analysis in the literature.
Also open for future research is the question of how women's increasingly descriptive representation affects men's beliefs in women's ability to govern in the long run. Over the relatively short period of investigation here, no positive effect has been found, at least not on a sufficient level of significance. But we cannot rule out a positive effect on men over a longer period of time.
An additional question beyond the scope of this study is, which individual-level mechanisms make women more perceptive and motivated by positive change in women's descriptive representation in their countries. There is a rich literature that identifies resources, experiences, and values that influence women's political attitudes and participation. One could imagine that more educated women or younger women are even more susceptible to positive change in their beliefs in women's ability to govern as they witness improvements in women's descriptive representation in their countries. Future research should look cross-nationally at how these individual-level mechanisms affect the cycle of positive change in women's presence in parliaments and women's beliefs in women's ability to govern.
Future research should also address how positive change in women's presence in parliaments motivates positive change in women's beliefs in women's ability to govern. For instance, when witnessing these improvements in women's descriptive representation, do women gain confidence in their competence, their likelihood of winning, the support from gatekeepers, or the ability to balance office-holding with other responsibilities that disproportionately fall on women? Female MPs often report that acting as a role model for women is one of their responsibilities as a representative. Identifying what it is about their change in presence that motivates positive change in women's beliefs in women's ability to govern could improve their ability to fulfill this representative function.
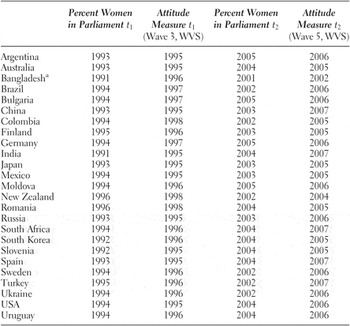
Measurement Time Points for Measure of Change in the Percentage of Women in Parliaments and Change in the Belief in Women's Ability to Govern