Nomenclature
- AFR
-
air-fuel ratio
- APU
-
auxiliary power unit
- CFD
-
computational fluid dynamics
- CI
-
compression ignition
- CRV
-
counter rotating vortices
- DICI
-
direct injection compression ignition
- DLN
-
dry low-NOx
- DMLS
-
direct metal laser sintering
- EMST
-
Euclidean minimum spanning tree
- ENABLEH2
-
enabling next-generation hydrogen combustion for gas turbines
- ER
-
equivalence ratio
- GDI
-
gasoline direct injection
- GTCP
-
gas turbine compressor power
- H2
-
hydrogen
- HPDI
-
high-pressure direct injection
- IGCC
-
integrated gasification combined cycle
- LES
-
large eddy simulation
- MCT
-
micromix combustion technology
- NOx
-
nitrogen oxides
-
probability density function
- ppm
-
parts per million
- RANS
-
Reynolds-averaged Navier-Stokes
- RSM
-
Reynolds stress model
- SST
-
shear stress transport
1.0 Introduction
Combustion, in all its forms, relies on the presence of oxygen, which is sourced from the atmosphere [Reference Scheffknecht, Al-Makhadmeh, Schnell and Maier1]. However, the atmosphere is not only composed of oxygen but also other gases like nitrogen that actively participate in the combustion process [Reference Haglind, Hasselrot and Singh2]. These additional gases combine with oxygen during combustion, leading to the formation of various harmful emissions like NOx [Reference Michaud, Westmoreland and Feitelberg3]. The presence of these harmful gases in the atmosphere has given rise to alarming issues, such as global warming [Reference Chen, Msigwa, Yang, Osman, Fawzy, Rooney and Yap4]. Additionally, society is facing the consequences of these emissions, while the Earth’s temperature continues to rise [Reference Cecere, Giacomazzi, Di Nardo and Calchetti5, Reference Déparrois, Singh, Burra and Gupta6]. Furthermore, with the widespread use of fossil fuels for combustion purposes, non-renewable energy reserves are depleting rapidly [Reference Opeyemi7]. This reliance on finite resources poses a significant challenge for future energy security and sustainability. Hence, it is imperative to prioritise the utilisation of renewable energy sources [Reference Yue, Liu and Liou8]. By doing so, the problem of air pollution from the combustion systems and their detrimental effects on both the environment and human health can be mitigated [Reference Haglind, Hasselrot and Singh9]. In this regard, transitioning towards clean energy combustion is of utmost importance [Reference Ghoniem10]. This shift would enable the reduction of various types of harmful gases emitted as combustion of fossil-based fuels, subsequently mitigating their impact on the environment [Reference Khalil and Gupta11, Reference Funke, Keinz, Kusterer, Ayed, Kazari, Kitajima, Horikawa and Okada12]. Promoting sustainable energy will reduce the dependence on non-renewable fuel sources [Reference Armaroli and Balzani13, Reference Babayev, Im, Andersson and Johansson14]. A shift towards carbon-neutral and meeting the zero-carbon emission goal for the combustion engines industry is also crucial for fulfilling upcoming legislation and also for aligning with the ambitious Flight Path 2050 objectives [Reference Caldeira, Jain and Hoffert15]. This initiative aims to substantially reduce emissions impact by targeting a 75% reduction in CO2 and a 90% reduction in NOx compared to 2000 technologies [Reference Mourouzidis, Singh, Sun, Huete, Nalianda, Nikolaidis, Sethi, Rolt, Goodger and Pilidis16].
Micromixing technology has played a crucial role in advancing combustion processes, particularly in both industrial and aero gas turbine systems [Reference Lei and Khandelwal17]. By refining fuel-air mixing on a micro-scale, micromixing has created a more homogeneous mixture, leading to more consistent combustion. This consistency has been vital in reducing localised high-temperature areas, which significantly reduced NOx emissions by up to 30–50% compared to conventional combustion methods, a key focus in modern combustion research [Reference Haglind, Hasselrot and Singh2, Reference Lopez-Ruiz, Alava and Blanco18]. Furthermore, micromixing has enhanced flame stability and combustion efficiency, with studies indicating an improvement in combustion efficiency by approximately 10–15% over conventional systems [Reference Sun, Abbott, Vir Singh, Gauthier and Sethi19]. This increased efficiency results from the more effective mixing, which not only reduces emissions but also optimises fuel consumption. Beyond just reducing NOx and other emissions, micromixing has also improved the adaptability of combustion systems to various operating conditions, ensuring consistent performance across different environments. As a result, this technology has not only addressed environmental challenges but has also supported the overall efficiency and stability of both industrial and aero gas turbine operations, contributing to a 5–7% enhancement in thermal efficiency [Reference Funke, Börner, Keinz, Kusterer, Kroniger, Kitajima, Kazari and Horikawa20, Reference Funke, Beckmann, Keinz and Horikawa21].
1.1 Hydrogen: a clean fuel
Hydrogen as a clean fuel offers the advantage of zero carbon or sulphur-based emissions [Reference Ben Abdallah, Sethi, Gauthier, Rolt and Abbott22]. Hydrogen as a fuel is more attractive due to its wider stability limits. The energy-producing industry is particularly interested in hydrogen-based combustion systems, as they have the potential to eliminate carbon-based emissions [Reference Owusu and Asumadu-Sarkodie23]. The schematic diagram depicted in Fig. 1 illustrates the comprehensive hydrogen industry chain, encompassing the various stages from production to utilisation [Reference Luo, Hu, Xu, Gao and Li24]. This chain encompasses diverse processes such as steam reforming, water electrolysis, biomass gasification, thermochemical hydrogen production and photo catalysis [Reference Kojima, Nagasawa, Todoroki, Ito, Matsui and Nakajima25, Reference Singh, Kumar, Sharma and Kumar26]. The classification of hydrogen is based on the specific production method utilised, leading to distinctions among grey hydrogen, blue hydrogen and green hydrogen [Reference Ajanovic, Sayer and Haas27]. Grey hydrogen is derived from fossil fuels with accompanying CO2 emissions, whereas blue hydrogen involves CO2 capture and storage during production [Reference Niaz, Manzoor and Pandith28, Reference Muradov29]. Green hydrogen, on the other hand, is generated through renewable energy-driven water electrolysis, making it a sustainable and carbon-free option [Reference Hassan, Algburi, Sameen and Salman30]. Understanding the intricacies of the hydrogen industry chain is vital for the effective utilisation of this versatile and clean energy resource [Reference Nandhini, Sivaprakash, Rajamohan and Vo31].
Schematic diagram of from hydrogen production to utilisation. Reproduced with permission [Reference Luo, Hu, Xu, Gao and Li24].

1.2 Challenges associated with hydrogen combustion
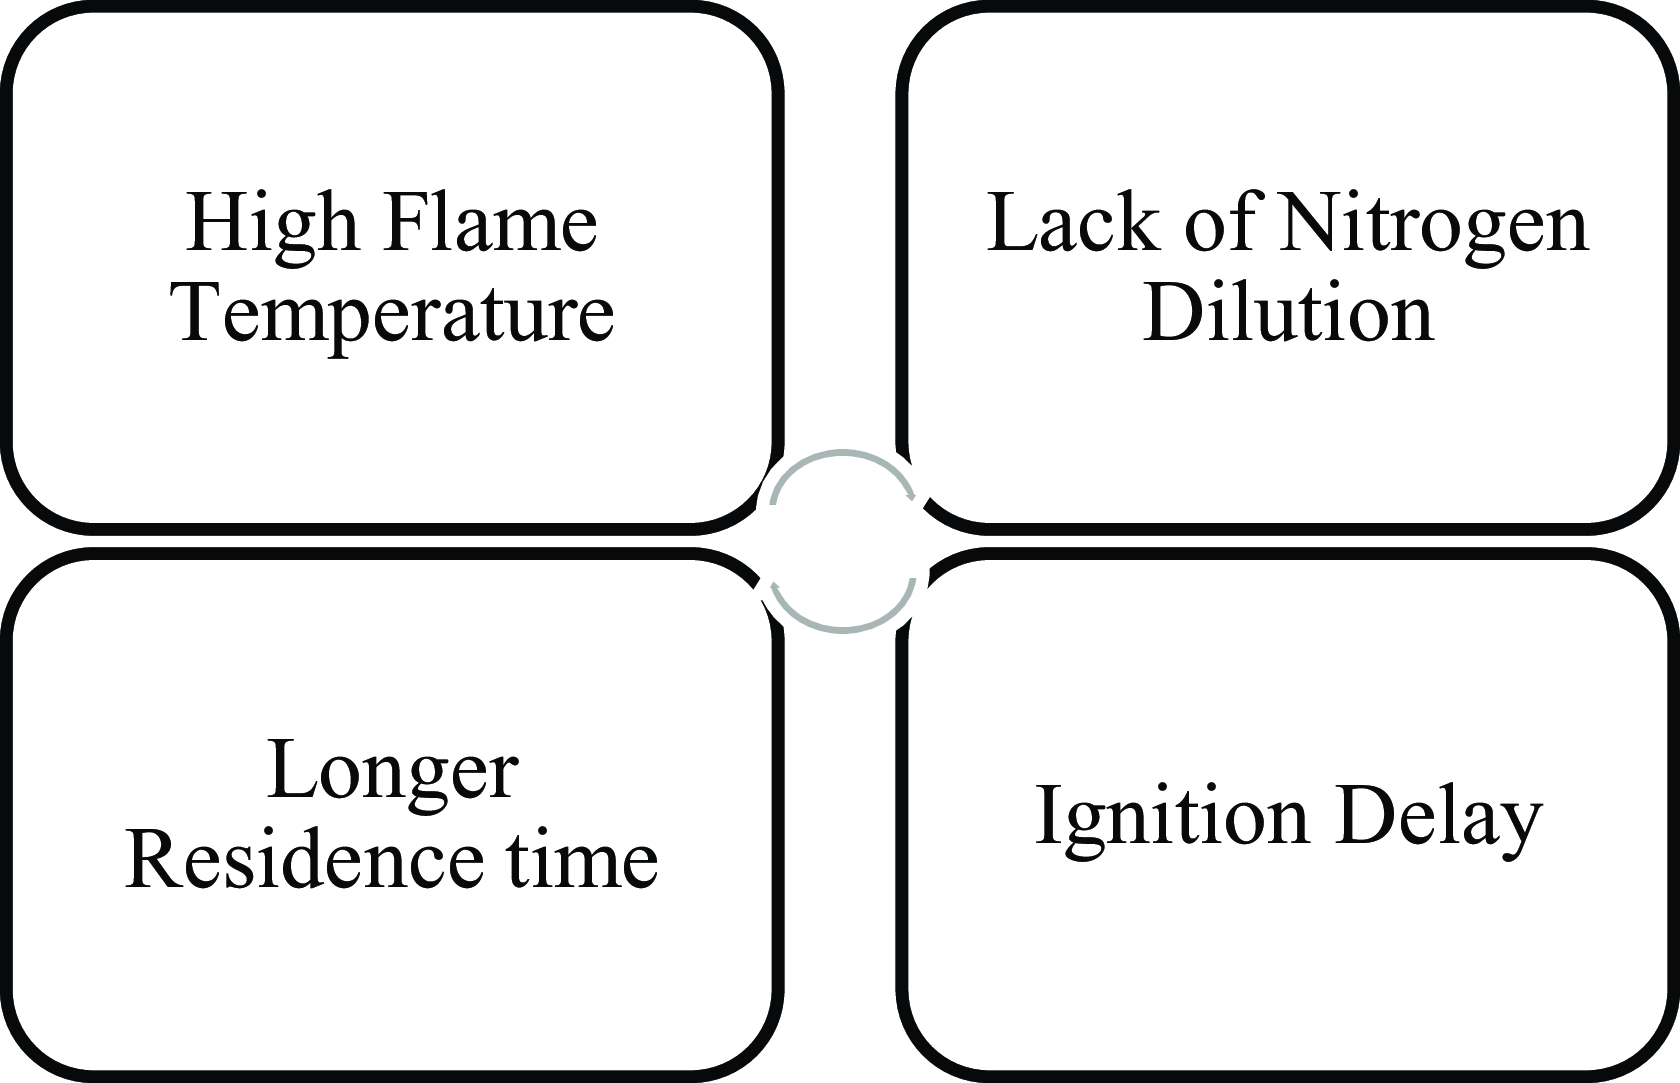
The combustion of hydrogen is marked by several unique traits, including a broad flammability range spanning from 4.0% to 75%, an exceptionally low ignition energy of 0.019 mJ, a minimal density of 0.0899 kg/m3, and an elevated adiabatic flame temperature reaching 2380 K [Reference Warnatz, Maas, Dibble and Warnatz32]. However, the physical properties of hydrogen-rich fuel mixtures differ significantly from conventional gas turbine fuels, making it impossible to directly apply well-established gas turbine combustion systems for hydrogen combustion [Reference Ghali and Khandelwal33]. However, achieving low NOx emissions requires optimisations in the combustion process through modifications in the injection system, design parameters of the combustors, suitable combination of operating attributes etc. [Reference Dahl and Suttrop34]. Another challenge that must be tackled involves the occurrence of flashback when utilising either pure hydrogen or natural gas mixtures enriched with hydrogen [Reference Maher35]. Flashback is possibly an unsafe process that can occur in certain combustion systems, such as gas turbines or gas burners. It takes place when the flame transmits in reverse direction from the combustion region into the fuel and air supply system, thus causing shock waves of pressure nonconforming the usual combustion process [Reference Funke, Beckmann and Abanteriba36]. The factors responsible for flashback are high velocity, high pressure, combustion instabilities, exhaust gas recirculation system, carbon deposits, fuel composition, inadequate mixing, etc. [Reference Liu, Sun, Sethi, Nalianda, Li and Wang37]. The non-premixed combustion system and flame miniaturisation are useful ways to reduce the flashback [Reference Yang, Zhao, He, Dong and Tan38]. It can be controlled by using a zero or very short intersecting flame with slow speed. Few approaches that have been studied to reduce the flashback are related to flame arrestors, intake manifold design, exhaust system design, combustion chamber geometry, fuel injection, air-fuel ratio control, etc. [Reference Choi, Ahn, Kwak, Lee and Yoon39]. When hydrogen is utilised as fuel in conjunction with air, the primary focus in tailpipe emissions shifts solely to NOx emissions [Reference Fayaz, Saidur, Razali, Anuar, Saleman and Islam40]. The combustion process must be further changed and optimised through modification in the combustion system designs, exhaust gas recirculation to attain low NOx emissions [Reference Funke, Börner, Robinson, Hendrick and Recker41]. The key factors that promote NOx formation during hydrogen combustion are provided in Fig. 2. NOx formation primarily occurs through elevated flame temperatures, which promote the thermal NOx pathway as nitrogen and oxygen react under high thermal energy [Reference Schefer, White and Keller42]. Inadequate nitrogen dilution in the combustion air promotes NOx formation by providing more nitrogen to react with oxygen at these elevated temperatures. Furthermore, delayed ignition prolongs the exposure of reactants to high temperatures, thereby further promoting NOx production.
The factors promote NOx formation.

The researchers in the literature have provided the several approaches to reduce the NOx emissions from hydrogen combustion (Fig. 3). As a result, it is crucial and demanding to develop hydrogen combustion technologies that minimise NOx emissions [Reference Dennis, Long and Jesionowski43].
Methods and approaches for NOx reduction.

1.3 Micromix combustion technology
The utilisation of micromix combustion technology presents a promising approach for mitigating NOx emissions. This approach involves the miniaturisation of the combustion zone, reduction of reactant residence time and enhancement of mixing intensity through innovative designs such as jet-in-crossflow configurations [Reference Lei and Khandelwal17, Reference Funke, Börner, Keinz, Kusterer, Kroniger, Kitajima, Kazari and Horikawa20]. The primary aim of these efforts is to achieve notable reductions in NOx emissions while fully exploiting hydrogen’s potential as a fuel in gas turbine systems [Reference Lei and Khandelwal17]. The exploration of micromix combustion technology for aerospace engines was initially investigated by Aachen University [Reference Haglind, Hasselrot and Singh2]. This innovative approach involves a configuration consisting of multiple hydrogen flames, taking advantage of the wider stability limits offered by hydrogen to enable operation under lean conditions. By operating at lower flame temperatures, the production of NOx is reduced [Reference Lopez-Ruiz, Alava and Blanco18]. Moreover, hydrogen’s high molecular diffusivity and flame speed promote swift mixing and shorter residence time, thereby minimising NOx production [Reference Sun, Abbott, Vir Singh, Gauthier and Sethi19]. The micromix principle further aids in achieving thorough combustion of injected fuel within the narrow inter-vortex shear layer, thus preventing excessive fuel concentration and high-temperature peaks, which are significant contributors to elevated NOx formation. Micromix combustion technology has evolved significantly from its first to sixth generation, resulting in effective control of NOx emissions in gas turbines [Reference Funke, Beckmann, Keinz and Horikawa21].
The need for micromix hydrogen combustion arises from the utilisation of the jet crossflow principle and miniaturised multiple injectors for the utilisation of the hydrogen, as depicted in Fig. 4 [Reference Lopez-Ruiz, Alava and Blanco18]. In micromix combustion, the momentum flux ratio represents the balance between the injected fuel jet and the surrounding air crossflow, influencing fuel-air mixing, flame stabilisation, and NOx emissions [Reference Funke, Börner, Keinz, Kusterer, Kroniger, Kitajima, Kazari and Horikawa20, Reference Gupta, Ibrahim and Amano44]. The momentum flux ratio (J), also known as the momentum ratio, is a dimensionless parameter that quantifies the relative momentum between two interacting fluid streams, typically in jet-in-crossflow or fuel-air mixing studies [Reference Gupta, Ibrahim and Amano44]. It is defined as:
 \begin{equation*}J = \frac{{{\rho _{f \times U_f^2}}}}{{{\rho _{a \times U_a^2}}}}\end{equation*}
where,
2D view of the micromix combustion technology showing the jet in cross flow. Reproduced with permission [Reference Lopez-Ruiz, Alava and Blanco18].

 ${\rho _f}$
and
 ${U_f}$
are the density and velocity of the injected hydrogen fuel,
 ${\rho _a}$
and
 ${U_a}$
are the density and velocity of the surrounding air.
A well-optimised J ensures efficient micromixing, preventing flashback while promoting stable combustion and ultra-low NOx emissions.
This technique entails the injection of gaseous hydrogen perpendicular to an air stream, facilitated by hydrogen segments and air guiding panels serving as bluff bodies to enhance vortex formation [Reference Kroniger, Horikawa, Funke, Pfaeffle, Kishimoto and Okada45, Reference Funke, Beckmann, Stefan and Keinz46]. Through the flame splitting method, the reaction zone is divided into numerous diffusion turbulent flames anchored between inner and outer vortices. This segmentation reduces the volumes of high temperature where thermal NOx formation rates typically escalate, leading to an overall decline in thermal NOx formation [Reference Mohan and Matalon47]. Micro flames, developed and anchored at the burner segment edge downstream of the injector nozzle, contribute significantly to this reduction in NOx formation. Premixed flames are inherently better mixed, which delivers more uniform temperature distribution and lower thermal NOx, although they are not safe against flashback, which limits their application. However, the high temperatures associated with the diffusion flames enhance NO formation, while beneficial for flashback control [Reference Kim, Park, Kwon, Yun, Keel and Kim48].
Figure 5 depicts micromix combustion technology utilising premixed flames, where fuel and air are thoroughly mixed before entering the combustion chamber [Reference Hussain, Abdelhafez, Nemitallah, Araoye, Ben-Mansour and Habib49]. It shows the introduction of premixed fuel-air mixtures into the combustion zone, designed to enhance mixing and stabilise the flame [Reference Lacarelle, Moeck, Konle, Vey, Nayeri and Paschereit50]. Figure 5 highlights how this configuration ensures uniformity in the fuel-air mixture and promotes efficient combustion [Reference Hussain, Abdelhafez, Nemitallah, Araoye, Ben-Mansour and Habib49]. By thoroughly homogenising the mixture before ignition, this approach minimises localised high-temperature regions that could lead to increased NOx formation. Figure 5 illustrates the advantages of premixed flames in achieving better mixing characteristics and flame stability, leading to improved efficiency and reduced emissions [Reference Rashwan, Nemitallah and Habib51, Reference Nemitallah, Rashwan, Mansir, Abdelhafez and Habib52].
Swirl multi-nozzle micromix combustor: (a) cross-sectional view of the combustor’s internal structure, (b) method of mixing fuel with oxidiser, (c) array of honeycomb nozzles, (d) components involved in the combustor assembly. Reproduced with permission [Reference Chen, Zhang, Qiu, Zhu, Zhang, Chen, Sun and Zhao53].

1.4 Diffusion and premixed flames
Diffusion and premixed flames exhibit distinct characteristics that influence their combustion performance and applications. In diffusion flames, fuel and oxidiser mix at the reaction zone through diffusion, resulting in a less uniform temperature distribution and higher NOx emissions. These flames have longer residence times, broader reaction zones and variable combustion stability, often leading to incomplete combustion [Reference Quintino, Ribeiro and Fernandes54, Reference Xu, Gao, Yang, Gan, Yang and Zhang55]. However, their key advantage lies in their resistance to flashback, making them suitable for applications where safety is a priority [Reference Kalis, Marinaki, Strautins and Barmina56, Reference Agarwal, Kumar and Shakher57].
In contrast, premixed flames involve thorough mixing of fuel and oxidiser before combustion, ensuring a more uniform temperature distribution and lower thermal NOx emissions. They feature shorter residence times and thin reaction zones, which enhance combustion efficiency [Reference Nemitallah, Rashwan, Mansir, Abdelhafez and Habib52, Reference Zhang, Yu, Guo and Wang58]. Despite these benefits, premixed flames are inherently inclined to flashback, limiting their application in systems requiring high stability [Reference Sen, Gangopadhyay, Bhattacharya, Mukhopadhyay and Sen59]. Within micromix combustion technology, miniaturised diffusion flames are commonly used to prevent flashback while maintaining stable operation. Although premixed micromix combustion shares some similarities, its fundamental mechanism differs, influencing its practical viability in combustion systems [Reference Funke, Keinz, Kusterer, Ayed, Kazari, Kitajima, Horikawa and Okada12, Reference López-Juárez, Sun, Sethi, Gauthier and Abbott60].
A meticulous review on the three-decade journey in low-emission combustor research with hydrogen-rich fuels at Aachen University of Applied Sciences, focusing on the development and optimisation of micromix technology, showcasing its efficacy in real gas turbine operations, is published [Reference Funke, Beckmann, Keinz and Horikawa21]. However, the concept of micromix combustion technology has been extensively studied by researchers throughout the world. Despite numerous research papers in this field, a holistic review paper on the micromix combustion technology with hydrogen on NOx emissions is so far lacking. Therefore, this paper seeks to address this disparity by offering a comprehensive review that underscores the pivotal subject of micromix combustion technology and its implications for NOx formation. By delving into the intricate details of micromix combustion, the study explores how this innovative technology can enhance the combustion process, ensuring complete fuel utilisation while minimising the formation of pollutants. The review article covers the effect of injector design, combustion chamber geometry, fuel energy density, fuel blends, equivalence ratio and blockage ratio on NOx emission formation. Additionally, flame stabilisation mechanisms, crucial for maintaining consistent combustion within the chamber, are discussed. It pretends to serve as a valuable resource for researchers, providing insights into the latest advancements and future prospects in the field of hydrogen combustion with lower NOx emissions.
2.0 Literature Review
The intricate dynamics of combustion efficiency and emissions profile in combustion systems are explored with hydrogen in the literature review, which considers micromix combustion technology. One important aspect being looked at is the design and arrangement of nozzles or injectors. Researchers have used the numerical simulations to assess their impact on NOx emissions. The study also examines the complexities of combustion chamber design, including features like dilution holes, annular geometry, burner head configurations and flame stabilisation. The equivalence ratio is explored to understand how it affects the combustion efficiency. The effects of using different fuel blends are also examined, aiming to understand their implications on efficiency and emissions. This comprehensive exploration aims to offer insights into optimising combustion processes for better combustion systems performance and reduced environmental impact. This study explores the effects of diffusion and premixed flames in industrial and aero gas turbines by analysing key parameters such as injector design, air gate configuration, blockage ratio, combustor geometry, fuel energy density, fuel blends and equivalence ratio. In industrial turbines, these factors primarily influence diffusion flames, enhancing flame control and reducing NOx emissions. In aero turbines, the focus is on premixed flames, where precise management of these parameters lowers flame temperatures and improves emission control. The study offers a detailed understanding of how these variables impact combustion performance and emissions in gas turbine systems. The study has highlighted significant distinctions between diffusion and premixed flame approaches within the micromix combustion framework.
2.1 Effect of injector design and air gate configuration on blockage ratio
The researchers investigated the potential application of the micromix combustion technology in industrial and domestic combustion systems, focusing on the use of pure hydrogen fuel to minimise NOx emissions. To achieve this goal, the researchers conducted computational fluid dynamics (CFD) simulations and experiment to explore novel configurations. These simulations and experiments allowed them to analyse how different setups could effectively utilise the micromix combustion principle for efficient and low-emission combustion processes [Reference Lei and Khandelwal17]. The study examined how nozzle design and arrangement impact NOx emissions. It also differentiated between diffusion and premixed flame cases to analyse their distinct effects on combustion and emission characteristics. A premixed flame involves the combustion of a fuel-air mixture that is prepared before ignition, while a diffusion flame results from the separate flow of fuel and air that must be mixed before combustion. Both types of flames require fuel and air to combine for burning to occur. However, flame spreading is enhanced by the presence of a premixed flame at the leading edge of a larger diffusion flame, where most of the vaporised fuel is burned [Reference Hamins, Kashiwagi and Buch61, Reference Degroote and Garcia-Ybarra62]. Premixed and diffusion flames exhibit different behaviours under varying conditions. Premixed flames generally propagate more quickly than diffusion flames. This faster propagation in premixed flames is because ignition occurs directly with the prepared mixture, whereas in diffusion flames, there is a delay. This delay is due to the time required for the fuel and air to mix and form a flammable mixture after ignition. Therefore, the fundamental difference in their behaviour is related to how and when the combustion mixture is prepared and ignited [Reference Quintiere63, Reference Zanganeh, Moghtaderi and Ishida64]. Furthermore, this section emphasises the significance of air gate design and blockage ratio in achieving effective flame stabilisation. Since the blockage ratio is inherently linked to the injector design, particularly the air gate configuration, it plays an essential role in maintaining combustion stability. Both parameters directly influence the mixing process, which in turn affects the stability and emission characteristics of micromix combustion. Variations in air gate geometry and blockage ratio have a substantial impact on flame stabilisation, making their optimisation essential for ensuring a controlled combustion process. Properly designed air gate and blockage configurations contribute to reduced NOx emissions and improved combustion efficiency, especially in hydrogen-fueled micromix systems. The subsequent literature review explores micromix combustion technology, focusing on the characteristics of premixed and diffusion flames, their influence on combustion performance and emissions, and their applications in aero gas turbines and industrial turbines.
The use of diffusion flames in micromix combustion technology has been explored extensively for its application in industrial and aero gas turbines, Lopez-Ruiz et al. [Reference Lopez-Ruiz, Alava and Blanco18] investigated the use of 100% H2 as fuel for burner reducing the NOx and flashback by using micromix combustion technology. They performed CFD simulations under adjusted parameters to explore the application of micromix combustion technology in both industrial and domestic boilers. These parameters included energy densities, air-fuel equivalence ratios and pre-heated air temperatures. They compared numerical results with experimental results from the literature and modified the burner with geometry scaling as depicted in Fig. 6 and results showed that the value of NOx ranging from 4 to 14 ppm for a specified condition, such as temperature and equivalence ratio. This happened due to varying the diameter of air guiding channel for both industrial as well as domestic boiler causes the changes in the direction of flow as well as quantity of air supplied for complete burning of hydrogen.
Geometry scaling in the industrial burner and domestic burner showing the differences with respect to the reference geometry. Reproduced with permission [Reference Lopez-Ruiz, Alava and Blanco18].

Another researcher investigated on the variation in nozzle diameter and other parameters in a similar manner, Funke et al. [Reference Funke, Beckmann and Abanteriba36, Reference Kroniger, Horikawa, Funke, Pfaeffle, Kishimoto and Okada45] developed a micromix combustor with low emissions specifically tailored for industrial gas turbines powered by hydrogen, prioritising emission reduction, enhanced combustion efficiency, stability and increased thermal power output. The authors have utilised an iterative optimisation process for micromix combustor development through combined experimental and numerical methods, including parametric studies and combustion simulations (Fig. 7). The optimised module, featuring a 0.84 mm nozzle diameter, demonstrated a substantial increase in thermal power output per nozzle (approx. 390%), thus reducing number of injectors from around 1600 to 300 for simplified manufacturing. Testing under various gas turbine conditions showcased improved thermal power output, achieving over 99% combustion efficiency, significantly higher than conventional systems, and minimal pollutant emissions NOx < 2.5 ppm at design point (Fig. 8(a) and (b)). They also focused on geometric design to reduce combustor surface temperature by introducing cooling airflow that bypasses the micromix flame, entering the outer stabilising vortices. Accelerating airflow around the flame prevents merging of adjacent flames, ensuring low NOx emissions.
Overview of the iterative optimisation process applied to Micromix combustor development. Reproduced with permission [Reference Funke, Beckmann and Abanteriba36].

(a) NOx emissions across varying nozzle diameters (0.30 mm to 0.84 mm) and equivalence ratios. (b) Comparison of numerical and experimental NO/NOx emissions for the 0.84 mm injector test burner under atmospheric testing conditions. Reproduced with permission [Reference Funke, Beckmann and Abanteriba36].

Abdallah et al. [Reference Ben Abdallah, Sethi, Gauthier, Rolt and Abbott22] conducted a comparative study on hydrogen using the micro-diffusion concept, employing both Reynolds-averaged Navier-Stokes (RANS) and large eddy simulation (LES). Explored various models for species transport, turbulence, chemistry and thermochemistry, along with identifying suitable thermal boundary conditions. They implemented the k-ω SST model for all simulations. They found that LES imposing more turbulence to air stream results in breaking the large steady-state flame to multiple much shorter flames with lower peak temperature, which is the result of higher thermal diffusivity. i.e. more cooler regions adjacent to the hot regions. This would yield lower NOx emissions and the Prandtl number has no impact on the simulation results, whereas even slight changes in Schmidt number changes in the flame length and peak temperature.
Furthermore, Giannouloudis et al. [Reference Giannouloudis, Sun, Corsar, Booden, Singh, Abbott, Nalianda and Sethi65] developed a combustion rig specifically tailored for testing hydrogen-fueled micromix burners within aero gas turbines. The rig was designed to accommodate pressures up to 15 bar, inlet air temperatures up to 600 K, and equivalence ratios ranging from lean blow-out to 0.5. This study also explored different manufacturing techniques for injectors, including DMLS (direct metal laser sintering) with alloy 625, BJT (binder jetting technology) with stainless steel 316L and Micro-EDM (micro-electrical discharge machining) with stainless steel 316L. The micromix combustion, which relies on the jet in cross-flow principle, was employed for this study. Both experimental data and numerical simulations were utilised for 32 injectors to investigate NOx emissions and flame behaviour in micromix at elevated pressures. The development of the rig was primarily driven by the need to address the lack of experimental data on NOx emissions and flame behaviour in micromix combustion at higher pressures, particularly for aviation applications. They achieved significant success in achieving ultra-low NOx emissions, which are critical for resembling conditions in turbofan engine operations. The findings from this study could have far-reaching implications for the development of environmentally friendly propulsion systems in aviation, with the potential to reduce emissions and improve overall efficiency.
In another way Folcarelli et al. [Reference Folcarelli, Ferrero, Masseni and Pastrone66] focused on the impact of a converging nozzle positioned between hydrogen injection points and the combustion zone within a micromix combustor. This setup aimed to assess the influence of partial mixing before combustion. Simulations employed the k-ω SST turbulence model and the eddy-dissipation concept. Their findings indicated that altering the angle of the converging nozzle yielded advantages in terms of pollutant formation. Steepening the nozzle angle demonstrated effectiveness in reducing pollutant emissions. Additionally, the results revealed a sensitivity of pollutant formation to variations in inlet temperature and pressure, consistent with existing experimental data. Particularly, the 20° test case exhibited acceptable levels of pollutant formation and appeared less sensitive to inlet condition variations. Notably, the presence of a converging nozzle proved to be an effective measure in preventing flashback occurrences.
In aero gas turbines, Giannouloudis et al. [Reference Giannouloudis, Sun, Corsar, Booden, Singh, Abbott, Nalianda and Sethi65] developed a test rig for hydrogen-fueled micromix burners, achieving ultra-low NOx emissions under high-pressure and high-temperature conditions. Folcarelli et al. [Reference Folcarelli, Ferrero, Masseni and Pastrone66] improved emission control and flame stability by optimising converging nozzle designs. For industrial gas turbines, Lopez-Ruiz et al. [Reference Lopez-Ruiz, Alava and Blanco18] utilised micromix technology to reduce NOx and flashback, optimising burner parameters with CFD. Funke et al. [Reference Funke, Beckmann and Abanteriba36, Reference Kroniger, Horikawa, Funke, Pfaeffle, Kishimoto and Okada45] advanced micromix combustor design, increasing thermal power output and efficiency while optimising injector configurations and cooling methods.
The group of researchers in terms of design and arrangement of nozzle, Abdelhafez et al. [Reference Abdelhafez, Hussain, Nemitallah, Habib and Ali67] examined how the size and spacing of jets in burner affected the performance of flames while burning with combination of oxygen and methane gas. They tested three different designs of the burner head, each with changing jet sizes and spacings. The headend 1 (HE1) features 61 jets (3.175 mm diameter) in a hexagonal matrix with a 5.5 mm uniform spacing. The headend 2 (HE2) has 37 jets (3.970 mm diameter) arranged similarly, and headend 3 (HE3) mirrors HE2 but with a 7.0 mm jet spacing as depicted in Fig. 9. Experiments maintained a fixed flame velocity of 5.2 m/s for consistent cold flow conditions and turbulence intensities. Remarkably, all three designs had comparable limits for when the flames would go out, even though they had different jet sizes and spacings. The best-performing design had smaller jets spaced closer together. Building the jets larger or spacing them farther apart made the flames less stable. The key factor that influenced flame behaviour was the temperature of the burning gas. The concept of multi-point lean-direct-injection is closer to HE1 to HE2 focuses on low NOx emission at high temperature and pressure, because of changing the diameter affect the flame stability as well as it deviates from the lean direct injection concept and also jet spacing in unfavourable for NOx formation.
Three burner headends were exploring top and sectional view of jet spacing effects with respect to diameter for HE1, HE2 and HE3. Reproduced with permission [Reference Abdelhafez, Hussain, Nemitallah, Habib and Ali67].

In another way by arranging the nozzle in different geometrical shape with different air nozzle position and combustion design was followed in paper by Wang et al. [Reference Wang, Chen, Wang and Liu68] studied micromix combustor geometry focusing on air distribution uniformity in transition and premixing regions. The micromix combustor’s numerous nozzles pose challenges for uniform air distribution due to increased flow resistance. It features a transition region influenced by inlet and transition-region relative velocities. In the premixing-channel region, higher channel density reduces pressure loss but adversely affects air distribution. Addressed challenges of using hydrogen-rich fuels in gas turbines, emphasising CO2 emission and NOx reduction, they explored the effects of nozzle arrangement and their typical structure (Fig. 10) on air distribution uniformity such as by varying the front terminal face using a reducer structure and through a diverging structure as shown in Fig. 11(a) and (b), utilising 61 nozzles in various configurations. They emphasised the need for adjusting premixing channel dimensions for stable hydrogen-rich fuel combustion, targeting equivalence ratios of 0.2 to 0.7 and controlling NOx emissions below 15 ppm. Because of the diverging structure in the transition region minimises pressure loss by 3%, maintaining uniform air distribution above 0.9.
Four distinct micromix nozzle configurations. Reproduced with permission [Reference Wang, Chen, Wang and Liu68].

(a) Pressure loss and air distribution uniformity by varying the front terminal face using a reducer structure and (b) through a diverging structure, Reproduced with permission [Reference Wang, Chen, Wang and Liu68].

In addition, Schmidt et al. [Reference Schmidt, Müller, Preuster, Zigan, Wasserscheid and Will69] proposed another way just by inserting the small structure in path of air flow to reduce the NOx emission. They developed a novel hydrogen burner emphasising power control, scalability and low NOx emissions for liquid organic hydrogen carriers (LOHC) release. The single-nozzle design (Fig. 12) minimises flashback-related risks, and numerical optimisation of single nozzle geometry, improved mixture formation via varied cone angle, tube sizes, outlets. Tailored for diverse power needs, it ensures simplicity and cost-effective manufacturing. The strategies included lean operation, humidified air and partial premixing to lower combustion temperature and reduce NOx precursor’s residence time. Experimentally, it showed promise for low NO formation.
Geometric details of the single-nozzle burner (left) and its combustion chamber and essential components (right). Reproduced with permission [Reference Schmidt, Müller, Preuster, Zigan, Wasserscheid and Will69].

The effect of flow body on NOx emissions was discussed by Schimdt et al. [Reference Schmidt, Müller, Preuster, Zigan, Wasserscheid and Will69]. It was evident (refer Fig. 13) that introducing FB typically reduced NOx emissions, however, this was not consistent across all operating conditions. Notably, at ϕ = 0.9, NOx emissions were higher with the FB. This discrepancy arose from the complex interaction between the FB and combustion dynamics, where the FB, intended to lower flame temperature, may have caused localised turbulence under certain conditions, leading to increased NOx formation. This highlights the importance of extensive testing across various operating conditions to fully understand the effects of such modifications. Although the FB generally reduced NOx emissions at lower equivalence ratios, it was less effective or even counterproductive at specific ratios, like ϕ = 0.9, due to its influence on flow dynamics and mixing patterns. Humidification, particularly at near stoichiometric conditions, reduced NOx emissions by 28% for standard and 22% for optimised burner configurations.
Relationship between global NOx concentrations and equivalence ratio (φ) and relative humidity (ϕ) for configurations with and without flow body (FB). Constant thermal load maintained at 0.8 kW. Reproduced with permission [Reference Schmidt, Müller, Preuster, Zigan, Wasserscheid and Will69].

Furthermore, Choi et al. [Reference Choi, Ahn, Kwak, Lee and Yoon39] explored the influence of fuel-induced swirl numbers on both flame structure and NOx emissions. They utilised a tube-type nozzle equipped with four strategically positioned fuel injection holes to induce controlled low swirl effects (Fig. 14). By varying the swirl numbers, they observed different flame patterns and behaviours. Positioning the fuel injection holes away from the nozzle centreline created a low swirl effect. Flame structure exhibited variations depending on the fuel-induced swirl number lower swirl resulted in a centralised flame moving swiftly upward along the axial flow, while increased swirl fragmented the flame into smaller flames that stabilised closer to the wall, away from regions of high flow velocity. These flame configurations were categorised into three types: integrated, lifted quadruple and attached quadruple (Fig. 15). The findings highlighted a significant reduction in NOx emissions attributed to flame separation and structural shifts induced by swirl numbers at varying fuel injection distances and equivalence ratios, demonstrating promising outcomes.
(a) Combustor arrangement. (b) Single-hydrogen setup. (c) Close-up of fuel injection section. (d) Cross-section showing fuel injection types. Reproduced with permission [Reference Choi, Ahn, Kwak, Lee and Yoon39].

OH∗chem images for five cases (1–5) at φ = 0.66 (a–e), and at φ = 0.64, φ = 0.66, and φ = 0.68 for case 4 (f–h). Additionally, a 45° rotated image at γh = 0.60 and φ = 0.62 (i). Reproduced with permission [Reference Choi, Ahn, Kwak, Lee and Yoon39].

In a study for cold flow field, Chen et al. [Reference Chen, Wang, Wang, Wang, Wang and Liu70] found that investigating the mixing behaviour in a flow in the millimetre scale in micromix combustion is difficult and the mixing behaviour affects the combustor performance and hence emissions. They explored numerical simulations to investigate the fuel-air mixing characteristics and flow field of a micromix burner with multiple micromixing tubes. Specifically, LES and RANS equations models are utilised to predict the cold-state behaviour of the micromix combustor. Results reveal that LES provides more accurate predictions compared to RANS for the cold flow field. In the simulations, a tube-type nozzle with multiple micromixing tubes is modelled (Fig. 16). The simulations capture the complex interaction between the fuel and air streams within the micromix combustor, revealing insights into the mixing process. For instance, it is observed that mass diffusion plays a significant role in mixing hydrogen-rich syngas, outweighing the effects of momentum-driven diffusion. Furthermore, the study identifies an optimal range for the fuel-air momentum ratio, which enhances mixing efficiency and uniformity. Additionally, variations in the jet-direction diameter of the micromixing tubes are found to impact the mixing uniformity, with smaller diameters that leading to improved mixing.
Outline structure of single micromix nozzle. Reproduced with permission [Reference Chen, Wang, Wang, Wang, Wang and Liu70].

Additionally, Landry-Blais et al. [Reference Landry-Blais, Sivić and Picard71] conducted experimental research using micromix injection nozzles fabricated through metal three-dimensional (3D) printing processes. The nozzles, made of Inconel 625, featured hundreds of holes as small as 0.25 mm and were designed to operate at inlet temperatures of up to 1,000 K. The study aimed to investigate the impacts of fuel composition and inlet temperature on combustion stability and NOx emissions. Their findings indicated that NOx emissions could be reduced to levels comparable to premixed combustion when the jet Damkohler number remained below a critical value. Achieving this necessitated either smaller holes or higher jet velocities at higher inlet temperatures. The experiments included testing with multiple fuels, including hydrogen, natural gas, propane and Jet A-1, showcasing the multi-fuel capability of micromixing approach. While stable combustion was achieved with hydrogen across a wide range of equivalence ratios and inlet temperatures, hydrocarbon fuels posed challenges due to their lower reactivity. However, stable micromixing combustion was attained at inlet temperatures above 600 K for hydrocarbon fuels. Their experimental results demonstrate the efficacy of micromixing fuel injectors in highly recuperated gas turbines, revealing their potential to achieve low NOx emissions. The results highlight the significance of injector geometry, fuel composition and inlet temperature in influencing combustion stability and NOx levels. Notably, the study achieved considerable success in reducing NOx emissions to levels comparable to premixed combustion at low Damkohler numbers. Moreover, the successful integration of liquid fuels, especially Jet A-1, showcases comparable NOx emissions and combustion stability to gaseous fuels, indicating a promising avenue for mitigating emissions in gas turbine operations.
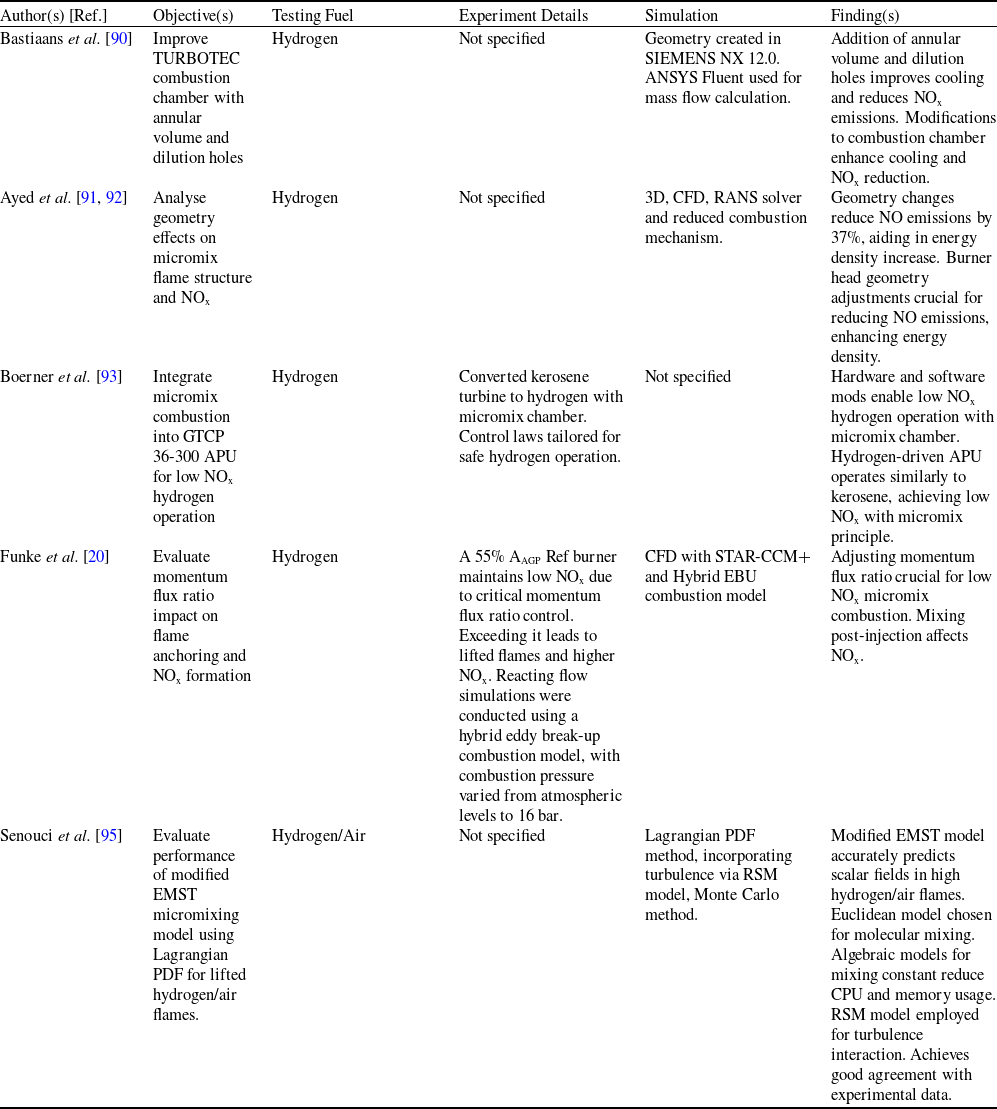
Durocher et al. [Reference Durocher, Fan, Füri, Bourque, Sirois, May, Bergthorson, Yun and Vena72] explored the potential of hydrogen combustion in multi-element combustion systems using premix/micromix injectors. Traditional combustion systems face challenges with hydrogen due to its high reactivity and instability, leading to risks of flashback and hardware failure. The researchers employ a two-staged fuel injection strategy with a cross-shaped array of five injectors to mitigate these risks. By incorporating micromixing, they enhance stability and expand flashback limits compared to fully premixed configurations. Additive manufacturing allows for variations in injector configurations, revealing significant differences in flashback limits among array setups. Thermoacoustic behaviour is improved with micromixing, reducing pressure fluctuations in the combustor. Laser diagnostics provide insights into flame dynamics but encounter difficulties due to the flames three-dimensional, non-axisymmetric nature. This study emphasises the importance of better understanding these complex systems to mitigate risks and streamline design processes for gas turbine manufacturers and also micromix injectors show promise for hydrogen combustion, addressing challenges like flashback, emissions and thermoacoustic, enhancing stability and fuel flexibility. The concept of micromix in the engine injector was also discussed by Babayev et al. [Reference Babayev, Im, Andersson and Johansson14] in their study of a high-pressure direct injection (HPDI) natural gas injector geometry with seven circular 1 mm diameter nozzle orifices. A 2 mm channel length and a removable surface (striped disk) separating injector and cylinder regions were utilised for injection control. The quasi-square injection rate profile considered is found in varying in-cylinder pressure effects, which is validated through a constant-volume chamber with a GDI H2 injector, aiming at NOx reduction in direct injection compression ignition (DICI) H2 engines. They adopted CI non-premixed H2 combustion engine methodology, revealing NOx reduction compared to premixed combustion (diesel engine). Advantages of their study include eliminated knock risk, higher thermal efficiency, increased power density, no backfiring risk, potentially lower cycle-to-cycle variability, absence of combustible gases in the crankcase, net molar expansion and reduced work input during compression stroke. Furthermore, Araoye et al. [Reference Araoye, Abdelhafez, Ben-Mansour, Nemitallah and Habib73] explored the effects of various geometric parameters (Fig. 17) on mixing quality within a micromixer burner designed for oxy-fuel combustion. Their study focused on CH4, O2 and CO2 mixtures with the goal of reducing NOx emissions, particularly for applications like industrial gas turbines. They examined the effects of altering parameters including fuel inlet diameter (ranging from 0.2 to 1.0 mm), hole quantity (4 and 6) and tube length (ranging from 5D to 15D). The findings revealed that increasing tube length notably enhanced mixing quality. However, maintaining a constant total fuel mass flow rate showed that increasing the number of fuel holes from four to six generally led to decreased mixing quality, except for the smallest hole diameter of 0.2 mm. The most optimal mixing quality was observed with fuel hole diameters of 0.25 mm and 0.2 mm for micromixer tubes with four and six inlet holes, respectively. These findings underscore the potential of micromixers to achieve high mixing quality at reasonable burner heights in oxy-fuel combustion applications. Thus, careful consideration of geometric parameters is crucial for optimising performance and minimising emissions.
The diagrammatic flow domain. Reproduced with permission [Reference Araoye, Abdelhafez, Ben-Mansour, Nemitallah and Habib73].

Schmidt et al. [Reference Schmidt, Müller, Preuster, Zigan, Wasserscheid and Will69] developed a single-nozzle hydrogen burner, achieving a 28% reduction in NOx emissions through advanced flow management and partial premixing. Durocher et al. [Reference Durocher, Fan, Füri, Bourque, Sirois, May, Bergthorson, Yun and Vena72] utilised a two-stage injection strategy with micromix injectors to enhance stability and address flashback issues, improving emission control and combustion performance. Both studies highlight the effectiveness of innovative burner designs and injection techniques in enhancing performance and controlling emissions in aero gas turbines. In industrial gas turbines, Wang et al. [Reference Wang, Chen, Wang and Liu68] optimised micromix combustor geometry for improved air distribution and reduced NOx emissions, particularly with hydrogen-rich fuels. Landry-Blais et al. [Reference Landry-Blais, Sivić and Picard71] demonstrated the multi-fuel capability of micromix nozzles, achieving stable combustion and low NOx emissions across various fuels. Babayev et al. [Reference Babayev, Im, Andersson and Johansson14] focused on high-pressure direct injection with natural gas, showing reduced NOx emissions and enhanced efficiency in industrial turbines compared to traditional methods.
Micromix combustion technology demonstrates significant potential for achieving low NOx emissions and high efficiency in hydrogen-fueled systems, driven by optimised design parameters and flame dynamics. Key factors include nozzle geometry, air gate configuration and blockage ratio, which directly influence mixing efficiency, flame stability and emission characteristics. Smaller nozzle diameters and closer spacing enhance fuel-air mixing, thereby reducing flame residence time and peak temperatures, which in turn lowers NOx formation. Premixed flames, while efficient, face flashback risks, whereas diffusion flames offer stability but require precise mixing control. Computational tools like LES and RANS models aid in understanding turbulence-chemistry interactions, with LES providing superior accuracy for complex flow dynamics. Innovations in manufacturing, such as 3D printing, enable intricate injector designs that balance thermal power output, combustion efficiency, and scalability. Additionally, strategies like cooling airflow integration and equivalence ratio optimisation further mitigate emissions and enhance stability, underscoring the importance of harmonising geometric and operational parameters for robust combustion performance.
Effect of injector design on the emissions and combustion characteristics

Practical applications in aero and industrial gas turbines highlight the versatility of micromix technology. In aviation, converging nozzles and high-pressure rigs achieve ultra-low NOx emissions (< 2.5 ppm), critical for compliance with environmental regulations. Industrial systems influence multi-nozzle arrays and hydrogen-rich fuels to improve thermal power and air distribution uniformity, reducing injector counts while maintaining efficiency. Multi-fuel compatibility extends applicability but necessitates addressing challenges like flame stability for hydrocarbons at lower temperatures.
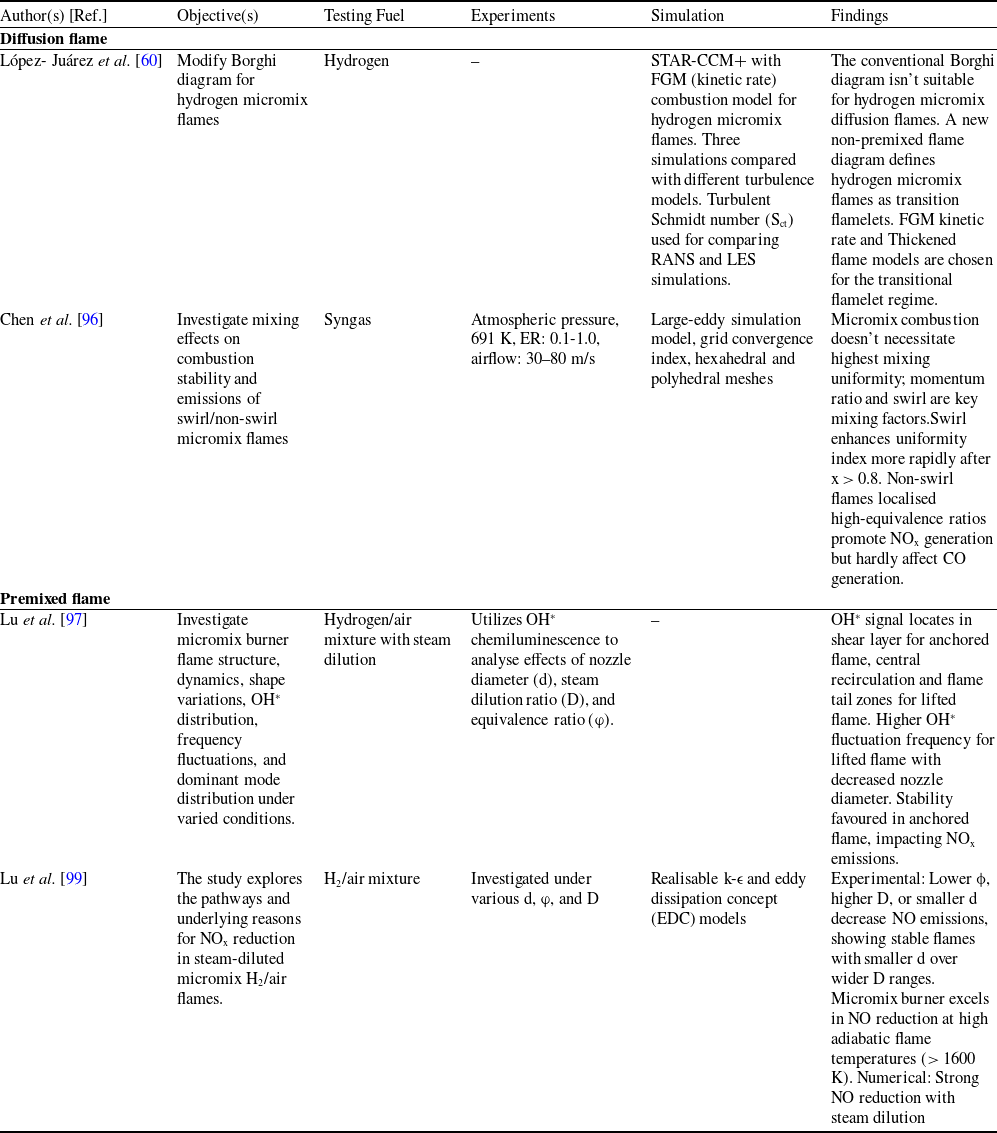
Table 1 presents research on injector designs impact on combustion efficiency and emissions across various fuels and applications, including micromix combustion for low NOx burners and oxy-methane micromixer-like burners for zero-emission turbines. Studies utilise experimental setups, simulations, and numerical analyses to optimise combustion efficiency, reduce emissions, and enhance fuel flexibility, particularly with hydrogen-rich fuels, contributing to advancements in clean energy technologies.
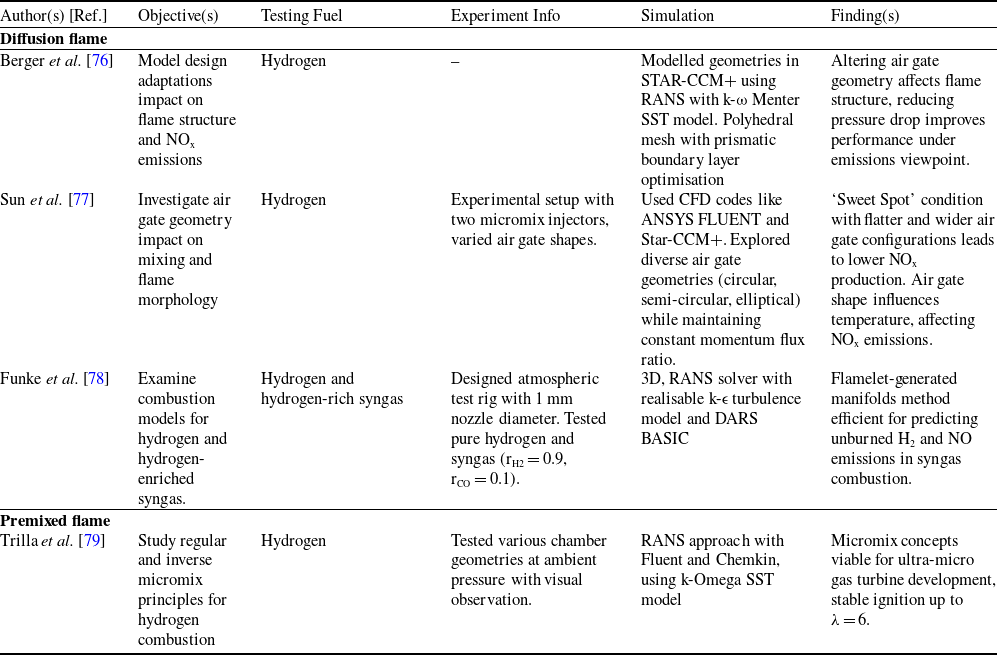
The design of air gates holds significant importance in combustion systems where precise control of airflow is essential for optimal performance. Air gates serve as key components for regulating the intake of air into combustion chambers, influencing combustion efficiency, pollutant emissions and overall system operation. Despite their critical role, there remains a need for comprehensive studies to elucidate the specific effects of air gate design on combustion processes in micromix combustion technology. This section aims to address this gap by investigating the impact of air gate design parameters such as geometry, size, shape and positioning towards the diffusion and premixed flame on combustion performance in micromix combustion technology with hydrogen as a fuel. In this regard, Berger et al. [Reference Berger76] analysed the impact of increasing fuel orifice diameter from 0.3 mm to 1.0 mm in the micromix combustion principle used by the ENABLEH2 project to reduce design complexity and cost. Rounded air gates (Fig. 18) effectively decreased boundary layers, reducing air pressure. Utilising RANS CFD simulations, increased air gate velocity resulted in higher pressure drop, enhancing mixing and potentially reducing emissions without pressure loss. Limited recirculation prevented hot gas upstream suction at the trailing edge, minimising NOx formation. However, challenges in NOx control arose with increased fuel orifice size, and replicating smaller micromix burner flame structure yielded unsatisfactory results are illustrated in Fig. 19.
Similarly, Sun et al. [Reference Sun, Agarwal, Carbonara, Abbott, Gauthier and Sethi77] studied the design space of a hydrogen micromix injection system via numerical simulation, focusing on air gate and hydrogen injector sizing, as well as injector spacing and offset distances. Analysis of NOx production per unit of fuel relative to design at equivalence ratio of 0.4 highlights the influence of equivalence ratio variations on emission levels. Notably, higher global equivalence ratios with constant hydrogen jet diameter result in lower NOx emissions.
In addition, Funke et al. [Reference Funke, Beckmann, Keinz and Abanteriba78] investigated the DLN micromix combustion principle to achieve low-emission combustion in industrial gas turbines powered by hydrogen or syngas. This method utilises jet-in-crossflow mixing, where fuel injection perpendicular to the air-crossflow creates numerous small diffusion-like flames. These miniaturised flames reduce NOx emissions significantly due to shorter reactant residence times. To optimise DLN micromix combustors for combustion stability and low NOx emissions, the study integrates CFD analyses with experimental validation. This section offers a comparative analysis of different numerical combustion models for hydrogen and hydrogen-rich syngas, ranging from simplified to detailed reaction mechanisms. Evaluation based on exhaust gas compositions confirms the accuracy of detailed combustion mechanisms in predicting DLN-micromix combustion physics. Challenges remain in predicting unburned H2 and NOx emissions accurately, particularly for high equivalence ratios in syngas combustion. However, the flamelet generated manifolds (FGM) model shows promise in reducing computational complexity while maintaining accuracy, especially for reaction mechanisms with numerous species.
Micromix combustor: baseline (left) and 1.0 mm fuel orifice scaled version (right). Crosswise section through air gates scaled to 2:1. Reproduced with permission [Reference Berger76].

NOx emission trends relative to selected parameters. Reproduced with permission [Reference Berger76].

Trilla et al. [Reference Trilla, Grossen, Robinson, Funke, Bosschaerts and Hendrick79] investigated regular micromix (hydrogen injected into an airstream) and inverse micromix (air injected into a hydrogen atmosphere) through numerical and experimental methods, with a focus on stable combustion in small volumes, essentially for micro gas turbine applications. In the inverse micromix approach, low-speed axial hydrogen injection and radial air injection, coupled with hydrogen passing through a porous block, enhanced mixing, leading to combustion chamber temperatures up to 2300 K. An axial air bypass method was employed to address temperature rise, with optimisation involving deviation plates and injector distance. The study aimed to achieve stable combustion while controlling NOx emissions. Sustainable combustion was attained with an airflow rate ranging between 6 and 7 grams per second, with a notable stability observed at approximately 6 grams per second.
Trilla et al. [Reference Trilla, Grossen, Robinson, Funke, Bosschaerts and Hendrick79] investigated stable combustion in industrial gas turbines using premixed flames, exploring regular and inverse micromix methods for effective NOx control. In aero gas turbines, Berger et al. [Reference Berger76] and Funke et al. [Reference Funke, Beckmann, Keinz and Abanteriba78] focused on diffusion flames, optimising fuel orifice designs and DLN micromix combustors for low emissions. Sun et al. [Reference Sun, Agarwal, Carbonara, Abbott, Gauthier and Sethi77] examined hydrogen micromix systems for both aero and gas turbine applications, emphasising injector design to manage NOx emissions effectively.
Air gate design significantly influences combustion performance in hydrogen-fueled micromix systems, with geometry, fuel orifice size, and flow configuration critically impacting mixing efficiency, flame stability, and NOx emissions. Scaling fuel orifice diameters (e.g., 0.3 mm to 1.0 mm) reduces design complexity but introduces challenges in flame structure replication and NOx control, highlighting a trade-off between scalability and emission management. Rounded air gate geometries enhance mixing by minimising boundary layers and pressure losses, while injector spacing and equivalence ratio adjustments (e.g., lower ratios reducing NOx) further optimise emission outcomes. Inverse micromix configurations, where air is injected into hydrogen streams, improve mixing and achieve stable combustion at high temperatures (up to 2300 K) but necessitate advanced cooling strategies like axial air bypass. Computational models, such as FGM, balance accuracy and efficiency in predicting emissions, although challenges persist in modeling unburned hydrogen and NOx at high equivalence ratios, particularly for syngas blends.
Optimised air gate designs and inverse micromix methods demonstrate potential for industrial and aero gas turbines, enabling stable combustion with ultra-low NOx emissions (< 2.5 ppm) under controlled airflow rates (6–7 g/s). However, scalability of injector geometries and cooling strategies for high-temperature operation remain critical hurdles. While detailed combustion models improve predictive accuracy, their computational cost limits real-world applicability, underscoring the need for simplified yet reliable frameworks.
Table 2 explore the effect of air gate design on flame structure, mixing and NOx emissions during hydrogen combustion. Studies reveal that optimising air gate geometry reduces pressure drop and improves emissions performance, emphasising the importance of achieving a ‘Sweet Spot’ condition for lower NOx production. Additionally, research highlights the viability of micromix principles for gas turbine development and efficient combustion modelling methods for hydrogen and hydrogen-rich syngas.
Effect of air gate design

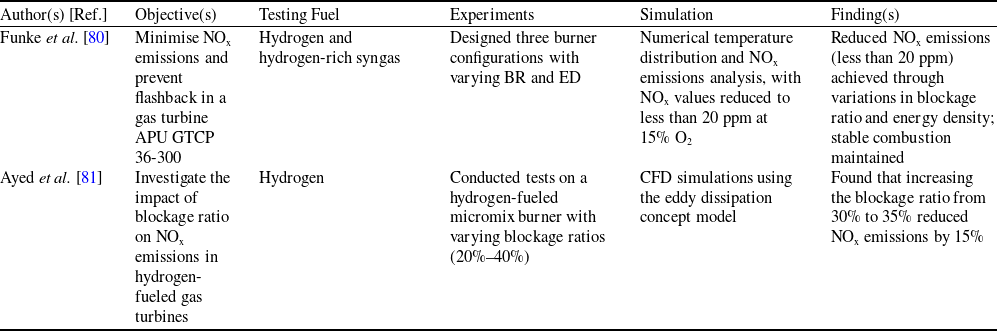
Blockage ratio refers to the proportion of the combustion chamber’s cross-sectional area occupied by fuel compared to the total area. A lower blockage ratio promotes better airflow and mixing, improving combustion uniformity and potentially reducing emissions. In contrast, a higher blockage ratio can restrict airflow, leading to incomplete combustion and higher emissions due to poor air-fuel mixing. This section discusses the role of blockage ratio in optimising airflow and combustion uniformity within micromix systems, crucial for enhancing performance and reducing emissions. Funke et al. [Reference Funke, Dickhoff, Keinz, Ayed, Parente and Hendrick80] studied hydrogen and hydrogen-rich syngas as fuel in an industrial gas turbine APU GTCP 36-300 to minimise NOx emissions and prevent flashback in the combustion chamber. Three burner configurations were designed, varying blockage ratio (BR) and energy density (ED). Burner 1 had BR1, ED1; Burner 2 served as a link between hydrogen and syngas with BR2, ED2 (Fig. 20); Burner 3 utilised a 90/10 syngas mixture with BR3, ED3. Figure 21 (a) and (b) displays syngas flames and temperature distribution for the three burners. Results showed reduced NOx emissions due to variations in blockage ratio and energy density.
Investigation flow chart for blockage ratio and energy density variation. Reproduced with permission [Reference Funke, Dickhoff, Keinz, Ayed, Parente and Hendrick80].

(a) Comparison of NOx emissions at 15% O2 across equivalence ratio φ in experimental and numerical investigations, including optical flame appearance of 90/10 SG; (b) numerical temperature distribution on a cross-section for φ = 0.4 for all three configurations. Reproduced with permission [Reference Funke, Dickhoff, Keinz, Ayed, Parente and Hendrick80].

Similarly, Ayed et al. [Reference Ayed, Kusterer, Funke, Keinz, Striegan and Bohn81] conducted studies that revealed the significant impact of adjusting the blockage ratio, typically within the range of 20% to 40%, on NOx formation. It was observed that a higher blockage ratio enhances flame stability by improving the mixing of fuel and air, leading to more efficient combustion and reduced NOx emissions. For example, one study noted that when the blockage ratio increased from 30% to 35%, there was a 15% reduction in NOx emissions, underscoring the importance of balancing low emissions with combustion efficiency. Numerical simulations using the eddy dissipation concept model showed that optimising the blockage ratio could minimise NOx emissions to as low as 5 ppm, especially under lean combustion conditions. This careful adjustment of the blockage ratio is crucial for achieving both high efficiency and low emissions in hydrogen-fueled gas turbines, making it a vital factor in designing low-NOx combustion systems.
Funke et al. [Reference Funke, Dickhoff, Keinz, Ayed, Parente and Hendrick80] and Ayed et al. [Reference Ayed, Kusterer, Funke, Keinz, Striegan and Bohn81] showed that optimising BR and ED in industrial gas turbines using hydrogen-rich syngas can significantly reduce NOx emissions, with a 15% reduction observed by increasing BR from 30% to 35%, balancing low emissions with combustion efficiency.
Blockage ratio critically influences airflow distribution and combustion efficiency in hydrogen-fueled micromix systems, with lower BR values enhancing air-fuel mixing and reducing NOx emissions through uniform combustion. However, higher BR (20–40%) improves flame stability by intensifying turbulence and mixing, as demonstrated by a 15% NOx reduction when increasing BR from 30% to 35%. ED adjustments further optimise this balance, enabling emissions as low as 5 ppm under lean conditions. Numerical simulations revealed that BR-ED interplay govern temperature distribution and flame structure, with lower BR configurations favouring airflow uniformity but risking incomplete combustion, while higher BR designs stabilise flames but require precise control to avoid excessive emissions. Industrial gas turbine applications highlight the necessity of optimising BR to specific fuel blends (e.g., hydrogen-rich syngas) for better performance. Optimising BR and ED offers a viable pathway for industrial systems to achieve ultra-low NOx emissions without compromising combustion stability. However, scalability challenges persist, particularly in adapting designs to varying operational loads and fuel compositions.
Table 3 examines the impact of blockage ratio on micromix combustion, with a focus on hydrogen. Findings reveal that optimised configurations lead to reduced NOx emissions and manufacturing costs, highlighting the importance of fuel properties and design scalability for efficient combustion.
Effect of blockage ratio for diffusion flame

Flame stabilisation in micromix combustion is crucial for ensuring stable operation and minimising emissions, particularly in hydrogen-fueled gas turbines. It is highly sensitive to air gate design and blockage ratio, as these factors directly influence airflow distribution, fuel mixing and reaction zone formation. Optimised air gate geometry enhances mixing, reducing local flame extinction, while an appropriate blockage ratio balances airflow and flame anchoring for efficient combustion. This section explores flame stability within micromix technology, highlighting their impact on combustion stability and emission control. Treleaven et al. [Reference Treleaven, Puggelli, Mercier, Leparoux, Sun and Sethi82] explored the high-altitude relight performance of hydrogen-air micromix combustion systems, driven by hydrogen’s potential as a greener fuel for commercial aviation. Micromix injection, featuring numerous small-scale jet injectors, replaced conventional single air and fuel injectors, generating rich partially premixed flamelets within a lean combustor. This innovative design aimed to enhance flame stability and reduce nitrous oxide emissions. However, its effectiveness under various engine conditions, including high-altitude relight scenarios, remained untested. Utilising high-fidelity LES, the research contrasted two methodologies for chemistry description: tabulated chemistry relying on premixed flamelets and transported chemistry. Tabulated chemistry is a technique that considers chemical effects in gaseous combustion systems while keeping computational costs low. Results indicated ignition proximity to injector faces due to small recirculation zones downstream, with tabulated chemistry methods failing to accurately predict ignition. A simplified model linking ignition probability with flame speed and kernel size was proposed; offering insights into ignition mechanisms and aiding future design optimisation for high-altitude relight scenarios. Tabulated chemistry, a crucial technology in simulations of large-scale turbulent fire and combustion, played a pivotal role in understanding the combustion dynamics within the micromix combustion system.
Similarly, Kroniger et al. [Reference Kroniger, Kamiya and Horikawa83] investigated combustion instabilities of micromix flames in a dry low NOx combustion scheme designed for high hydrogen fuels in gas turbines. Through experimental setups and analyses, including phase-averaged OH chemiluminescence imaging and acoustic mode assessment, the research explored rotational and vertical thermoacoustic oscillation modes within a can-type combustor foundational cylindrical chamber featuring separate fuel injectors, igniters, liners and casings. Results, aided by LESs, successfully replicated a low-frequency longitudinal mode under moderate overload conditions, identifying thermoacoustic instabilities within the flame zone via mean Rayleigh index and pressure distribution. Additionally, a vertical high-frequency oscillation mode was observed at high overload, where flames from opposing injection directions interacted, leading to distortions. Notably, phase-averaged imaging revealed the oscillation cycle frequency reduced compared to measured dynamic pressure frequency.
Moreover, Tekin et al. [Reference Tekin, Ashikaga, Horikawa and Funke74] studied hydrogen fuel applications for engines and gas turbines, focusing on reducing NOx emissions and flashback issues associated with conventional energy sources. They utilised a diffusion flame combustor modified for hydrogen combustion with three fuel modes: natural gas only, blend gas with varying hydrogen content and hydrogen-only. They also implemented micromix combustion principles with 1600 miniaturised flames using 0.3 mm fuel injectors. Results indicated lower NOx values for the outer hydrogen ring, especially at whole load range, with NOx levels consistently below 20 ppm. Liu et al. [Reference Liu, Xiong, Zhang, Ren, Liu and Lu75] conducted experimental investigation on methane-fueled gas turbines, focusing on a microscale multi-nozzle array combustor. Utilised flameless combustion principles for flame stabilisation, employing high nozzle outlet velocities (Fig. 22) to induce flue gas recirculation and self-ignition. They varied the number and arrangement of nozzles, as well as nozzle velocities, to mitigate flashback risks and achieved low NOx emissions (< 20 ppm @ 15% O2) and minimal CO emissions (< 30 ppm @ 15% O2), as depicted in Fig. 23. The findings illustrated the effectiveness of multi-nozzle array combustion across different fuel types, highlighting its ability to reduce NOx emissions through the flame stabilisation mechanism that impacts both inner and outer recirculation zones.
Nozzle outlet velocity and flue gas recirculation ratio trends. Reproduced with permission [Reference Liu, Xiong, Zhang, Ren, Liu and Lu75].

NOx and CO emissions correlation with varying nozzle outlet velocity. Reproduced with permission [Reference Liu, Xiong, Zhang, Ren, Liu and Lu75].

Xuechao et al. [Reference Xuechao, Xiaotian, Ce and Weiwei84] investigated the combustion characteristics and flame stabilisation mechanisms of micromix jet flames containing hydrogen, focusing on emission performance and oscillation characteristics across varying hydrogen enrichments. Experimental studies were conducted using a novel micromix burner under atmospheric pressure and preheated air conditions, employing methods such as spectral analysis, phase-space reconstruction, and proper orthogonal decomposition. Results indicated low-emission performance for pure hydrogen and stable combustion over a wide range of hydrogen contents, suggesting potential applicability in hydrogen turbine combustion chambers. Oscillatory combustion phenomena were observed between 10% and 20% hydrogen content, characterised by limit cycle oscillations and strong correlation structures in pressure fluctuations. Flame dynamics revealed periodic formation and axial propagation of vortices, with higher hydrogen content flames oscillating at frequencies exceeding 900 Hz but with low amplitudes. Analysis of flame structure highlighted the impact of hydrogen content on heat release concentration position and coupling with pressure fluctuations, while modal analysis revealed a transition from axial modes to flame interaction with increasing hydrogen content. In industrial gas turbines, Liu et al. [Reference Liu, Xiong, Zhang, Ren, Liu and Lu75] utilised a microscale multi-nozzle array combustor for premixed flames, achieving low NOx and minimal CO emissions. Xuechao et al. [Reference Xuechao, Xiaotian, Ce and Weiwei84] confirmed stable, low-emission hydrogen-fueled micromix combustion. For aero gas turbines, Treleaven et al. [Reference Treleaven, Puggelli, Mercier, Leparoux, Sun and Sethi82], Kroniger et al. [Reference Kroniger, Kamiya and Horikawa83], and Tekin et al. [Reference Tekin, Ashikaga, Horikawa and Funke74] focused on diffusion flame approaches, addressing high-altitude relight, managing combustion instabilities and reducing NOx and flashback in hydrogen-fueled turbines.
Flame stabilisation in micromix combustion hinges on optimised nozzle design, hydrogen content and airflow dynamics, with diffusion and premixed flames exhibiting distinct behaviours. For premixed flames in industrial turbines, multi-nozzle arrays enhance flame anchoring via flue gas recirculation, achieving ultra-low NOx (< 20 ppm) and CO emissions (< 30 ppm) through uniform heat distribution and reduced peak temperatures. Diffusion flames in aero applications, such as hydrogen-fueled systems, prioritise high-altitude relight capability and flashback mitigation, leveraging miniaturised injectors (e.g., 0.3 mm) to generate distributed flamelets. However, challenges persist in modeling ignition dynamics, as tabulated chemistry methods often fail to predict flame kernel formation accurately. Hydrogen enrichment amplifies flame stability but introduces oscillatory combustion (e.g., 900 Hz frequencies) at intermediate concentrations (10–20%), necessitating advanced control of thermoacoustic instabilities. Key factors include nozzle velocity, recirculation zones and hydrogen-air mixing uniformity, with higher velocities suppressing flashback but requiring precise alignment with fuel reactivity.
Industrial systems benefit from scalable multi-nozzle designs that balance airflow distribution and flame anchoring, while aero turbines require adaptive injector geometries to manage high-altitude relight and combustion oscillations. Computational models like LES improve instability prediction but lack accuracy in capturing ignition dynamics under extreme conditions. Research gaps include understanding vortex-flame interactions in oscillatory regimes, optimising nozzle arrays for variable hydrogen blends, and validating flame stabilisation strategies under transient loads. Bridging experimental insights with advanced simulations will enable robust, low-emission micromix systems, advancing hydrogen’s role in sustainable aviation and power generation.
2.2 Influence of fuel energy density and hydrogen blends on micromix combustion characteristics
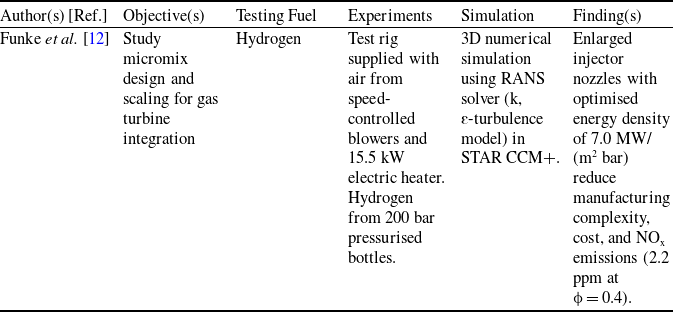
Fuel energy density is a pivotal factor in micromix combustion, directly influencing combustion efficiency and emissions. Higher energy density fuels, such as hydrogen, enhance thermal performance but require precise mixing to mitigate NOx emissions, while lower densities risk incomplete combustion if airflow and fuel distribution are suboptimal. Fuel energy density describes the concentration of energy within a given volume or mass of fuel. Higher fuel energy density enhances combustion performance but may lead to increased emissions if not adequately mixed. Conversely, lower energy density fuels may lead to incomplete combustion and higher emissions due to the limited energy available for the combustion process. This section discusses how fuel energy density impacts micromix technology, particularly with hydrogen fuel, influencing combustion efficiency and emissions control. Funke et al. [Reference Funke, Keinz, Kusterer, Ayed, Kazari, Kitajima, Horikawa and Okada12] delved into micromix design and scaling across different energy density fuels, particularly focusing on their integration into gas turbines. They investigated micromix design and scaling techniques across a range of energy densities, highlighting successful adaptations for various nozzle sizes and thermal power outputs. Through both experimental and numerical analyses, stable micromix flamelets were observed under atmospheric conditions, with consistently low NOx emissions even at elevated pressures up to 16 bar. A conceptual 3D integration study proposed feasible integration setups for industrial gas turbines, laying the groundwork for future exploration into full-scale prototype combustors and low-pressure testing trials. Funke et al. [Reference Funke, Keinz, Kusterer, Ayed, Kazari, Kitajima, Horikawa and Okada12] applied micromix combustion in industrial gas turbines, achieving stable, low-NOx emissions across varying energy densities and pressures, setting the stage for future prototypes.
Studies demonstrate that optimised nozzle scaling and combustor geometry enable stable flamelets across varying energy densities, maintaining ultra-low NOx emissions (< 20 ppm) even at elevated pressures (up to 16 bar). Effective micromix designs balance energy density with mixing dynamics, leveraging smaller nozzles and tailored thermal power outputs to ensure uniform fuel-air distribution. Comparatively, hydrogen’s high reactivity demands rigorous control of ignition and flame anchoring, whereas lower-density fuels necessitate enhanced mixing strategies to avoid emission trade-offs.
Table 4 examines the impact of fuel energy density on micromix combustion, with a focus on hydrogen. Findings reveal that optimised configurations lead to reduced NOx emissions and manufacturing costs, highlighting the importance of fuel properties and design scalability for efficient combustion.
Effect of fuel energy density for diffusion flame

In micromix technology, the impact of fuel blends on combustion processes is crucial. Fuel composition variations can influence combustion efficiency and emissions performance within micromix combustion chambers. Optimising fuel blends involves considering factors like reactivity and mixing behaviour, essential for designing efficient and low-emission micromix systems. This section reviews studies on the impact of various hydrogen-based fuel blends on combustion characteristics and their relevance for industrial applications.
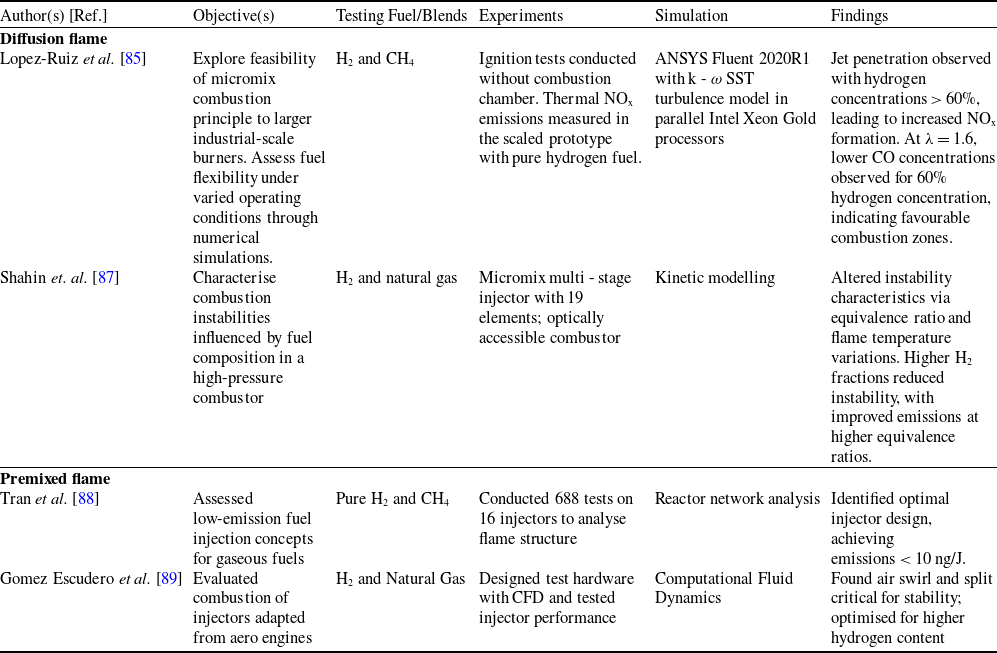
Lopez-Ruiz et al. [Reference Lopez-Ruiz, Alava and Blanco85, Reference Funke, Beckmann and Abanteriba86] examined the viability of employing H2 - CH4 fuel blends in micromix burners. They employed computer simulations and experimental (Fig. 24) tests in a small burner to analyse flow, temperature and emissions. They achieved low NOx emissions below 10 ppm but observed higher CO emissions, especially with specific fuel blends and mixture levels. Authors found micromix burners less flexible in large industrial settings and highlighted the importance of jet penetration for reducing CO emissions (Fig. 25).
Experimental setup layout with main components depicted in (a) real view and (b) schematic view. Reproduced with permission [Reference Lopez-Ruiz, Alava and Blanco85].

CFD results for NOx formation rates. Reproduced with permission [Reference Lopez-Ruiz, Alava and Blanco85].

Similarly, Shahin et al. [Reference Shahin, Gejji, Hodge, McLean, Lucht and Slabaugh87] investigated the impact of natural gas addition on combustion instabilities in a high-pressure combustor using a micromix multi-stage injector. Varying equivalence ratio and flame temperature altered instability characteristics, with hydrogen fraction inversely affecting instability amplitude. Kinetic modelling showed reduced reaction timescale and instability amplitude with increased hydrogen concentration. OH* chemiluminescence imaging identified primary excitation of the 2L mode at ∼1100 Hz, with instability dampening attributed to decreased length of a positively correlated region with higher equivalence ratio and hydrogen addition.
Tran et al. [Reference Tran, Gomez Escudero and McDonell88] investigated the feasibility of applying low-emission liquid fuel injection concepts to gaseous mixtures, with a focus on developing an injector with specific geometric characteristics to minimise emissions. Tests were carried out on specialised hardware designed for combustion trials involving pure hydrogen and blends of hydrogen with methane. The lean direct injection concepts utilised were adapted from aeroengine injectors for application in a ground-based engine. A comprehensive statistical test plan analysed various parameters, including injector flow distribution, air and fuel swirling, pressure drop, preheating temperature, fuel composition and adiabatic flame temperature, to assess their impact on flame structure and emissions performance. With 16 injectors examined across 688 test points, emissions data were reported based on mass, and interpretation was aided by chemical reactor network analysis. Captured images were scrutinised to study flame structure characteristics. A predictive emissions model identified the optimal injector configuration, featuring the highest air distribution and swirl angle, for both methane and hydrogen gas blends, resulting in emissions levels below 10 ng/J. In addition, Gomez Escudero et al. [Reference Gomez Escudero, Tran, Overbaugh, McDonell, Williams, Buelow, Ryon and DeBeni89] studied fuel injectors, adapted from aero engine concepts for lean direct injection, underwent evaluation for combustion performance with hydrogen and hydrogen/natural gas blends. Utilising CFD, test hardware was designed to match flows of an industrial engine. Statistical testing revealed air split and swirl’s significant influence on stability, with lower air swirl configurations displaying enhanced stability. Reduced air pressure drops and higher preheat temperatures extended stability range and allowed greater hydrogen content. Atmospheric combustion tests on the mid-point injector established a baseline for future studies. This thorough examination provides crucial insights for optimising injector designs to meet emissions and performance criteria.
Lopez-Ruiz et al. [Reference Lopez-Ruiz, Alava and Blanco85, Reference Funke, Beckmann and Abanteriba86] explored micromix flames in small burners for industrial applications, achieving low NOx but with higher CO emissions. Shahin et al. [Reference Shahin, Gejji, Hodge, McLean, Lucht and Slabaugh87] focused on diffusion flames in high-pressure combustors, examining stability with hydrogen and natural gas blends. The study by Tran et al. [Reference Tran, Gomez Escudero and McDonell88] and Gomez Escudero et al. [Reference Gomez Escudero, Tran, Overbaugh, McDonell, Williams, Buelow, Ryon and DeBeni89] focused on premixed flames for hydrogen and hydrogen/methane blends in industrial gas turbines. The research used adapted aeroengine injectors to achieve low emissions and improved stability.
Fuel blend composition significantly impacts micromix combustion performance, with hydrogen-methane mixtures demonstrating a trade-off between NOx reduction and elevated CO emissions. Hydrogen-rich blends enhance flame stability and suppress thermoacoustic instabilities due to faster kinetics and shorter reaction timescales, while methane addition introduces challenges in maintaining mixing uniformity and emission control. Optimised injector designs, adapted from aeroengine concepts, enable ultra-low emissions (< 10 ppm NOx) for hydrogen and blended fuels by improving air-fuel distribution and swirl dynamics. However, CO emissions remain problematic in lean-burn conditions, particularly with methane blends. Comparatively, diffusion flames in industrial settings prioritise scalable mixing, while premixed systems in adapted injectors achieve emissions below 10 ng/J through statistical optimisation of flow parameters.
Table 5 assesses the feasibility of scaling micromix combustion to larger industrial burners, highlighting insights into fuel flexibility, operating conditions and NOx formation, with hydrogen and its blends.
Findings from the micromix combustion with different fuel blends

The configuration of the combustion chamber geometry plays a pivotal role in determining the efficiency and environmental impact of combustion processes. As micromix combustion technology continues to evolve, understanding the intricate interplay between chamber geometry and performance becomes increasingly crucial in terms of present research. Addressing this gap, this section aims to delve into the relationship between combustion chamber geometry and combustion performance, shedding light on how variations in chamber design influence combustion processes. Through systematic experimentation and analysis, this section covers the valuable insights into optimising combustion chamber geometry for enhanced efficiency, reduced emissions and improved sustainability in various combustion applications.
Bastiaans et al. [Reference Bastiaans and Devriese90] modified a TURBOTEC combustion chamber by incorporating an annular volume and dilution holes, transitioning from a swirler combustion principle to micromix combustion with 66 flames. They divided inlet air into two phases; one for combustor air tubes and another for dilution exhaust gases. The annulus surrounds the liner, allowing airflow for cooling, and dilution holes connect the annular volume to the liner’s inside. Secondary phase airflow serves multiple purposes, including cooling the liner, enabling richer fuel-air combustion, diluting exhaust gases for reduced NOx, and homogenising temperature upstream of the turbine. Smaller dilution holes lead to decreased NOx formation due to a leaner fuel-air ratio, resulting in lower flame temperature and reduced thermal NOx production. Overall, modifications with a 20 mm diameter annular volume and dilution holes offer improved cooling, reduced NOx emissions, and enhanced combustion control.
In addition, Ayed et al. [Reference Ayed, Kusterer, Funke and Keinz91, Reference Ayed, Kusterer, Funke, Keinz and Bohn92] examined the effect of how variations in geometry parameters (Fig. 26) impact flame structure and NOx emissions. The main aim is to understand how burner design affects micromix combustion and optimize it for increased energy density and eventual use in real gas turbines. The findings reveal significant optimization potential for dry low NOx characteristics and offer insights into how geometry modifications influence flame structure (Fig. 27) and NOx emissions. This research paves the way for enhancing the energy density of micromix burners and their integration into industrial gas turbines. The micromix test burner, with a 1 mm injector, performed well under atmospheric conditions, but its high energy density caused increased NOx emissions due to thicker and longer flames. They modified burner head geometry can yield a 37% reduction in NO emissions, presenting an opportunity for enhanced energy density while sustaining low NOx levels. Particularly beneficial for designing gas turbine combustors at elevated pressures.
Changing the height of the AGP (air guiding panel) by adjusting the parameter k. Reproduced with permission [Reference Ayed, Kusterer, Funke, Keinz and Bohn92].

Calculated temperature (bottom) and NO mass fraction (top) distributions for the burner variation K4 (x = 4 mm, Δk = 4 mm). Reproduced with permission [Reference Ayed, Kusterer, Funke, Keinz and Bohn92].

Moreover, Boerner et al. [Reference Boerner, Funke, Hendrick, Recker and Elsing93] explored hydrogen as an alternative to kerosene in aero engines, implementing micromix combustion. This paper presents the incorporation of a micromix combustion chamber into an auxiliary power unit (APU) GTCP 36-300, highlighting essential adjustments made to both the gas turbine and engine controller. With the integrated chamber, safe hydrogen operation is achieved, mimicking kerosene combustion. This is achieved through the utilisation of small diffusion-type flamelets, which effectively decrease residence time and improve reactant mixing, thereby reducing NOx emissions. Comparisons between kerosene, H2 nozzles, and H2 micromix combustion chambers (Fig. 28) revealed significantly lower NOx emissions in the micromix chamber due to flame miniaturization and the principle’s ability to reduce reactant residence time in hot flame regions.
NOx emissions relative to APU power output: (1) kerosene, (2) H2 nozzles, and (3) H2 micromix combustion chambers. Reproduced with permission [Reference Boerner, Funke, Hendrick, Recker and Elsing93].

Horikawa et al. [Reference Horikawa, Okada, Yamaguchi, Aoki, Wirsum, Funke and Kusterer94] reported that Kawasaki Heavy Industries (KHI), in collaboration with Aachen University of Applied Science and B & B-AGEMA, developed a Dry Low NOx (DLN) hydrogen combustor for a 2 MW industrial gas turbine. From 2014 to 2018, they focused on achieving stable, low NOx micromix hydrogen combustion, investigating ignition performance and flame stability under various conditions. NOx emissions were maintained at approximately 84 ppm (O2 - 15%), meeting Japan’s Air Pollution Control standards. In May 2020, KHI conducted engine demonstration tests using an M1A - 17 gas turbine in Kobe City, Japan. They successfully achieved full load operation, generating 1,635 kW of power with NOx emissions reduced to 65 ppm, marking a significant milestone in hydrogen-fueled power generation.
Funke et al. [Reference Funke, Börner, Keinz, Kusterer, Kroniger, Kitajima, Kazari and Horikawa20] explored micromix combustion using various prototype burners with different momentum flux ratios under preheated atmospheric conditions. Excessive air and hydrogen flow caused flame lift-off, resulting in increased NOx emissions. Computer simulations illustrated swirling patterns, particularly ‘Counter Rotating Vortices’ (CRV), impacting the hydrogen-air mixing. A combustion model, ‘Hybrid Eddy Break-Up (EBU)’, simulated the process, varying combustion pressure initially from atmospheric to 16 bars. The study emphasises the significance of flame anchoring and combustion conditions in NOx production, crucial for enhancing combustion processes and mitigating environmental pollution. Under the guidance of Daimler-Benz Aerospace Airbus, a joint initiative involving Allied Signal Aerospace, Bodenseewerk Gerätetechnik and Fachhochschule Aachen commenced an R&D programme. The objective was to showcase secure engine management and environmentally friendly combustion in a hydrogen-powered Auxiliary Power Unit GTCP 36-300. This endeavour integrates advancements in digital and pneumatic engine control, alongside the micromix diffusive combustion principle for hydrogen. Successful hydrogen tests were conducted with the KHD T216 gas turbine engine. Adapting the Airbus A320 APU GTCP 36-300 for hydrogen utilisation yielded promising results, demonstrating significant decreases in NOx emissions. Further developments in micromix combustor configuration aim to enhance emission reduction. Safe hydrogen metering and engine control were demonstrated, emphasising the inherent safety of diffusive burning against flashback. Considerations for rapid hydrogen fuel metering under varying load conditions highlight opportunities for future refinement, particularly in adapting to cryogenic hydrogen supply. Safe ignition and engine start procedures were devised and tested to mitigate risks of combustor deflagrations and pressure rises.
In another different way Senouci et al. [Reference Senouci, Larbi, Rouan, Bounif and Merouane95] conducted a study focusing on numerically simulating high hydrogen/air flames using the Lagrangian transported probability density function (PDF) method. This approach facilitates the calculation of fluid composition changes resulting from convection and reaction without the necessity for additional modelling, although molecular mixing modelling remains essential. The simulation accuracy hinged on the mixing constant’s value, representing the ratio between mechanical and scalar time scales. Two algebraic models for this mixing constant were integrated to enhance computational efficiency. To address turbulence effects, the study employed the Reynolds stress model (RSM), aiding in the identification of various turbulent stress areas. The primary aim was to assess the capabilities of algebraic models in predicting scalar fields within the flames. Additionally, the study explored a coherent approach that combined the Lagrangian transported PDF method with RSM models. This approach yielded satisfactory numerical results and underscored the significance of considering parameters such as preferential diffusion. Refining turbulence modelling was also highlighted as crucial for further enhancing precision in flame simulations.
Bastiaans et al. [Reference Bastiaans and Devriese90] transitioned the TURBOTEC combustion chamber from a swirler to a micromix combustion system in an industrial gas turbine, incorporating annular volumes and dilution holes to improve cooling, reduce NOx emissions and enhance combustion control. Ayed et al. [Reference Ayed, Kusterer, Funke and Keinz91, Reference Ayed, Kusterer, Funke, Keinz and Bohn92] optimised micromix burner geometry, achieving a 37% reduction in NOx emissions through design modifications, enhancing energy density in gas turbines. Boerner et al. [Reference Boerner, Funke, Hendrick, Recker and Elsing93, Reference Horikawa, Okada, Yamaguchi, Aoki, Wirsum, Funke and Kusterer94] integrated micromix combustion in an APU GTCP 36-300 for aero engines, demonstrating reduced NOx emissions with diffusion-type flamelets. Funke et al. [Reference Funke, Börner, Keinz, Kusterer, Kroniger, Kitajima, Kazari and Horikawa20] emphasised flame anchoring’s role in minimising NOx in micromix systems under varying pressures, highlighting the importance of optimised combustion conditions in both industrial and aero gas turbine applications.
Transitioning from swirler-based to micromix chambers (e.g., integrating 66 flamelets) improves cooling and homogenises temperature distribution, achieving emissions as low as 65 ppm in industrial turbines. Adjustments such as reducing AGP height by 4 mm can lower NOx by 37%, while smaller dilution holes promote leaner combustion, minimising thermal NOx. In aero applications, diffusion-type micromix flamelets reduce residence times, enabling hydrogen combustion with emissions comparable to kerosene. Vortex dynamics (e.g., counter-rotating vortices) and flame anchoring mechanisms are pivotal for mixing efficiency, though excessive airflow risks flame lift-off and emission spikes. Computational models like Lagrangian PDF and RSM aid in predicting scalar fields and turbulence impacts, yet require refined mixing constants for accuracy.
Industrial systems benefit from modular geometry adaptations (e.g., annular cooling, optimised AGP), while aero turbines leverage miniaturised flamelets for safe hydrogen integration. However, scalability challenges persist, particularly in validating high-pressure (more than16 bar) operation and ensuring material durability under cyclic thermal stresses.
Table 6 provide the research on combustion chamber geometry’s influence on combustion efficiency and emissions reduction, focusing on hydrogen operation. Studies highlight modifications such as annular volumes and dilution holes for improved cooling and reduced NOx emissions, alongside analyses of geometry changes on micromix flame structure and NOx emissions, emphasising the importance of burner head adjustments. Integration of micromix combustion into gas turbine APUs demonstrates hardware and software modifications enabling safe hydrogen operation and achieving low NOx emissions.
Effect of combustor geometry on gas turbine performance for diffusion flame

2.3 Effect of equivalence ratio
This section explores how the equivalence ratio impacts micromix technology when utilising hydrogen as a fuel, elucidating its influence on combustion efficiency and emissions control. By varying the equivalence ratio, the study investigates its role in achieving optimal combustion conditions, balancing fuel-to-air ratios to minimise emissions while maintaining combustion stability within micromix systems.
López-Juárez et al. [Reference López-Juárez, Sun, Sethi, Gauthier and Abbott60] investigated hydrogen micromix combustion to mitigate the environmental impact of gas turbines, aiming for carbon-free and ultra-low-NOx combustion, with a specific emphasis on equivalence ratios. As part of the ENABLEH2 project, micromix combustion is being developed for potential integration into civil aviation, with a focus on achieving stable combustion at lean equivalence ratios. The micromix combustor, characterised by numerous small diffusion flames, minimises mixing scale to maximise intensity. However, accurately characterising physical properties and calibrating numerical models for hydrogen-air mixtures, especially under high-pressure and high-temperature conditions, is crucial. The study employs CFD simulations with the FGM combustion model to fine-tune hydrogen micromix flames, exploring laminar Schmidt, Lewis and Prandtl numbers, as well as turbulent Schmidt numbers to predict NOx emissions accurately. Results suggest a Turbulent Schmidt number of 0.2 as an optimal compromise between flame structure and emissions prediction. Additionally, with a focus on equivalence ratios, their research aims to achieve stable combustion, particularly under lean conditions were minimal NOx emissions are anticipated. In addition, Chen et al. [Reference Chen, Zhang, Xing, Bao, Qiu, Zhang, Sun and Zhao96] investigated the influence of mixing characteristics on stability and emissions in swirl/non-swirl micromix combustors for syngas combustion in an IGCC gas turbine. Both numerical simulations and experimental investigations were conducted at atmospheric pressure, exploring a range of parameters including equivalence ratio, airflow rate and momentum ratio. Findings highlighted that maximal mixing uniformity was not imperative for micromix combustion; instead, momentum ratio and swirl emerged as crucial factors shaping mixing dynamics. Higher momentum ratios shifted the combustion reaction centre outward, impacting stability, with non-swirl flames exhibiting lower lean blow-off limits due to localised high equivalence ratios. Although CO generation was minimally affected by mixing, NOx formation was promoted, particularly in non-swirl flames where hot spots occurred in the reaction zone. Moreover, the study emphasised the non-linear relationship between mixing length and effect, suggesting the need to tailor nozzle configurations to specific application demands. Nozzles aimed at higher emission reduction prioritised enhanced swirl and extended mixing distances, especially for primary combustion. Conversely, duty nozzles requiring greater stability opted for a non-swirl structure despite lower mixing uniformity.
Lu et al. [Reference Lu, Zhang, Jiang, Xing, Liu and Qiu97] experimentally investigated flame structure and combustion dynamics of a micromix flame under varying nozzle diameters (d), equivalence ratios (ϕ), and steam dilution ratios (D). Two flame types, anchored and lifted, were identified, with distinct OH* signal distributions. Anchored flames exhibited stronger stability compared to lifted flames, with OH* primarily present in the flame shear layer for anchored flames and in the central recirculation zone for lifted flames. The analysis suggested that adjusting ϕ, D, or d could enhance flame stability and reduce NOx emissions. Furthermore, fluctuations in OH* signal intensity correlated with flame type transitions, emphasising the importance of dynamic flame characterisation for emissions control. The findings underscored the significance of optimising combustion conditions to achieve stable, low-emission micromix flames in practical applications. Similarly, in another paper [Reference Lu, Jiang, Zhang, Xing, Liu and Qiu98] larger nozzle diameters resulted in unstable flame shapes, such as ‘M’ or ‘V’ shapes, indicating unstable combustion. Analysis also showed that changes in φ and D affected OH* spatial distribution uniformity (SDU), with flame type transitions increasing SDU. Lu et al. [Reference Lu, Zhang, Xing, Liu and Qiu99] explored the characteristics of NO in steam-diluted H2/air micromix flames, examining varying d, φ, and D through experimental and numerical methods. Experimental NO emissions were compared with simulations using realisable k-ɛ and eddy dissipation concept (EDC) models (Fig. 29). Findings indicated a reduction in NO emissions with decreased φ, increased D, and decreased d, with micromix burners exhibiting more pronounced effects at high adiabatic flame temperatures (> 1600 K) compared to traditional burners. Simulation results revealed increasing thermal-dilution effects of H2O with φ, D, or d increase, while the direct chemical effect of H2O initially rose and then declined with increasing D, peaking at D = 10%. Furthermore, the direct chemical effect decreased with increased φ or d. The generation of NO via the thermal route was influenced by temperature distribution and reaction zone, while NNH route NO generation was solely controlled by the reaction zone. The study elucidated pathways and underlying causes of NOx reduction in steam-diluted micromix H2/air flames, addressing the effects of steam dilution on NOx emission characteristics under varied conditions. Key findings included a decrease in NO emissions with reduction in φ (Fig. 30) or increase in D, as well as decrease in d, with smaller d promoting stability across a wider range of D. Additionally, the study highlighted the significant impact of steam dilution on NO reduction in hydrogen flames, primarily attributed to the thermal-dilution effects of H2O. However, the direct chemical effect of H2O exhibited complex behaviour with D, showing both increasing and decreasing trends. The third-body effect of H2O was identified to reduce H concentration at higher ϕ, thus impacting NO generation. Overall, this study offered comprehensive insights into NO emission characteristics and mechanisms, essential for understanding and mitigating NOx emissions in practical applications.
NO emission (a) experimental and computational outcomes across different values of ϕ and d; (b) experimental and computational outcomes across various D and d. Reproduced with permission [Reference Lu, Zhang, Xing, Liu and Qiu99].

The emissions of NO and the pathways of NO formation in micromix design across a range of equivalence ratios, specifically ϕ = 0.6 – 1.0. Reproduced with permission [Reference Lu, Zhang, Xing, Liu and Qiu99].

López-Juárez et al. [Reference López-Juárez, Sun, Sethi, Gauthier and Abbott60] investigated both premixed and diffusion flames for hydrogen combustion in industrial gas turbines, focusing on stable, low-emission performance at lean equivalence ratios. Chen et al. [Reference Chen, Zhang, Xing, Bao, Qiu, Zhang, Sun and Zhao96] examined micromix flames in industrial gas turbines, emphasising the role of momentum ratio and swirl on stability and NOx emissions. Lu et al. [Reference Lu, Zhang, Jiang, Xing, Liu and Qiu97, Reference Lu, Zhang, Xing, Liu and Qiu99] studied micromix flames in industrial gas turbines, highlighting how nozzle diameter, equivalence ratio, and steam dilution affect flame stability and NOx emissions.
Equivalence ratio critically governs combustion stability and NOx emissions in hydrogen-fueled micromix systems, with leaner ratios (ϕ < 0.5) significantly reducing thermal NOx by lowering flame temperatures. However, excessively lean conditions risk flame lift-off or blow-off, necessitating optimised nozzle diameters and steam dilution to maintain stability. Smaller nozzles enhance mixing uniformity, anchoring flames and extending operational limits under diluted conditions, while steam injection (D) suppresses NOx via thermal quenching and chemical inhibition, though its direct chemical effects exhibit non-linear dependencies. Swirl configurations improve mixing and broaden stability ranges but may increase NOx through localised hotspots, whereas non-swirl designs prioritise simplicity at the expense of higher emissions. Computational models underscore the importance of turbulence-chemistry interactions, with parameters like Turbulent Schmidt number (0.2) proving vital for accurate NOx prediction. Anchored flames, stabilised by shear layers, outperform lifted flames in emission control, highlighting the interplay between flow dynamics and reaction zones.
Optimising equivalence ratio, nozzle geometry and dilution strategies enables ultra-low NOx (< 20 ppm) in industrial and aviation systems, yet challenges persist in balancing lean stability with transient operational demands. Scalability of nozzle miniaturisation and swirl integration to large-scale turbines remains unvalidated, alongside material durability in steam-rich environments.
2.3.1 Reactions influenced by equivalence ratio
This section explores how varying the equivalence ratio affects key reaction pathways and NO formation in micromix H2/Air flames. The formation of NOx in hydrogen combustion was found to be more complex than the conventional thermal, fuel and prompt NOx mechanisms. While these pathways were well known for hydrocarbon fuels, hydrogen combustion exhibited additional NOx formation routes, particularly under lean burn and high-pressure conditions, which played a significant role in micromix combustion systems [Reference Miller and Bowman100]. In hydrogen combustion, NOx formation predominantly occurs through specific mechanisms, which involve a series of elementary reactions contributing to the formation of nitrogen oxides (NO and NO2) during combustion processes [Reference Miller and Bowman100, Reference Kirkpatrick and Kuo101]. Among these, NO is the predominant nitrogen oxide generated, while NO2 is mainly formed through the oxidation of NO in low temperature mixing regions, particularly in non-premixed combustion systems [Reference Ströhle and Myhrvold102]. In hydrogen flames, three key pathways are responsible for NO formation: the thermal route, the N2O route and the NNH route [Reference Konnov, Colson and De Ruyck103]. The thermal NO mechanism, also referred to as the Zeldovich mechanism, involves three fundamental reactions that govern NO formation at high temperatures [Reference Zeldvich104].
 \begin{equation}{\rm{O}} + {{\rm{N}}_2}\rightleftharpoons{\rm{NO}} + {\rm{N}},\end{equation}
 \begin{equation}{\rm{N}} + {{\rm{O}}_2}\rightleftharpoons{\rm{NO}} + {\rm{O}},\end{equation}
 \begin{equation}\textrm{N} + \textrm{OH} \rightleftharpoons \textrm{NO} + \textrm{H}.\end{equation}
This mechanism is highly temperature-dependent due to its significant activation energy. As a result, thermal NO formation becomes prominent at elevated temperatures in flames.
In addition to the thermal route, the N2O pathway also plays a role in NO formation. The key reactions governing this mechanism are as follows [Reference Warnatz, Maas and Dibble105, Reference Skottene and Rian106].
 \begin{equation}{{\rm{N}}_2} + {\rm{O}} + {\rm{M}}\rightleftharpoons{{\rm{N}}_2}{\rm{O}} + {\rm{M}},\end{equation}
 \begin{equation}{{\rm{N}}_2}{\rm{O}} + {\rm{O \rightleftharpoons NO}} + {\rm{NO}},\end{equation}
 \begin{equation}{{\rm{N}}_2}{\rm{O}} + {\rm{H \rightleftharpoons NO}} + {\rm{NH}}.\end{equation}
In this pathway, NO formation is enhanced at high pressures due to the involvement of a third body, M, in reaction (4). Since three-body reactions generally have low activation energy, the formation rate of NO remains relatively unaffected by lower temperatures, unlike in the thermal NO mechanism.
Additionally, the N2O route is more prominent under lean combustion conditions. Bozzelli and Dean [Reference Bozzelli and Dean107] later introduced an alternative NO formation pathway involving NNH radicals. The fundamental reactions governing this NNH route are as follows.
 \begin{equation}{{\rm{N}}_2} + {\rm{H}}\rightleftharpoons{\rm{NNH}},\end{equation}
 \begin{equation}{\rm{NNH}} + {\rm{O\rightleftharpoons NO}} + {\rm{NH}}.\\\end{equation}
The NNH route and the N2O route are linked by the reaction [Reference Bozzelli and Dean107].
 \begin{equation}{\rm{NNH}} + {\rm{O}}\rightleftharpoons{{\rm{N}}_2}{\rm{O}} + {\rm{H}}.\end{equation}
The NNH pathway plays a significant role in regions such as flame fronts, where there is a relatively high concentration of H and O radicals [Reference Haworth, Mackie and Bacskay108].
While high temperatures contribute to NOx formation, lean-burn and high-pressure conditions also play a significant role through alternative pathways. In micromix combustion, the reduction of thermal NOx does not eliminate overall NOx emissions, as mechanisms such as NNH and N2O pathways become more significant. High-pressure conditions enhance the formation rates of these intermediates, leading to NOx production even at lower temperatures [Reference Konnov and De Ruyck109, Reference Konnov110]. Chen et al. [Reference Chen, Zhang, Xing, Bao, Qiu, Zhang, Sun and Zhao96] observed that non-swirl flames with high equivalence ratios increased thermal NOx via the Zeldovich mechanism. In micromix flames, CO formed in fuel-rich zones. Swirl nozzles reduced NOx, while non-swirl nozzles enhanced flame stability. Lu et al. [Reference Lu, Zhang, Jiang, Xing, Liu and Qiu97, Reference Lu, Jiang, Zhang, Xing, Liu and Qiu98] examined how variations in the equivalence ratio (φ) affected flame dynamics in micromix H2/Air/steam flames. With an increase in φ, significant changes were observed in the flame’s reaction zones and stability. Higher φ values caused the OH* signal to concentrate in the flame central recirculation zone and flame tail zone in lifted flames, which indicated more intense reaction rates and heat release. In contrast, anchored flames showed stronger OH* signals primarily in the flame shear layer zone, highlighting different reaction characteristics. The adjustment of φ altered the dynamics of the reaction zones and influenced the overall stability of the flame, thereby affecting the combustion process. Similarly, in another paper [Reference Gomez Escudero, Tran, Overbaugh, McDonell, Williams, Buelow, Ryon and DeBeni89] examined the effects of varying φ on NO formation mechanisms within a micromix H2/Air flame. With an increase in φ, the thermal NO formation pathway became more prominent, primarily due to elevated flame temperatures and higher concentrations of radicals such as OH and O. In contrast, the NO production via the NNH pathway diminished as φ increased, attributed to changes in the reaction zones. The connection between φ and NO formation was closely associated with the flame’s temperature distribution and the presence of key reactive species, emphasising that the thermal and NNH pathways were the main routes affected by changes in ϕ.
The φ critically influences NOx formation pathways in hydrogen micromix combustion, with thermal (Zeldovich), N2O, and NNH mechanisms exhibiting distinct dependencies. Higher φ values (richer mixtures) amplify thermal NOx due to elevated temperatures and radical concentrations (OH, O), while suppressing the NNH pathway. Conversely, lean conditions (lower φ) reduce thermal NOx but promote N2O and NNH routes, particularly under high pressure, where third-body reactions and radical interactions dominate. Swirl configurations mitigate NOx by enhancing mixing and dispersing heat, whereas non-swirl designs prioritise flame stability at the expense of localised hotspots. Steam dilution effectively lowers thermal NOx through thermal quenching, though its direct chemical effects vary non-linearly with dilution ratios. Smaller nozzle diameters improve mixing uniformity, stabilising flames and broadening operational limits under lean or diluted conditions, while larger diameters risk unstable combustion and emission spikes. Optimising φ, nozzle geometry, and swirl dynamics is essential for balancing low NOx emissions and flame stability in industrial systems. However, challenges persist in predicting pathway dominance under high-pressure or transient conditions, necessitating advanced models that integrate turbulence-chemistry interactions.
The summary of the effect of equivalence ratio is provided in Table 7.
Effect of equivalence ratio on combustion characteristics and mixing effects

Numerous materials were utilised for the injector design, combustion geometry and air gate. The materials were carefully chosen based on their distinct properties and appropriateness for the specific application, enhancing the performance, durability and efficiency of the combustion system [Reference Saravanamuttoo, Cohen and Rogers111]. The selection of materials was pivotal in refining the combustion process and ensuring the dependable operation of the components across different operational conditions.
In designing an injector for high-temperature environments, the choice of materials is critical to ensure durability and performance. The injector is mainly crafted from Inconel, a nickel-chromium alloy renowned for its exceptional resistance to heat and oxidation. With a melting point of approximately 1400°C, a density of 8.4 g/cm³, and a thermal conductivity of 11 W/mK. Inconel ensures that the injector can withstand the harsh conditions of combustion without compromising its structural integrity or functionality [Reference Landry-Blais, Sivić and Picard71].
The combustion geometry, essential for maintaining optimal combustion conditions, is constructed using a stainless-steel alloy. This material offers high thermal conductivity and excellent structural integrity, with a melting point around 1500°C and a density of 7.8 g/cm³. Its thermal conductivity of 16 W/mK ensures that heat is efficiently managed, preventing thermal deformation and ensuring consistent combustion performance even under extreme temperatures [Reference Giannouloudis, Sun, Corsar, Booden, Singh, Abbott, Nalianda and Sethi65, Reference Giovannoni, Sharma and Raine112].
For the air gate, advanced ceramics are employed due to their superior wear resistance and stability during thermal cycling. With a melting point close to 2000°C, a density of 3.5 g/cm³, and a thermal conductivity of 30 W/mK, these ceramics enhance the durability and longevity of the air gate system. The material’s ability to endure repeated heating and cooling cycles without degrading makes it an ideal choice for this component, ensuring reliable performance over extended periods [Reference Price, Kimmel, Chen, Bhattacharya, Fahme and Otsuka113].
3.0 Current state-of-the-art Micromix Technology
The state-of-the-art micromix technology for hydrogen combustion in gas turbines is being developed and tested in several countries, but many existing public domain technologies, particularly from the US, Korea, China, and Japan, are underreported in the literature.
In the US, Siemens Energy has applied micromix combustion technology in their SGT-800 gas turbine, which is a 47 MW-class turbine used for industrial power generation. Siemens has incorporated micromix burners into this turbine to facilitate the combustion of hydrogen-rich fuels while keeping NOx emissions low. The SGT-800 is designed for high efficiency, and with micromix burners, it has demonstrated over 90% hydrogen operation with low emissions, making it an important development in hydrogen energy [Reference Freitag, Stolle, Kullmann, Linssen and Stolten114, Reference Almailea115].
South Korea has been actively developing hydrogen combustion technology, with Doosan Heavy Industries working on large-scale gas turbines equipped with micromix burners. Their H-class gas turbine, which is over 400 MW, is designed for hydrogen-fueled power plants. The micromix burners used in Doosan’s system enable distributed combustion, which minimises NOx emissions while ensuring stable flame propagation in hydrogen combustion, addressing critical challenges in large-scale applications [Reference Cho, Jeong, Hwang and Kim116, Reference Dennis, Long and Jesionowski117].
In China, Harbin Electric Corporation and Dongfang Electric have been involved in the development of hydrogen-fueled gas turbines using micromix technology. These companies have focused on scaling the micromix concept for industrial turbines, emphasising the optimisation of fuel-air mixing to improve flame stability and reduce emissions. The micromix-equipped turbines are part of China’s efforts to integrate hydrogen into its energy mix and meet decarbonisation goals [Reference Funke, Börner, Keinz, Kusterer, Kroniger, Kitajima, Kazari and Horikawa20, Reference Langston118].
In Japan, Kawasaki Heavy Industries developed the GPB17MMX, a 1.8 MW-class gas turbine cogeneration system incorporating micromix combustion technology, successfully operating on 100% hydrogen fuel. This advancement in hydrogen-based power generation demonstrated the system’s adaptability to varying hydrogen supply conditions, enhancing its operational flexibility [Reference Funke, Börner, Keinz, Kusterer, Kroniger, Kitajima, Kazari and Horikawa20]. During performance evaluations, the GPB17MMX generated approximately 1,786 kW using pure hydrogen combustion, while a mixed-fuel approach with a 50% hydrogen ratio produced around 1,744 kW. Fuel consumption rates were recorded at approximately 2,126 Nm³/h for 100% hydrogen combustion, whereas the 50% hydrogen-natural gas mixture required around 440 Nm³/h of each fuel. A primary challenge in hydrogen combustion is NOx emissions [Reference Langston118, Reference Funke, Boerner, Keinz, Kusterer, Haj Ayed, Tekin, Kazari, Kitajima, Horikawa and Okada119], which Kawasaki effectively mitigated through a proprietary combination of micromix and supplemental combustion techniques, maintaining emissions below regulatory limits with a maximum of 70 ppm (O2 = 16%) [Reference Haque, Nemitallah, Abdelhafez, Mansir and Habib120, Reference York, Ziminsky and Yilmaz121]. Additionally, the system demonstrated strong cogeneration capabilities, producing nearly 5.0 tons per hour of steam at a steam pressure of 0.78 MPaG, further improving its overall efficiency and industrial applicability. By successfully addressing challenges related to hydrogen’s high combustion speed and flame characteristics, Kawasaki set a benchmark in low-emission hydrogen energy systems, making a significant contribution to global decarbonisation efforts [Reference Cecere, Giacomazzi, Di Nardo and Calchetti122, Reference Bothien, Ciani, Wood and Fruechtel123].
4.0 Conclusion
The main aim of the review is to study the ultra-low NOx emissions while maintaining stable and efficient combustion, particularly for hydrogen-rich fuels. This review examined a broad spectrum of research on diffusion and premixed flame in micromix combustion technology across diverse applications like industrial gas turbine, aero gas turbine where majority of combustion process incorporated latest techniques. Researchers employed CFD simulations, experimental testing and numerical modelling to explore various burner designs, injector configurations, fuel compositions and operating conditions for performance optimisation.
Micromix combustion technology has advanced significantly in both industrial and aero gas turbines, demonstrating remarkable potential for reducing NOx emissions and improving combustion efficiency. The key factors such as air gate design, blockage ratio and combustion chamber geometry play crucial roles in optimising performance and emissions. Diffusion flames in micromix combustors have achieved NOx emissions as low as 4 to 14 ppm by optimising burner geometries and nozzle designs, enhancing air distribution and flame stability. In contrast, premixed flames in aero turbines have consistently reached NOx levels below 2.5 ppm due to precise nozzle arrangements and enhanced mixing. The integration of hydrogen as a fuel in micromix systems show promising results offering rapid ignition and stable operation, especially in high-altitude conditions. In industrial turbines, optimising blockage ratio has led to significant reductions in NOx emissions, with adjustments from 30% to 35% reducing NOx by 15%. For aero turbines, careful modulation of blockage ratio contributes to achieving low emissions and high efficiency. Advanced simulations and experimental data underscore the effectiveness of micromix technology in achieving low-emission, high-efficiency gas turbine operations, highlighting its suitability for future advancements in both industrial and aero gas turbines.
Overall, micromix combustion technology, through both diffusion and premixed approaches, presents a viable solution for advancing cleaner and more efficient gas turbine operations. Effective fuel blending, injector design and careful control of combustion parameters are essential for achieving low-emission, high-performance outcomes in both industrial and aero gas turbines.
5.0 Future Research Directions
Future research in micromix combustion technology holds immense potential for efficiency and emission reduction. Key areas for investigation include advanced nozzle design, computational modelling, renewable fuel integration, scalability and industrial applications.
Optimising nozzle design is very much crucial for enhanced combustion efficiency and reduced emissions. Advanced manufacturing techniques can create intricate geometries to promote optimal fuel-air mixing and minimise NOx formation. Novel materials with superior heat resistance and durability can optimise performance under extreme conditions. 3D printing facilitates customised nozzle designs for precise fuel injection control.
Advancements in CFD and numerical simulations offer deeper insights into combustion phenomena. Multi-scale models bridge detailed reaction kinetics and macroscopic flow dynamics for accurate predictions. Machine learning accelerates model development and optimises design parameters.
Integrating micromix combustion technology with renewable fuels requires comprehensive compatibility assessments. Co-combustion strategies blending hydrogen with biofuels or synthetic fuels enable a transition to renewable energy sources with minimal environmental impact. Scaling up micromix technology for industrial use entails addressing technical challenges and optimising ancillary systems for efficient operation. Field tests validate performance under real-world conditions, driving further refinement for industrial deployment. The above-stated research directions will advance micromix combustion technology, fostering cleaner and more efficient combustion processes for a sustainable energy future.
Acknowledgements
The fellowship for Mr. Sushant K. Bawne is supported by AICTE – Quality Improvement Programme (QIP) and their support is gratefully acknowledged.
Competing interests
All authors have contributed to this submission.