
I. INTRODUCTION
With the development and wide applications of electric and telecommunication equipment in electric and electronic industries, some problems regarding electromagnetic interference (EMI) have been serious because it degrades the lifetime, efficiency, and also affects the safety operation of many electronic devices. Reference Sun, Ma, Zhang and Gu1,Reference Stergiou and Litsardakis2 To avoid such problems, all electronic equipment must be shielded against electromagnetic aggressions. Microwave absorbing materials (MAM) can dissipate electromagnetic wave by converting it into thermal energy, and they have drawn more and more attention due to the important applications in microwave technology and radar detection. Reference Petrov and Gagulin3,Reference Abbas, Dixit, Chatterjee and Goel4 It is generally acknowledged that MAM should possess electric and/or magnetic dipoles that interact with the electromagnetic fields in the radiation to obtain good absorption properties, in addition, they are required to have broad bandwidth, strong absorption capability, low density, and thin absorber thickness. Reference Li, Wang, Huang, Yan, Qi, Liu and Zhang5 The commonly used MAM are ferrites, carbon, and metallic magnetic materials. Reference Zhao, Shao, Fan, Xie, Wang and Zhang6,Reference Wang, Wu, Shen, Guo and Wang7 Ferrites, including spinel ferrites and hexagonal ferrites, have strong absorption properties, but they are often limited in the desired frequency range because their Snoek's limit is small that the imaginary part of permeability is considerably lower in the gigahertz range. Reference Lian, Deng, Han, Tang and Feng8 Carbon materials, including graphite, graphene, carbon fiber and carbon nanotube, are typical electric loss type microwave absorbers and present high complex permittivity values owing to their superior electric conductive loss and relaxation, Reference Zhao, Lei, Zhan, Meng, Jia, Zhong and Liu9 but they usually cannot obtain effective absorption due to the absence of magnetic loss as well as their poor impedance matching characteristic. Reference Zhang, Yu, Hu, Li, Wu, Wang, Li, Sun and Chen10
Compared with ferrites, metallic magnetic materials possess high complex permeability even in the high frequency because these materials are free from Snoek's limit at gigahertz ranges. Reference Xie, Wang, Zhang, Yuan, Shi, Lin and Lu11 Moreover, compared with carbon, they have both dielectric and magnetic losses. Among all the metallic magnetic materials, Fe–B submicrometer particles have attracted great interest due to their high saturation magnetization and high Curie temperature. Reference Ocon, Trinh Ngoc, Yi, de Leon, Lee and Lee12 Liu et al. have reported the good EM wave absorption properties of α-Fe/Fe3B/Y2O3 composites in the 0.05–20.05 GHz range, and found that compared with α-Fe/Y2O3 composites, the resonance frequency (f r) of α-Fe/Fe3B/Y2O3 shifted to a higher frequency range due to the large anisotropy field (H A) of tetragonal Fe3B (∼0.4 MA/m). Reference Liu, Itoh and Machida13 They have also reported that the nanocomposites of Fe2B/C prepared by mechanical grinding technique showed better EM wave absorption characteristics in the higher frequency than the nanocomposites of α-Fe/C. Reference Liu, Itoh, Horikawa, Itakura, Kuwano and Machida14 Y.Q. Wu et al. have noted Fe3B/Nd2Fe14B as high-performance magnets, which could be fabricated by annealing the amorphous melt-spun ribbons, and the microstructure of nanocomposites was strongly dependent on the annealing condition as well as the alloy composition. Reference Jin and Liu15,Reference Hirosawa, Kanekiyo, Shigemoto, Murakami, Miyoshi and Shioya16 However, reasons of the enhanced absorption properties of the composites by adding Fe–B particles have not been reported specifically in the literature studies. It is no doubt that studying the properties of Fe–B particles is conducive to further understand the effect of Fe–B particles on the EM wave properties of the composites. Hence, it is meaningful to investigate the microstructure, magnetic properties, and microwave absorption properties of Fe–B particles.
In the present study, we synthesized Fe–B amorphous submicrometer particles by liquid phase reduction method. The Fe–B amorphous submicrometer particles were then annealed at 400, 500, and 600 °C, respectively. The effect of annealing temperature on microstructure, static magnetic properties, and microwave absorption properties of Fe–B submicrometer particles were investigated.
II. EXPERIMENTAL
A. Preparation
All chemical reagents were from Beijing Swiss Chemical Reagents Company. All chemicals used in this work were of analytical grade and were used without further purification.
Fe–B submicrometer particles were synthesized by reduction of Fe2+ with sodium borohydride. In a typical experiment, 3.71 g FeSO4·7H2O was dissolved in 100 mL distilled water, then a mixture composed of NH3·H2O (28 wt%, 100 mL), NaBH4 (1.52 g), and distilled water (100 mL) was added in 20 min with mechanical stirring. The function of ammonium hydroxide was to prevent sodium borohydride from hydrolyzing. After a reaction of 20 min at 25 °C, the target products were collected and rinsed with distilled water and ethanol for several times and then dried under flowing argon atmosphere at 60 °C for 12 h. The as-synthesized Fe–B particles were denoted as Fe–B-no anneal. Then, the as-synthesized products were annealed at 400, 500, and 600 °C for 1 h under flowing argon atmosphere (with a heat rate of 5 °C/min). The as-obtained products were denoted as Fe–B-400, Fe–B-500, and Fe–B-600, respectively, based on the applied annealing temperature.
B. Characterization
The morphologies of the samples were conducted with a transmission electron microscope (TEM; JEOL-2010, JEOL Ltd., Tokyo, Japan) and a scanning electron microscope (SEM; QUANTA600, Scanservice Corporation, Tustin, California). Mass fraction of element boron was analyzed by inductively coupled plasma-mass spectrometry (ICP-MS; Agilent 8800, Agilent Technologies, Tokyo, Japan) technology. A differential scanning calorimetry (DSC; 404F3, NETZSCH Ltd., Selb, Germany) curve was obtained on a differential scanning calorimeter at a heating rate of 10 °C/min to find the crystallization temperature of the as-synthesized Fe–B submicrometer particles. The phase identifications of the samples were carried out by x-ray diffraction (XRD; Bruker D8 Advance, Bruker Ltd., Gießen, Germany) using diffractometer with Cu Kα radiation (λ = 1.54056 A) in a scattering range (2θ) of 5–90 with a scan rate of 0.02 s−1. Hysteresis loops were recorded by a vibrating sample magnetometer (VSM; Lake Shore 7410, Lake Shore Ltd., Columbus, Ohio) at room temperature, with a maximum magnetic field of 3 T and the sample is filled in Perspex sample holder which is vibrated horizontally with the frequency of 76 Hz. The complex dielectric permittivity (ε = ε′ − jε″) and magnetic permeability (μ = μ′ − jμ″) were obtained by measuring the scattering parameters (including S 11 and S 12) using a HP8722ESS vector network analyzer by the coaxial reflection/transmission technique in the frequency range 2–18 GHz. The samples for microwave measurements were prepared by randomly dispersing the products into the paraffin matrix with a mass content of 60 wt% and compressing into a coaxial rings with an outer diameter of 7.0 mm, an inner diameter of 3.0 mm, and a thickness of 2 mm.
III. RESULTS AND DISCUSSION
A. Structural and morphological study
SEM, TEM, and selected area electron diffraction (SAED) were used to reveal the morphologies and microstructures of the Fe–B particles synthesized by liquid phase reduction method (sample Fe–B-no anneal). As shown in Figs. 1(a) and 1(b), Fe–B-no anneal are relatively uniform spherical particles with a mean diameter of about 180 nm. SAED pattern indicates that these Fe–B submicrometer particles are of amorphous structure. Boron content (wt%) of Fe–B-no anneal was analyzed by ICP-MS technology and the result is shown in Table I, which reveals that boron content (wt%) of Fe–B-no anneal is 6.72 wt% (27.12 at.%). All these results improve that the Fe–B amorphous submicrometer particles are successfully synthesized.
(a) SEM and (b) TEM and SAED images of Fe–B-no anneal.

Boron content (wt%) of Fe–B-no anneal.

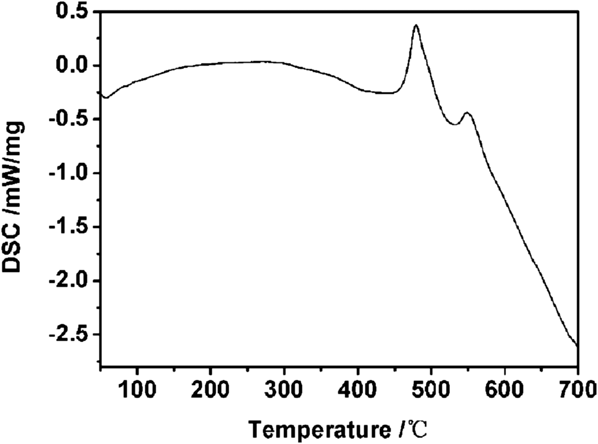
To find the crystallization temperature for Fe–B-no anneal, the DSC measurement is carried out as shown in Fig. 2. From the DSC curve, it is found that two obvious exothermic peaks appear at 479 °C and 548 °C, respectively, revealing that there might be two types of crystallization for the Fe–B amorphous submicrometer particles.
DSC curve of Fe–B-no anneal.

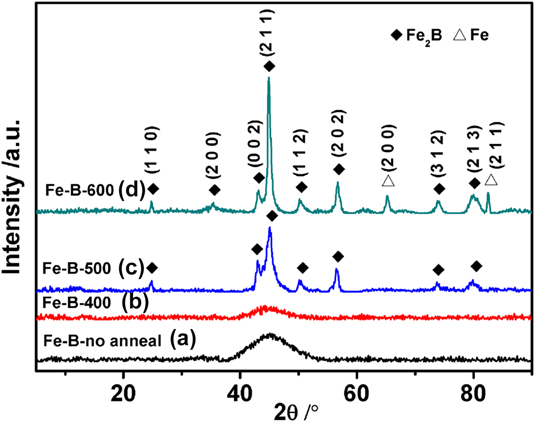
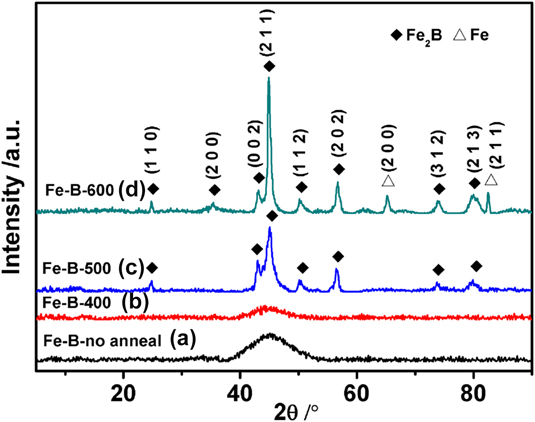
Figure 3 shows XRD patterns of the sample Fe–B-no anneal and the Fe–B submicrometer particles annealed at 400, 500, and 600 °C. It can be seen that Fe–B-no anneal and Fe–B-400 are showing a typical pattern of amorphous alloys. The broad peak centered at 2θ = 45° indicates the characteristics for the Fe-based amorphous sample. Reference Liang, Han, Yan and Deng17 This result is in accordance with results of the SAED pattern. As what the results of DSC curve show, when the annealing temperature increases to higher than 479 °C, the Fe–B amorphous submicrometer particles begin to crystallize. All the peaks of Fe–B-500 can be well indexed to a pure Fe2B phase according to JCPDS card no 65-2693. In the pattern of Fe–B-600, the peaks indicated by rhombus can be assigned to the (1 1 0), (2 0 0), (0 0 2), (2 1 1), (1 1 2), (2 0 2), (3 1 2), and (2 1 3) reflection of the tetragonal Fe2B (JCPDS card no 65-2693). Moreover, the peaks marked by triangle are from cubic α-Fe (JCPDS card no 06-0696). These little peaks belonging to Fe are due to the crystallization of α-Fe at 548 °C, which is demonstrated by the results of DSC curve. The sample Fe–B-600 consists of 76.15 wt% Fe2B and 24.85 wt% Fe according to the result of ICP-MS. Since the intermetallic compound has a certain atomic ratio, there is a component segregation in the cooling process, thus it is difficult to ensure that there is only Fe2B single phase. Reference Ma, Huang, Xing, Liu, He, Fu, Wang, Li and Yi18 The degree of crystallinity of Fe2B particles are further increased by increasing the annealing temperature from 500 to 600 °C. The crystallite size of Fe2B particles can be estimated from the variation of the line broadening of the XRD peaks by using Scherrer formula Reference Zhao, Sun, Mao and Du19 and the results are shown in Table II. It is observed that the average crystalline size increases with the increase of annealing temperature. This result is in accordance with the study of Yousefi Reference Yousefi, Manouchehri, Arab, Mozaffari, Amiri and Amighian20 and is due to the grain growth of the Fe2B phase.
XRD patterns of the Fe–B submicrometer particles with (a) Fe–B-no anneal, (b) Fe–B-400, (c) Fe–B-500, and (d) Fe–B-600.
Calculated grain size of Fe2B submicrometer particles.

Figure 4 shows SEM-micrographs of the Fe–B submicrometer particles annealed at 400 °C, 500 °C, and 600 °C, respectively. The uniform shape and size of the particles are obviously varied with the increase of the annealing temperature. As shown in Fig. 4(a), Fe–B-400 are still uniform spherical particles with mean diameter of about 370 nm. Figures 4(b) and 4(c) show that when the annealing temperature is increased to 500 and 600 °C, spherical particles aggregate into irregularly shaped particles and the particle size continuously increases with the increase of annealing temperature.
SEM-micrographs of the Fe–B submicrometer particles with (a) Fe–B-400; (b) Fe–B-500; (c) Fe–B-600.

B. Static magnetic properties
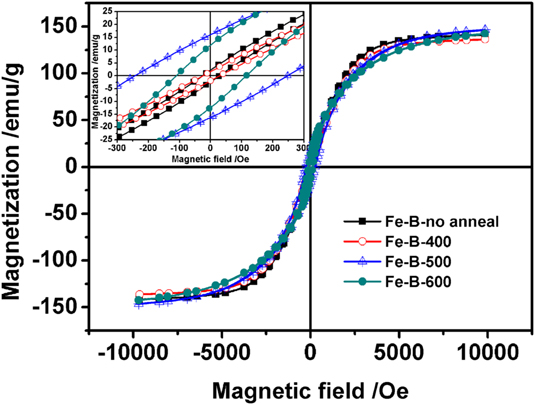
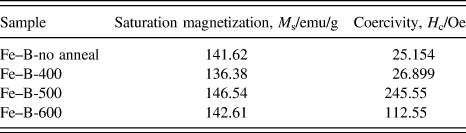
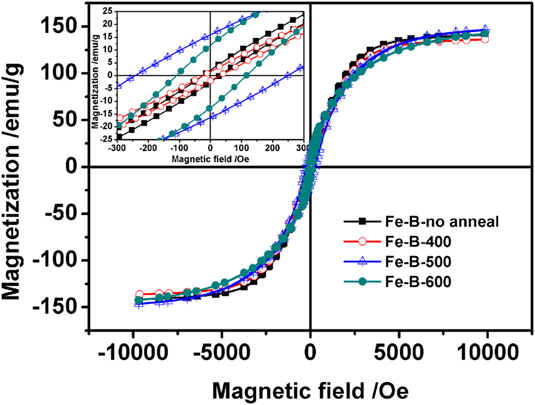
The magnetic hysteresis loops of the sample Fe–B-no anneal, Fe–B-400, Fe–B-500, and Fe–B-600 are shown in Fig. 5. Values of saturation magnetization and coercivity are listed in Table III. All the samples are ferromagnetic and saturate below the magnetic field of 10,000 Oe. It can be seen that all the samples exhibit almost the same saturation magnetization (M s) of 141.78 ∓ 5.4 emu/g with the increase of annealing temperature. Note that the annealing effect might not affect the value of M s for the Fe–B submicrometer particles. This result shows value of M s to be absolutely dependent on the material composition, which is in agreement with the previous literature, which shows that the annealing treatment has no obvious influence on the M s value of Ni–20 wt% Fe nanopowders. Reference Lee, Kwon and Lee21
The magnetic hysteresis loops of the Fe–B submicrometer particles with (a) Fe–B-no anneal; (b) Fe–B-400; (c) Fe–B-500, and (d) Fe–B-600.
The magnetic properties of Fe–B submicrometer particles.
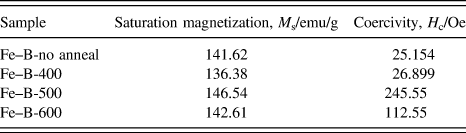
Unlike the saturation magnetization, the coercivity (H c) of samples changes a lot with the increase of the annealing temperature. Fe–B-no anneal and Fe–B-400 exhibit H c values of 25.154 and 26.899 Oe, respectively, while Fe–B-500 and Fe–B-600 exhibit obviously much larger H c values (245.55 and 112.55 Oe, respectively) than Fe–B-no anneal and Fe–B-400. According to the results of XRD patterns, we can see that Fe–B-no anneal and Fe–B-400 are all amorphous phases while Fe–B-500 and Fe–B-600 have crystalline phases. Since the crystalline phase boundaries could greatly hinder the shift of domain walls, hence H c value largely increases after crystallization. Reference Sun, Gutierrez, Yacaman, Dong and Jin22 It can also be seen that after crystallization, with increasing the annealing temperature, H c values of the samples decrease. Namely, the relationship between the coercivity and particle size (D) is described as H c = a + b/D (D is the particle size, a and b are constants), Reference Tang, Zhong, Liu, Jiang, Wu and Du23 which means that the smaller particles have a higher coercivity. Therefore, it is reasonable that the higher H c value of Fe–B-500 is ascribed to the smaller size effect. Moreover, annealing can decrease the defects to some extent and as a result, the domain wall displacement will occur more easily, thus further decrease H c value of the samples.
C. Dynamic dielectric and magnetic properties
Generally, the microwave absorption properties of material are mainly determined by its dielectric properties (the complex dielectric permittivity εr = ε′ − jε″), magnetic properties (the complex magnetic permeability μr = μ′ − jμ″), and the electromagnetic impedance match. The real and imaginary parts represent the storage and the loss of electromagnetic wave energy in absorbers through various magnetic and/or dielectric phenomena, respectively. Reference Tyagi, Baskey, Agarwala, Agarwala and Shami24
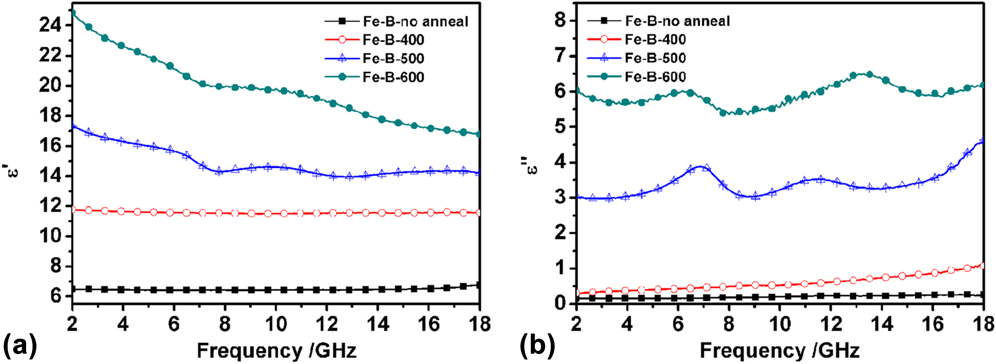
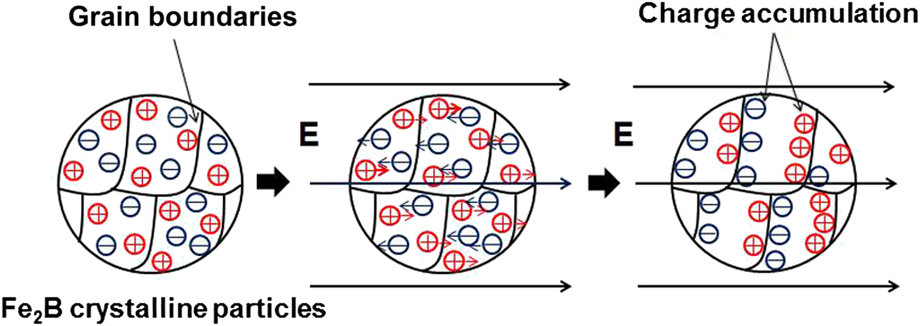
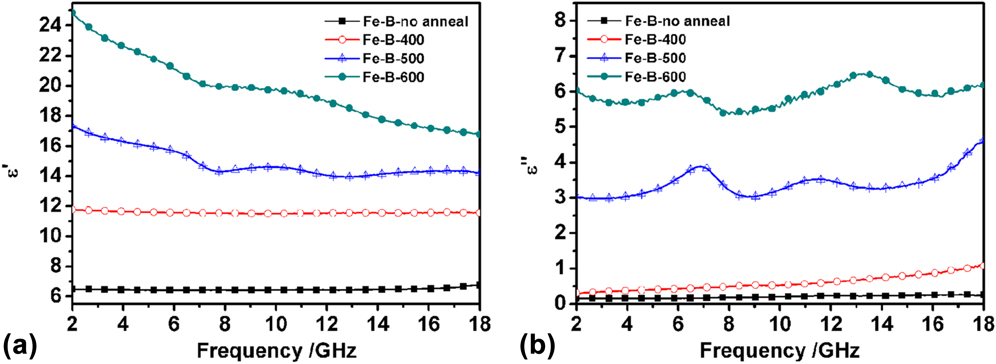
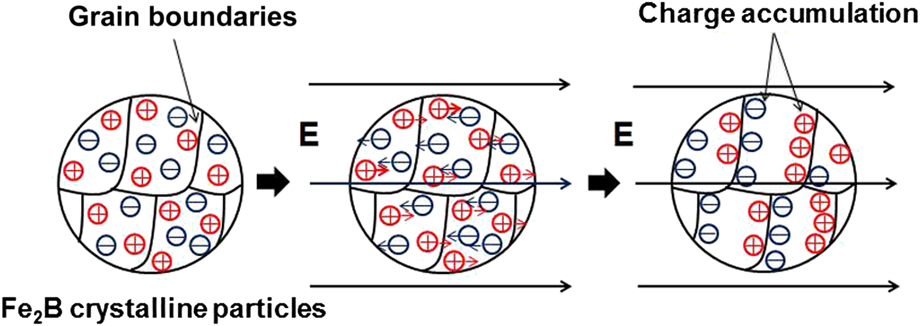
The relative complex permittivity of wax paraffin composites filled with Fe–B-no anneal, Fe–B-400, Fe–B-500, and Fe–B-600 as functions of frequency from 2.0 to 18.0 GHz are shown in Figs. 6(a) and 6(b). It can be seen from Fig. 6(a) that the real part (ε′) of the complex permittivity of Fe–B-no anneal are almost constant with no obvious variation between 6.49 and 6.74. However, with the increase of annealing temperature, ε′ value of the samples gradually increases, which suggests more energy storage and polarization. Reference Zhao, Fan, Shao, Zhao and Zhang25,Reference Zhao, Zhao, Shao, Fan and Zhang26 As is reported in the literature, two kinds of mechanisms for the polarization phenomena, which are the space charge polarization and the dipole polarization, could be used to explain the frequency dependency of permittivity in the metal-based composites. Reference Kim, Kim, Ahn and Kim27 Therefore, the obvious increase of permittivity with increasing annealing temperature could be attributed to the following reasons: on the one hand, as illustrated in Fig. 7, the crystallization of Fe–B submicrometer particles brings about a great number of grain boundaries, which hinder the movement of free charges, leading to charge accumulation, thus the space charge polarization is greatly enhanced and ε′ is increased. On the other hand, Fe particles in Fe2B particles can play the role of dipole. Under an applied electric field, they will steer owing to the effect of electric field force and arrange regularly in the field direction, as demonstrated in the SiC particles which were dispersed in SiBCN ceramics. Reference Ye, Zhang, Yin, Zhang, Kong, Li, Liu and Cheng28 Especially, according to M = M 0·e−Q/RT (where M is the mobility of grain boundary, M 0 is the factor of mobility, Q is the activation energy for migration of grain boundary, and R is gas constant), Reference Helfen, Wu, Birringer and Krill29 with the temperature rising, the effective transition probability of atomics increases, which improve effectively the ability of dipole polarization, resulting in a higher ε′ consequently. Similarly, Fig. 6(b) shows that ε″ value of the samples also increase as the annealing temperature increases, which indicates the more superior dielectric loss. Notably, the sample Fe–B-500 and Fe–B-600 exhibit multiple peaks on the ε″ curve, symbolizing a resonance behavior, this is supposed to occur when the absorbing materials are highly conductive and the skin effect is dominant. Reference Zhao, Zhao, Shao, Fan and Zhang30 According to free electron theory, ε″ ≈ 1/2πε0ρf, where ρ is the resistivity. Reference Zhang, Dong, Huang, Liu, Wang, Zhu, Lv, Lei and Lee31,Reference Zhao, Shao, Fan, Zhao and Zhang32 For the Fe–B samples, inner stresses, and defects in the samples can be effectively reduced by anneal process, thus with annealing temperature increasing, the stresses and defects in the material should be reduced, leading to low resistivity and induce conduction and electric loss. Therefore, ε″ value of the samples increases as the annealing temperature increases.
Frequency dependence of (a) real part (ε′) and (b) imaginary part (ε″) of relative permittivity of paraffin composites filled with Fe–B-no anneal, Fe–B-400, Fe–B-500, and Fe–B-600.
The enhanced space charge polarization for Fe2B crystalline particles.
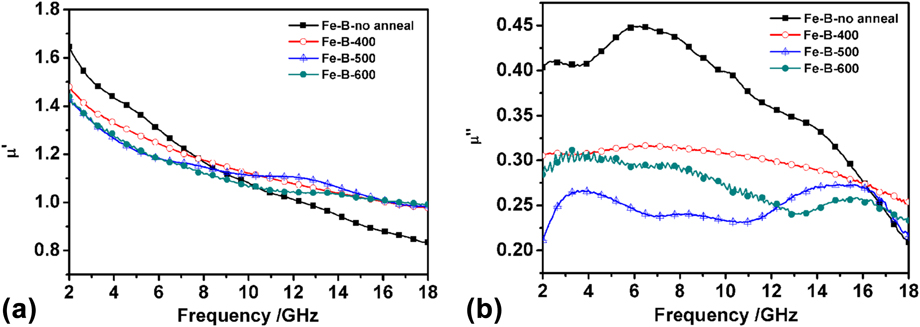
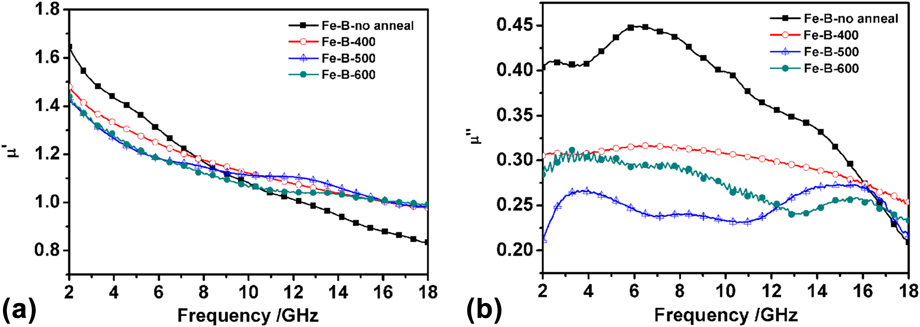
Figures 8(a) and 8(b) show the frequency dispersion of the complex permeability of paraffin composites filled with Fe–B-no anneal, Fe–B-400, Fe–B-500, and Fe–B-600. All the samples have the largest μ′ at 2 GHz and then decrease steadily with frequency due to the domain-wall motion and relaxation. Reference Ruan, Xu, Suo, Wu, Xiang and Zhao33 From Fig. 8(b), peaks of μ″ at about 2–4 GHz are observed for all the samples. Meanwhile, the μ″ curve of Fe–B-no anneal exhibits 3 peaks at 2.56, 6.24, and 14.08 GHz. After being annealed, the μ″ values decline and exhibit different peaks. Fe–B-no anneal has the largest value of μ″ at almost the whole 2–18 GHz frequency, which may attribute to the exchange coupling between the fine grains. Reference Xie, Song, Zhang, Tang, Bian and Lu34
Frequency dependence of (a) real part (ε′) and (b) imaginary part (ε″) of relative permeability of paraffin composites filled with Fe–B-no anneal, Fe–B-400, Fe–B-500, and Fe–B-600.
Generally, the microwave magnetic loss of magnetic materials originates mainly from the magnetic hysteresis, domain wall resonance, natural resonance, and eddy current effect. Reference Aharoni35 Actually, the hysteresis comes from irreversible magnetization and is negligible in a weak applied field. The domain wall resonance occurs only in multidomain materials and in megahertz range, Reference Gupta, Patra, Shukla, Saini, Songara, Jani, Vadera and Kumar36 thus the peaks at the frequency at above 2 GHz cannot be attributed to the domain wall resonance. According to previous literature, the eddy current loss contribution to the μ″ is related to the diameter of metal particles d and the electric conductivity σ (μ″ = 2πμ0(μ′)σd 2 f −1/3, where μ0 is the permeability of vacuum). Reference Kim, Min and Koh37 If the magnetic loss only results from eddy current loss, the values of μ″(μ′)−2 f −1 should be constant in the varied frequency. However, as shown in Fig. 9, the value of μ″(μ′)−2 f −1 becomes markedly diverse as the frequency increases for all of the four samples, so the eddy current loss could also be excluded. By the analysis above, it is reasonable that the magnetic loss of the Fe–B submicrometer is mainly from the natural resonance.
Frequency dependence of values of μ″(μ′)−2 f −1 for the paraffin composites filled with Fe–B-no anneal, Fe–B-400, Fe–B-500, and Fe–B-600.

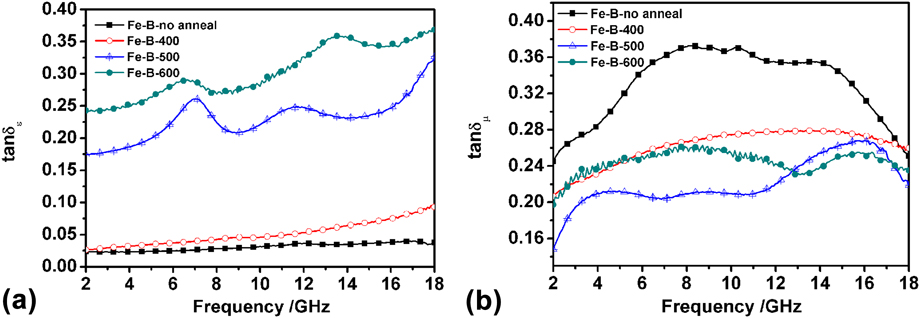
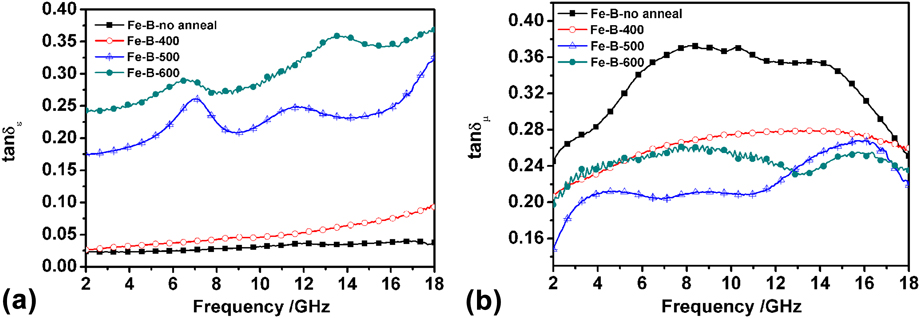
The dielectric loss tangent (tan δε) and magnetic loss tangent (tan δμ) are presented as a function of frequency as shown in Figs. 10(a) and 10(b). The dielectric loss tangent and magnetic loss tangent, called the dissipation value, is the ratio of the ε″ to the ε′ indicating the dielectric loss and the ratio of μ″ to the μ′ indicating the magnetic loss. As shown, tan δε of Fe–B-no anneal and Fe–B-400 are low, illustrating poor dielectric loss abilities. However, it increases as the annealing temperature increases, especially when the temperature is above 500 °C, they show significant improvement, indicating that after crystallization, the dielectric loss abilities of Fe–B submicrometer particles have greatly improved. It can be seen in Fig. 10(b) that Fe–B-no anneal has the largest value of tan δμ at almost all the frequencies between 2 and 18 GHz. After being annealed, tan δμ of the samples decreases. The tendency of the increase of tan δε and the decrease of tan δμ manifests that the EM wave absorption performance of Fe–B submicrometer particles is attributed to more dielectric loss rather than magnetic loss with the increase of annealing temperature. Reference Zhao, Fan, Shao, Wang, Pian, Li and Zhang38,Reference Zhao, Shao, Fan, Xie and Zhang39 It can also seen from the tan δμ curves of Fe–B-500 and Fe–B-600 that there are peaks at high frequency at about 15 GHz. Since the magnetic loss in GHz range is believed to be due to the resonance absorption. The resonance frequency of magnetization rotation under the action of anisotropy field, with no external static magnetic field applied, can be simply expressed as 2πf = νH a, where ν is the gyromagnetic ratio, f r is the resonance frequency, and H a is the anisotropy field. Reference Liang, Han, Yan and Deng17 Crystallization of Fe–B submicrometer particles brings large magnetocrystalline anisotropy field, therefore, H a increases, the peak of tan δμ moves to higher frequency.
Frequency dependence of (a) the dielectric loss tangent (tan δε) and (b) magnetic loss tangent (tan δμ) of paraffin composites filled with Fe–B-no anneal, Fe–B-400, Fe–B-500, and Fe–B-600.
D. Microwave absorption properties
The reflection loss (RL) can be expressed as a function of normalized input impedance of metal backed absorber. The normalized input impedance (Z in) of a microwave absorbing layer backed by reflector is given by the following equation:
 $${Z_{{\rm{in}}}} = {\left( {{\mu _{\rm{r}}}/{\varepsilon _{\rm{r}}}} \right)^{{1 \over 2}}}\tanh \left( {j\left( {2\pi d/\lambda } \right){{\left( {{\mu _{\rm{r}}}{\varepsilon _{\rm{r}}}} \right)}^{{1 \over 2}}}} \right)\quad .$$
εr and μr are relative permittivity and permeability of medium, λ is the wave length of microwave in free space, and d is the thickness of an absorber. The RL is related to Z in as Reference Deng and Han40,Reference Che, Zhi, Liang and Zhou41 :
 $${\rm{RL}} = 20\,{\log _{10}}\,\left| {{{\left( {{Z_{{\rm{in}}}} - 1} \right)} \mathord{\left/ {\vphantom {{\left( {{Z_{{\rm{in}}}} - 1} \right)} {\left( {{Z_{{\rm{in}}}} + 1} \right)}}} \right. \kern-\nulldelimiterspace} {\left( {{Z_{{\rm{in}}}} + 1} \right)}}} \right|\quad .$$
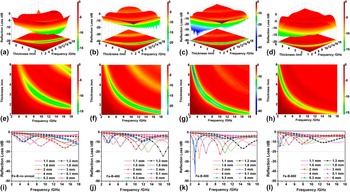
3-D images of RL, thickness and frequency for the paraffin wax composites with 60 wt% the four samples are illustrated in Figs. 11(a)–11(h). The corresponding 2-D maps of RL are shown in Figs. 11(i)–11(l). It can be found that for all the four samples, the microwave absorption peaks of the samples move to low frequencies with increasing thickness, which can be explained by the formula of f m = c/(2πμ″d). For Fe–B-no anneal composites [Figs. 11(a), 11(e) and 11(i)], a minimum RL value of −15.99 dB at 14.72 GHz is observed with a thickness of 2 mm. For the paraffin wax composites with Fe–B-400 [Figs. 11(b), 11(f) and 11(j)], the minimum value of RL is −24.27 dB at 16.72 GHz when the thickness is 1.3 mm. As can be seen from Figs. 11(c), 11(g) and 11(k), the Fe–B-500 composites exhibit excellent microwave absorption properties. There is a sharp and strong peak at 3.12 GHz with the maximum RL of −43.16 dB when the thickness is 5.1 mm. Moreover, it has less than −20 dB absorption band at 2.28–10.48 GHz by adjusting the thickness at 1.8–6 mm, which corresponds to more than 90% absorption efficacy. Further, on increasing the annealing temperature to 600 °C, the optimal RL becomes about −15.38 dB at 2.40 GHz with a thickness of 5.3 mm [Figs. 11(d), 11(h) and 11(l)]. Hence, annealing treatment with a proper temperature enhances the electromagnetic (EM) performance on the whole.
Frequency and thickness dependence of the RL for the paraffin composites filled with (a, e, and i) Fe–B-no anneal; (b, f, and j) Fe–B-400; (c, g, and k) Fe–B-500 and (d, h, and l) Fe–B-600.

As is reported, there are two main requirements for maximum reflection in a RAM material, the first is proper matching impedance between the absorbing layer and free space which causes the EM wave to enter the layer conveniently; poor impedance matching may lead to a strong electromagnetic reflection. The degree of matching impedance can be expressed with the impedance matching ratio, which can be calculated by Eqs. (3)–(8). Reference Aharoni35,Reference Lv, Ji, Liang, Zhang and Du42,Reference Kong, Yin, Ye, Li, Zhang and Cheng43
 $$Z = {{{Z_1}} \mathord{\left/ {\vphantom {{{Z_1}} {{Z_0}}}} \right. \kern-\nulldelimiterspace} {{Z_0}}}\quad ,$$
 $${Z_1} = {\left( {{{{\mu _{\rm{r}}}} \mathord{\left/ {\vphantom {{{\mu _{\rm{r}}}} {{\varepsilon _{\rm{r}}}}}} \right. \kern-\nulldelimiterspace} {{\varepsilon _{\rm{r}}}}}} \right)^{1/2}}{Z_0}\quad ,$$
 $${\mu _{\rm{r}}} = \mu ' - {\rm{j}}\mu ''\quad ,$$
 $${\varepsilon _{\rm{r}}} = \varepsilon ' - {\rm{j}}\varepsilon ''\quad ,$$
 $$\left| \varepsilon \right| = {\left( {{{\varepsilon '}^2} + {{\varepsilon ''}^2}} \right)^{1/2}}\quad ,$$
 $$\left| \mu \right| = {\left( {{{\mu '}^2} + {{\mu ''}^2}} \right)^{1/2}}\quad ,$$
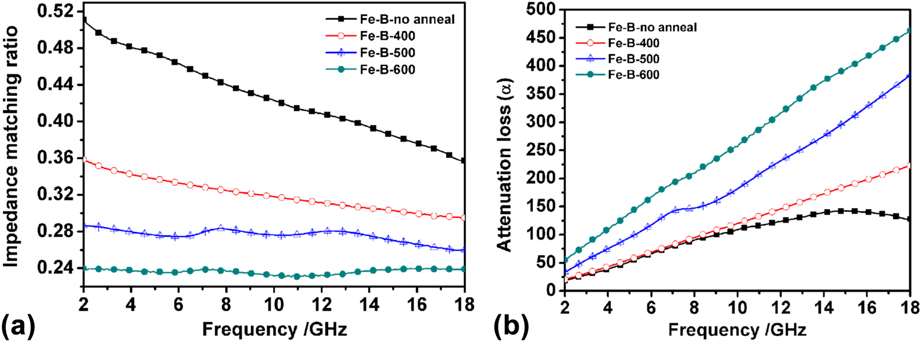
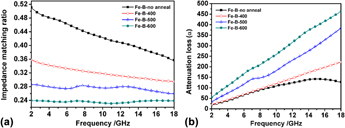
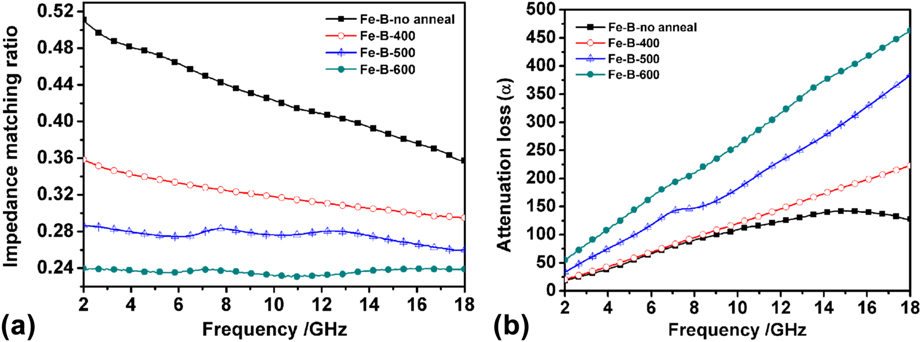
where Z 1 represents the impedance value of the absorbing material, Z 0 is the impedance of the free space. The second is suitable attenuation constant α, which represents the integral attenuation ability and can be expressed as Eq. (9). Reference Zhao, Lei, Zhan, Meng, Jia, Zhong and Liu9,Reference Sunny, Kurian, Mohanan, Joy and Anantharaman44 The calculated impedance matching ratio and attenuation constant of the four samples are shown in Figs. 12(a) and 12(b), respectively. It is clearly seen from Fig. 12 that with the increasing annealing temperature, impedance of the samples decreases while the attenuation constant α increases, so both Fe–B-no anneal and Fe–B-600 could not show really good absorption properties due to the poor attenuation and impedance mismatch between air and RAM layer, respectively. However, Fe–B-500 could effectively moderate impedance matching and attenuation constant, showing excellent microwave absorption properties.
 $$\alpha = \left( {{{\sqrt 2 \pi f} \mathord{\left/ {\vphantom {{\sqrt 2 \pi f} c}} \right. \kern-\nulldelimiterspace} c}} \right) \;\times \sqrt {\left( {\mu ''\varepsilon '' - \mu '\varepsilon '} \right) + \sqrt {{{\left( {\mu ''\varepsilon '' - \mu '\varepsilon '} \right)}^2} + {{\left( {\varepsilon '\mu '' + \varepsilon ''\mu '} \right)}^2}} }$$
Frequency dependence of (a) the impedance matching ratio and (b) attenuation loss α for the paraffin composites filled with Fe–B-no anneal, Fe–B-400, Fe–B-500, and Fe–B-600.
IV. CONCLUSIONS
Fe–B amorphous submicrometer particles with a size of 180 nm were synthesized by liquid phase reduction method and the annealing temperature has great effect on the properties of Fe–B submicrometer particles.
-
(1) In structural and morphological study, the as-synthesized Fe–B amorphous submicrometer particles were crystallized into Fe2B phase when annealing temperature is 479 °C. With the increasing annealing temperature, the saturation magnetization had no obvious changes, while the coercivity was increased at the first due to crystallization and then decreased due to the smaller size effect.
-
(2) The electromagnetic properties of Fe–B submicrometer particles are highly dependent on annealing temperature. Due to the desired electromagnetic impedance matching and attenuation constant, the maximum RL of paraffin-based composites containing 60 wt% Fe–B-500, among the four Fe–B particles obtained at different temperatures, reached the minimum RL of −43.16 dB at 3.12 GHz with a thickness of 5.1 mm, and the effective microwave absorption (RL < −20 dB) was obtained in a wide frequency range of 2.28–10.48 GHz when varying the thickness from 1.8 to 6 mm, indicating good electromagnetic absorption property.