1 Introduction
Hill’s vortex (Hill Reference Hill1894) is one of the few known analytical solutions of Euler’s equations in three-dimensional (3D) space
 ${\it\Omega}=\mathbb{R}^{3}$
. In the cylindrical polar coordinate system
 $(x,{\it\sigma},{\it\phi})$
, it represents a compact axisymmetric region of azimuthal vorticity
 ${\bf\omega}=[0,0,{\it\omega}_{{\it\phi}}]$
moving with a constant velocity along the coordinate direction
 $x$
. Hill’s vortex is a particular (limiting) case of the Norbury–Fraenkel family of 3D axisymmetric vortex rings (Fraenkel Reference Fraenkel1972; Norbury Reference Norbury1973). Given the Stokes streamfunction
 ${\it\psi}={\it\psi}(x,{\it\sigma})$
and the operator
 $\mathscr{L}:=\boldsymbol{{\rm\nabla}}\boldsymbol{\cdot }((1/{\it\sigma})\,\boldsymbol{{\rm\nabla}})$
, in which
 $\boldsymbol{{\rm\nabla}}:=[\partial /\partial x,\partial /\partial {\it\sigma}]^{\text{T}}$
(where ‘:=’ means ‘equal to by definition’), these flows satisfy the following system in the frame of reference moving with the translation velocity
 $W$
of the vortex:
 $$\begin{eqnarray}\displaystyle & \displaystyle \mathscr{L}{\it\psi}=-{\it\sigma}\,f({\it\psi})\quad \text{in }{\it\Omega}, & \displaystyle\end{eqnarray}$$
 $$\begin{eqnarray}\displaystyle & \displaystyle {\it\psi}\rightarrow -{\textstyle \frac{1}{2}}W{\it\sigma}^{2}\quad \text{as }|\boldsymbol{x}|:=\sqrt{x^{2}+{\it\sigma}^{2}}\rightarrow \infty , & \displaystyle\end{eqnarray}$$
 $f({\it\psi})$
has the form
 $$\begin{eqnarray}f({\it\psi})=\left\{\begin{array}{@{}ll@{}}\mathscr{C}, & {\it\psi}>k,\\ 0, & {\it\psi}\leqslant k,\end{array}\right.\end{eqnarray}$$
in which
 $\mathscr{C}\neq 0$
and
 $k\geqslant 0$
are constants. System (1.1)–(1.2) therefore describes a compact region
 $\mathscr{D}$
with azimuthal vorticity
 ${\it\omega}:={\it\omega}_{{\it\phi}}$
varying proportionally to the distance
 ${\it\sigma}$
from the flow axis embedded in a potential flow. The boundary of this region
 $\partial \mathscr{D}:=\{(x,{\it\sigma},{\it\phi})\;:\;{\it\psi}(x,{\it\sigma})=k\}$
is a priori unknown and must be found as a part of the problem solution. System (1.1)–(1.2) thus represents a free-boundary problem and, as will become evident below, this property makes the study of the stability of solutions more complicated. For Hill’s vortex, the equilibrium shape of the boundary
 $\partial \mathscr{D}$
has the form of a sphere with the flow described in the translating frame of reference by the streamfunction
 $$\begin{eqnarray}{\it\psi}(x,{\it\sigma})=\left\{\begin{array}{@{}ll@{}}{\displaystyle \frac{\mathscr{C}{\it\sigma}^{2}}{10}}(a^{2}-{\it\sigma}^{2}-x^{2}), & \text{if }x^{2}+{\it\sigma}^{2}\leqslant a^{2},\\ {\displaystyle \frac{\mathscr{C}{\it\sigma}^{2}a^{2}}{15}}\left[{\displaystyle \frac{a^{3}}{(x^{2}+{\it\sigma}^{2})^{3/2}}}-1\right], & \text{if }x^{2}+{\it\sigma}^{2}>a^{2},\end{array}\right.\end{eqnarray}$$
where
 $a$
is the radius of the sphere. The components of the velocity field
 $\boldsymbol{v}=[v_{x},v_{{\it\sigma}},v_{{\it\phi}}]^{\text{T}}$
can then be obtained as
 $v_{x}=(1/{\it\sigma})(\partial {\it\psi}/\partial {\it\sigma})$
,
 $v_{{\it\sigma}}=-(1/{\it\sigma})(\partial {\it\psi}/\partial x)$
and
 $v_{{\it\phi}}=0$
. Constant
 $\mathscr{C}$
in (1.2), the translation velocity
 $W$
and the vortex radius
 $a$
are all linked through the relation (Wu, Ma & Zhou Reference Wu, Ma and Zhou2006)
 $$\begin{eqnarray}W={\textstyle \frac{2}{15}}\mathscr{C}a^{2},\end{eqnarray}$$
from which it follows that, for a fixed radius
 $a$
, Hill’s vortices represent a one-parameter family of solutions. To fix attention, unless indicated otherwise, hereafter we will set
 $a=1$
,
 $\mathscr{C}=-1$
, so that
 $W=-2/15$
(i.e. the vortex is moving to the left).
Owing to the presence of a sharp interface separating the vortical and potential flow regions, inviscid vortices in two and three dimensions are described by equations of the free-boundary type. In addition to making the process of finding (relative) equilibrium configurations more difficult, this also complicates their stability analysis. The main difficulty is that generic perturbations modify the domain on which the governing partial differential equations (PDEs) are defined together with their boundary conditions, an effect that must be taken into account in the derivation of the linearized evolution equations.
Most earlier approaches to studying the stability of inviscid vortices have relied on methods adapted to specific problems. The stability of the simplest configurations, namely the Rankine and Kirchhoff vortices, was first investigated, respectively, by Kelvin (Reference Kelvin1880) and Love (Reference Love1893). Further insights about these problems were provided by the studies of Moore & Saffman (Reference Moore, Saffman, Olsen, Goldburg and Rogers1971), Baker (Reference Baker1990), Guo, Hallstrom & Spirn (Reference Guo, Hallstrom and Spirn2004) and Mitchell & Rossi (Reference Mitchell and Rossi2008). The linear stability of more complex vortex configurations, such as polygonal arrays of co-rotating vortices and translating vortex pairs, was investigated by Dritschel (Reference Dritschel1985, Reference Dritschel1990, Reference Dritschel1995); see also Dritschel & Legras (Reference Dritschel and Legras1991). A noteworthy feature of their approach is that they also used a continuous perturbation equation independent of a particular discretization employed to obtain the equilibrium solution. The linear stability of the so-called
 $V$
-states (Wu, Overman & Zabusky Reference Wu, Overman and Zabusky1984), co-rotating vortex patches and infinite periodic arrays of vortices was investigated in detail by Kamm (Reference Kamm1987); see as well Saffman (Reference Saffman1992). This approach was based on the representation of the solution in terms of the Schwarz function, and required discretization and numerical differentiation in order to obtain the perturbation equation. A discrete form of the perturbation equation was also used by Elcrat, Fornberg & Miller (Reference Elcrat, Fornberg and Miller2005) in their investigation of the linear stability of vortices in a symmetric equilibrium with a circular cylinder and a free stream at infinity. Another family of approaches is based on variational energy arguments going back to Kelvin. They were initially investigated by Saffman & Szeto (Reference Saffman and Szeto1980), Dritschel (Reference Dritschel1985, Reference Dritschel1988) and Fukumoto & Moffatt (Reference Fukumoto and Moffatt2008), and were more recently pursued by Luzzatto-Fegiz & Williamson (Reference Luzzatto-Fegiz and Williamson2010, Reference Luzzatto-Fegiz and Williamson2012). They rely on global properties of the excess energy versus velocity impulse diagrams and provide partial information about the linear stability properties without the need to actually perform a full linear stability analysis.
A systematic and general approach to the study of the stability of inviscid vortices was recently developed by the present authors (Elcrat & Protas Reference Elcrat and Protas2013). It is defined entirely in the continuous setting and relies on the ‘shape-differential’ calculus (Delfour & Zolésio Reference Delfour and Zolésio2001) for a rigorous treatment of boundary deformations and their effect on the linearized evolution. A starting point of this approach is an equilibrium configuration (a ‘fixed point’) of a contour-dynamics formulation of the flow evolution (Pullin Reference Pullin1992). The boundary of the vortex region is then perturbed in the normal direction and the contour-dynamics equations are linearized, via shape differentiation, around the equilibrium configuration. As a result, a singular integro-differential equation is obtained for the linearized evolution of the normal perturbation. It is defined on the vortex boundary and the associated eigenvalue problem encodes information about stability. In contrast to most of the earlier approaches mentioned above, this formulation is general, in the sense that it is not tailored to a particular vortex configuration and does not involve any simplifications (such as boundary conditions satisfied only approximately or numerical differentiation). It also does not restrict the imposed perturbations to be irrotational. Therefore, the obtained singular integro-differential equation may be considered a vortex-dynamics analogue of the Orr–Sommerfeld equation used to study the stability of viscous parallel shear flows (Drazin & Reid Reference Drazin and Reid2004). It was shown by Elcrat & Protas (Reference Elcrat and Protas2013) that the classical stability analyses of Kelvin (Reference Kelvin1880) and Love (Reference Love1893) can be derived as special cases from the proposed framework. In situations in which the eigenvalue problem is not analytically tractable, the integro-differential equation can be approximated numerically with spectral accuracy (Elcrat & Protas Reference Elcrat and Protas2013).
As regards the stability of Hill’s vortex, which is the subject of the present study, Moffatt & Moore (Reference Moffatt and Moore1978) made the following remark in their paper: ‘
 $\ldots$
it is rather remarkable that its stability characteristics have not been investigated in detail’. In the light of this comment made more than 35 years ago, it is perhaps even more remarkable that important aspects of this problem in fact still remain open. More precisely, only partial results are available corresponding to the linearized response of Hill’s vortex to a perturbation applied to its boundary. Moffatt & Moore (Reference Moffatt and Moore1978) studied the response to axisymmetric perturbations by analysing an approximate equation for the evolution of the vortex boundary (a similar approach had been developed earlier by Bliss (Reference Bliss1973)). Their key finding was that the perturbations evolve towards the shape of a sharp ‘spike’ localized at the rear stagnation point and directed into or out of the vortex depending on the form of the initial perturbation. The authors also noted the absence of any oscillatory components in the vortex response. These observations were confirmed by the computations of Pozrikidis (Reference Pozrikidis1986), who studied the evolution of disturbances well into the nonlinear regime. He demonstrated that the spike-like deformation of the vortex boundary arising from the linear instability leads to a significant fluid detrainment or entrainment over longer times. The response of Hill’s vortex to general, non-axisymmetric perturbations was studied using approximate techniques based on expansions of the flow variables in spherical harmonics and numerical integration by Fukuyu, Ruzi & Kanai (Reference Fukuyu, Ruzi and Kanai1994) and Rozi (Reference Rozi1999). Their main findings were consistent with those of Moffatt & Moore (Reference Moffatt and Moore1978), namely that perturbations of the vortex boundary develop into sharp spikes whose number depends on the azimuthal wavenumber of the perturbation. A number of investigations (Lifschitz Reference Lifschitz1995; Rozi & Fukumoto Reference Rozi and Fukumoto2000; Hattori & Hijiya Reference Hattori and Hijiya2010) studied the stability of Hill’s vortex with respect to short-wavelength perturbations applied locally and advected by the flow in the spirit of the Wentzel–Kramers–Brillouin (WKB) approach (Lifschitz & Hameiri Reference Lifschitz and Hameiri1991). These analyses revealed the presence of a number of instability mechanisms, although they are restricted to the short-wavelength regime. In this context, we also mention the study by Llewellyn Smith & Ford (Reference Llewellyn Smith and Ford2001), who considered the linear response of the compressible Hill’s vortex to acoustic waves.
Our present investigation attempts to complete the picture by performing, for the first time, a global spectral stability analysis of Hill’s vortex with respect to axisymmetric perturbations. We provide numerical evidence based on highly accurate computations that this problem is not, in fact, well posed in the sense that the eigenfunctions are ‘distributions’ (i.e. they are not continuous functions of the arclength). By considering a sequence of suitably regularized problems and using methods of harmonic analysis, it is demonstrated that the eigenfunctions corresponding to, respectively, the unstable and stable modes have the form of infinitely sharp spikes localized at the rear and front stagnation points. These findings thus refine the conclusions from the earlier approximate computations (Moffatt & Moore Reference Moffatt and Moore1978; Fukuyu et al. Reference Fukuyu, Ruzi and Kanai1994; Rozi Reference Rozi1999). We also show that the discrete spectrum corresponding to the stable and unstable modes is complemented by a continuous spectrum of equally non-smooth neutrally stable eigenmodes. The structure of the paper is as follows. In § 2 we use methods of the shape calculus to derive the stability equation. In § 3 we describe and validate the numerical approach, whereas computational results are presented in § 4. The results are discussed in § 5 and final comments are deferred to § 6.
2 Derivation of the stability equation
In this section we first provide details of the contour-dynamics formulation in the 3D axisymmetric geometry, which is the basis of our approach. Then, methods of the shape calculus are used to derive an integro-differential equation characterizing the stability of Hill’s vortex. Finally, we discuss some properties of this equation. Hereafter
 $\mathscr{A}$
will denote the projection of the axisymmetric vortex region
 $\mathscr{D}$
onto the meridional plane
 $\{x,{\it\sigma}\}$
.
The formalism of contour dynamics is a convenient way to study the evolution of inviscid flows with piecewise smooth vorticity distributions (Pullin Reference Pullin1992). Given a time-dependent region
 $\mathscr{A}(t)$
, where
 $t$
is time, its evolution can be studied by tracking the points
 $\boldsymbol{y}(t)$
on its boundary
 $\partial \mathscr{A}(t)$
via the equation
 $$\begin{eqnarray}\frac{\text{d}\boldsymbol{y}(t)}{\text{d}t}=\boldsymbol{v}(\boldsymbol{y}(t))=\mathscr{C}\,\int _{\partial \mathscr{A}(t)}\unicode[STIX]{x1D646}(\boldsymbol{y}(t),\boldsymbol{y}^{\prime })\,\text{d}s_{\boldsymbol{ y}^{\prime }},\quad \forall ~\boldsymbol{y}(t)\in \partial \mathscr{A}(t),\end{eqnarray}$$
where
 $\unicode[STIX]{x1D646}(\boldsymbol{y}(t),\boldsymbol{y}^{\prime })$
is a suitable Biot–Savart kernel,
 $\boldsymbol{y}$
and
 $\boldsymbol{y}^{\prime }$
are defined in the absolute frame of reference and
 $\text{d}s_{\boldsymbol{y}^{\prime }}$
is an arclength element of the vortex boundary in the meridional plane. An equilibrium shape of the vortex boundary, denoted
 $\partial \mathscr{A}$
(without the argument
 $t$
), can be characterized by transforming the coordinates to the translating frame of reference
 $\boldsymbol{x}(t):=\boldsymbol{y}(t)-Wt\,\boldsymbol{e}_{x}$
and considering the normal component of (2.1),
 $$\begin{eqnarray}\boldsymbol{n}_{\boldsymbol{x}}\boldsymbol{\cdot }\frac{\text{d}\boldsymbol{x}(t)}{\text{d}t}=\mathscr{C}\,\boldsymbol{n}_{\boldsymbol{x}}\boldsymbol{\cdot }\left[\int _{\partial \mathscr{A}}\unicode[STIX]{x1D646}(\boldsymbol{x}(t),\boldsymbol{x}^{\prime })\,\text{d}s_{\boldsymbol{ x}^{\prime }}-W\,\boldsymbol{e}_{x}\right]=0,\end{eqnarray}$$
where
 $\boldsymbol{n}_{\boldsymbol{x}}$
denotes the unit vector normal to the contour
 $\partial \mathscr{A}$
at the point
 $\boldsymbol{x}$
(hereafter we will use the convention that a subscript on a geometric quantity will indicate where this quantity is evaluated). Since we have
 $\boldsymbol{x}(0)=\boldsymbol{y}(0)$
, the arguments of the kernel
 $\unicode[STIX]{x1D646}$
in (2.2) can be changed to
 $\boldsymbol{x}$
and
 $\boldsymbol{x}^{\prime }$
. Equation (2.2) expresses the vanishing of the normal velocity component on the vortex boundary in relative equilibrium. Since the equilibrium shape of the boundary
 $\partial \mathscr{A}$
is in general a priori unknown, relation (2.2) reveals the free-boundary aspect of the problem. The Biot–Savart kernel was derived by Wakelin & Riley (Reference Wakelin and Riley1996) with an alternative, but equivalent, formulation also given by Pozrikidis (Reference Pozrikidis1986). Here we will use this kernel in the form rederived and tested by Shariff, Leonard & Ferziger (Reference Shariff, Leonard and Ferziger2008),
 $$\begin{eqnarray}\displaystyle \unicode[STIX]{x1D646}(x\,\boldsymbol{e}_{x}+{\it\sigma}\boldsymbol{e}_{{\it\sigma}},x^{\prime }\boldsymbol{e}_{x}+{\it\sigma}^{\prime }\boldsymbol{e}_{{\it\sigma}}) & = & \displaystyle [(x^{\prime }-x)G(x,x^{\prime },{\it\sigma},{\it\sigma}^{\prime })\cos {\it\theta}^{\prime }-{\it\sigma}H(x,x^{\prime },{\it\sigma},{\it\sigma}^{\prime })\sin {\it\theta}^{\prime }]\boldsymbol{e}_{x}\nonumber\\ \displaystyle & & \displaystyle +\,{\it\sigma}^{\prime }H(x,x^{\prime },{\it\sigma},{\it\sigma}^{\prime })\cos {\it\theta}^{\prime }\boldsymbol{e}_{{\it\sigma}},\end{eqnarray}$$
where
 $$\begin{eqnarray}\displaystyle & \displaystyle G(x,x^{\prime },{\it\sigma},{\it\sigma}^{\prime }):=\frac{{\it\sigma}^{\prime }}{{\rm\pi}\sqrt{A+B}}K(\tilde{r}), & \displaystyle\end{eqnarray}$$
 $$\begin{eqnarray}\displaystyle & \displaystyle H(x,x^{\prime },{\it\sigma},{\it\sigma}^{\prime }):=\frac{1}{2{\rm\pi}{\it\sigma}}\left[\frac{A}{\sqrt{A+B}}K(\tilde{r})-E(\tilde{r})\,\sqrt{A+B}\right] & \displaystyle\end{eqnarray}$$
in which
 $$\begin{eqnarray}A:=(x-x^{\prime })^{2}+{\it\sigma}^{2}+{\it\sigma}^{\prime 2},\quad B:=2{\it\sigma}{\it\sigma}^{\prime },\quad \tilde{r}:=\sqrt{\frac{2B}{A+B}},\end{eqnarray}$$
whereas
 ${\it\theta}^{\prime }$
denotes the polar angle of the point
 $\boldsymbol{x}^{\prime }$
, i.e.
 $\cos {\it\theta}^{\prime }=x^{\prime }/\sqrt{x^{\prime 2}+{\it\sigma}^{\prime 2}}$
and
 $\sin {\it\theta}^{\prime }={\it\sigma}^{\prime }/\sqrt{x^{\prime 2}+{\it\sigma}^{\prime 2}}$
, and
 $K(\tilde{r})$
and
 $E(\tilde{r})$
are the complete elliptic integrals of the first and second kind, respectively (Olver et al.
Reference Olver, Lozier, Boisvert and Clark2010). We note that
 $\tilde{r}\rightarrow 1$
as
 $x^{\prime }\rightarrow x$
and
 ${\it\sigma}^{\prime }\rightarrow {\it\sigma}$
, and at
 $\tilde{r}=1$
function
 $K(\tilde{r})$
has a logarithmic singularity (more details about the singularity structure of kernel (2.3) will be provided below).
In addition to the circulation, impulse and energy conserved by all classical solutions of Euler’s equations, axisymmetric inviscid flows also conserve Casimirs
 $\iint _{\mathscr{A}(t)}{\it\Phi}({\it\omega}/{\it\sigma})\,{\it\sigma}\,\text{d}\mathscr{A}$
, where
 ${\it\Phi}:\mathbb{R}\rightarrow \mathbb{R}$
is an arbitrary function with sufficient regularity (Mohseni Reference Mohseni2001). Since circulation is particularly important from the physical point of view, we will focus on stability analysis with respect to perturbations preserving this quantity, which is the same approach as was also taken by Moffatt & Moore (Reference Moffatt and Moore1978). Circulation
 ${\it\Gamma}$
of the flow in the meridional plane is defined as
 $$\begin{eqnarray}{\it\Gamma}:=\iint _{\mathscr{A}(t)}{\it\omega}\,\text{d}\mathscr{A}\end{eqnarray}$$
and can also be viewed as the Casimir corresponding to
 ${\it\Phi}({\it\xi})={\it\xi}$
. We add that, since the flows considered here have the property
 ${\it\omega}=\mathscr{C}{\it\sigma}$
, cf. (1.1)–(1.2), conservation of circulation (2.7) implies the conservation of the volume of the vortical region.
Following the ideas laid out by Elcrat & Protas (Reference Elcrat and Protas2013), we introduce a parametrization of the contour
 $\boldsymbol{x}=\boldsymbol{x}(t,s)\in \partial \mathscr{A}(t)$
in terms of its arclength
 $s$
. We will also adopt the convention that the superscript
 ${\it\epsilon}$
, where
 $0<{\it\epsilon}\ll 1$
, will denote quantities corresponding to the perturbed boundary, so that
 $\boldsymbol{x}=\boldsymbol{x}^{{\it\epsilon}}|_{{\it\epsilon}=0}$
and
 $\boldsymbol{n}_{\boldsymbol{x}}=\boldsymbol{n}_{\boldsymbol{x}^{{\it\epsilon}}}|_{{\it\epsilon}=0}$
are the quantities corresponding to the (relative) equilibrium. Then, points on the perturbed vortex boundary can be represented as
 $$\begin{eqnarray}\boldsymbol{x}^{{\it\epsilon}}(t,s)=\boldsymbol{x}(s)+{\it\epsilon}\,r(t,s)\,\boldsymbol{n}_{\boldsymbol{x}}(s),\end{eqnarray}$$
where
 $r(t,s)$
represents the ‘shape’ of the perturbation. We note that, without affecting the final result,
 $\boldsymbol{n}_{\boldsymbol{x}}(s)$
in the last term in (2.8) could be replaced by its perturbed counterpart,
 $\boldsymbol{n}_{\boldsymbol{x}^{{\it\epsilon}}}(t,s)$
. Using (2.1) we thus deduce
 $$\begin{eqnarray}\boldsymbol{n}_{\boldsymbol{x}^{{\it\epsilon}}}\boldsymbol{\cdot }\frac{\text{d}\boldsymbol{x}^{{\it\epsilon}}(t)}{\text{d}t}=\boldsymbol{n}_{\boldsymbol{x}^{{\it\epsilon}}}\boldsymbol{\cdot }\boldsymbol{v}^{{\it\epsilon}}(\boldsymbol{x}^{{\it\epsilon}}(t))=\mathscr{C}\,\boldsymbol{n}_{\boldsymbol{x}^{{\it\epsilon}}}\boldsymbol{\cdot }\left[\int _{\partial \mathscr{A}^{{\it\epsilon}}(t)}\unicode[STIX]{x1D646}(\boldsymbol{x}^{{\it\epsilon}}(t),\boldsymbol{x}^{\prime })\,\text{d}s_{\boldsymbol{ x}^{\prime }}-W\,\boldsymbol{e}_{x}\right],\end{eqnarray}$$
from which the equilibrium condition (2.2) is obtained by setting
 ${\it\epsilon}=0$
. The perturbation equation is obtained by linearizing relation (2.9) around the equilibrium configuration characterized by (2.2), which is equivalent to expanding (2.9) in powers of
 ${\it\epsilon}$
and retaining the first-order terms. Since (2.9) involves perturbed quantities defined on the perturbed vortex boundary
 $\partial \mathscr{A}^{{\it\epsilon}}(t)$
, the proper way to obtain this linearization is using methods of the shape-differential calculus (Delfour & Zolésio Reference Delfour and Zolésio2001). Below we state the main results only and refer the reader to our earlier study (Elcrat & Protas Reference Elcrat and Protas2013) for details of all intermediate transformations. Shape-differentiating the left-hand side (LHS) of relation (2.9) and setting
 ${\it\epsilon}=0$
we obtain
 $$\begin{eqnarray}\frac{\text{d}}{\text{d}{\it\epsilon}}\left[\boldsymbol{n}_{\boldsymbol{x}^{{\it\epsilon}}}\boldsymbol{\cdot }\frac{\text{d}\boldsymbol{x}^{{\it\epsilon}}(t)}{\text{d}t}\right]\bigg|_{{\it\epsilon}=0}=\frac{\partial r}{\partial t}.\end{eqnarray}$$
As regards the right-hand side (RHS) in (2.9), we obtain
 $$\begin{eqnarray}\displaystyle & & \displaystyle \hspace{-19.91684pt}\frac{\text{d}}{\text{d}{\it\epsilon}}\left\{\mathscr{C}\,\boldsymbol{n}_{\boldsymbol{x}^{{\it\epsilon}}}\boldsymbol{\cdot }\left[\int _{\partial \mathscr{A}^{{\it\epsilon}}(t)}\unicode[STIX]{x1D646}(\boldsymbol{x}^{{\it\epsilon}}(t),\boldsymbol{x}^{\prime })\,\text{d}s_{\boldsymbol{x}^{\prime }}-W\,\boldsymbol{e}_{x}\right]\right\}\Bigg|_{{\it\epsilon}=0}\nonumber\\ \displaystyle & & \displaystyle \hspace{-19.91684pt}\quad =-\frac{\partial r}{\partial s}\,\boldsymbol{v}_{0}\boldsymbol{\cdot }\boldsymbol{t}_{\boldsymbol{x}}+\mathscr{C}\,r(s)\,\boldsymbol{n}_{\boldsymbol{x}}\boldsymbol{\cdot }\int _{\partial \mathscr{A}}\frac{\partial \unicode[STIX]{x1D646}}{\partial n_{\boldsymbol{x}}}\,\text{d}s^{\prime }+\mathscr{C}\,\boldsymbol{n}_{\boldsymbol{x}}\boldsymbol{\cdot }\int _{\partial \mathscr{A}}\left[\frac{\partial \unicode[STIX]{x1D646}}{\partial n_{\boldsymbol{x}^{\prime }}}+{\it\varkappa}_{\boldsymbol{x}^{\prime }}\unicode[STIX]{x1D646}\right]r(s^{\prime })\,\text{d}s^{\prime },\qquad\end{eqnarray}$$
where
 $\boldsymbol{t}_{\boldsymbol{x}}$
is the unit tangent vector and
 ${\it\varkappa}_{\boldsymbol{x}}$
the curvature of the contour
 $\partial \mathscr{A}$
(in the present case, with the contour
 $\partial \mathscr{A}$
given by a half-circle of unit radius,
 ${\it\varkappa}\equiv 1$
). The orientation of the unit vectors
 $\boldsymbol{t}_{\boldsymbol{x}}$
and
 $\boldsymbol{n}_{\boldsymbol{x}}$
and the sign of the curvature
 ${\it\varkappa}_{\boldsymbol{x}}$
satisfy Frenet’s convention. As explained by Elcrat & Protas (Reference Elcrat and Protas2013), the three terms on the RHS of (2.11) represent the shape-sensitivity of the RHS of (2.9) to perturbations (2.8) applied separately to the normal vector
 $\boldsymbol{n}_{\boldsymbol{x}}$
, the evaluation point
 $\boldsymbol{x}$
and the contour
 $\partial \mathscr{A}$
over which the integral is defined. Since the flow evolution is subject to constraint (2.7), this will restrict the admissible perturbations
 $r$
. Indeed, noting that
 ${\it\omega}=\mathscr{C}{\it\sigma}$
, cf. (1.1)–(1.2), and shape-differentiating relation (2.7), we obtain the following condition (Elcrat & Protas Reference Elcrat and Protas2013):
 $$\begin{eqnarray}\int _{\partial \mathscr{A}}{\it\sigma}r(s^{\prime })\,\text{d}s^{\prime }=0,\end{eqnarray}$$
restricting the class of admissible perturbations to those which do not modify the circulation (2.7), although the vorticity may change locally (analogous conditions can be obtained when the perturbations are constructed to preserve other integral invariants mentioned above). In the case of Hill’s vortex with the assumed parameter values, the equilibrium shape of the vortex boundary is given by the sphere of unit radius, so that
 $\partial \mathscr{A}=\{(x,{\it\sigma})\;:\;x^{2}+{\it\sigma}^{2}=1\}$
. In such a case, the arclength coordinate
 $s$
can be identified with the polar angle
 ${\it\theta}\in [0,{\rm\pi}]$
, so that
 $x=\cos {\it\theta}$
and
 ${\it\sigma}=\sin {\it\theta}$
. Therefore, below, we will use
 ${\it\theta}$
as our independent variable.
Combining (2.10)–(2.12) and replacing the line integrals with the corresponding definite ones, we finally obtain the perturbation equation
 $$\begin{eqnarray}\displaystyle \displaystyle \frac{\partial r}{\partial t} & = & \displaystyle -\frac{\partial r}{\partial {\it\theta}}\,\boldsymbol{v}_{0}\boldsymbol{\cdot }\boldsymbol{t}_{{\it\theta}}+\mathscr{C}\,r({\it\theta})\,\int _{0}^{{\rm\pi}}I_{2}({\it\theta},{\it\theta}^{\prime })\,\text{d}{\it\theta}^{\prime }+\mathscr{C}\,\int _{0}^{{\rm\pi}}I_{1}({\it\theta},{\it\theta}^{\prime })r({\it\theta}^{\prime })\,\text{d}{\it\theta}^{\prime }\end{eqnarray}$$
 $$\begin{eqnarray}\displaystyle & := & \displaystyle \left(\mathscr{L}r\right)({\it\theta})\nonumber\\ \displaystyle & & \displaystyle \displaystyle \text{subject to}\quad \int _{0}^{{\rm\pi}}\sin {\it\theta}^{\prime }r({\it\theta}^{\prime })\,\text{d}{\it\theta}^{\prime }=0,\end{eqnarray}$$
 $\mathscr{L}$
denotes the associated linear operator and
 $$\begin{eqnarray}\displaystyle & \displaystyle I_{1}({\it\theta},{\it\theta}^{\prime }):=\boldsymbol{n}_{{\it\theta}}\boldsymbol{\cdot }\left[\frac{\partial \unicode[STIX]{x1D646}({\it\theta},{\it\theta}^{\prime })}{\partial n_{{\it\theta}^{\prime }}}+{\it\varkappa}_{{\it\theta}^{\prime }}\unicode[STIX]{x1D646}({\it\theta},{\it\theta}^{\prime })\right]=\left[-3\cos {\it\theta}+5\,\cos {\it\theta}^{\prime }\right]\,\mathscr{Q}({\it\theta},{\it\theta}^{\prime }),\qquad & \displaystyle\end{eqnarray}$$
 $$\begin{eqnarray}\displaystyle & \displaystyle I_{2}({\it\theta},{\it\theta}^{\prime }):=\boldsymbol{n}_{{\it\theta}}\boldsymbol{\cdot }\frac{\partial \unicode[STIX]{x1D646}({\it\theta},{\it\theta}^{\prime })}{\partial n_{{\it\theta}}}=\left[\cos {\it\theta}+\cos {\it\theta}^{\prime }\right]\,\mathscr{Q}({\it\theta},{\it\theta}^{\prime }) & \displaystyle\end{eqnarray}$$
 $$\begin{eqnarray}\displaystyle & \hspace{-8.5359pt}\displaystyle \mathscr{Q}({\it\theta},{\it\theta}^{\prime }):=\frac{\left[\cos {\it\theta}^{\prime }\sin (-{\it\theta}+{\it\theta}^{\prime })+\sin {\it\theta}-\sin {\it\theta}^{\prime }\right]K(\tilde{R})+\sin {\it\theta}^{\prime }\left[\cos {\it\theta}-\cos {\it\theta}^{\prime }\right]^{2}E(\tilde{R})}{2{\rm\pi}\,\left[\cos ({\it\theta}-{\it\theta}^{\prime })-1\right]\sqrt{2-2\,\cos ({\it\theta}-{\it\theta}^{\prime })}}, & \displaystyle \nonumber\\ \displaystyle & & \displaystyle\end{eqnarray}$$
 $$\begin{eqnarray}\displaystyle & \displaystyle \tilde{R}:=\sqrt{\left[\cos \left(-{\it\theta}+{\it\theta}^{\prime }\right)-\cos \left({\it\theta}+{\it\theta}^{\prime }\right)\right]/\left[1-\cos \left({\it\theta}+{\it\theta}^{\prime }\right)\right]}. & \displaystyle\end{eqnarray}$$
As regards the singularities of the kernels, one can verify by inspection that
 $$\begin{eqnarray}\displaystyle & \displaystyle \forall ~{\it\theta}\in (0,{\rm\pi}),\quad \lim _{{\it\theta}^{\prime }\rightarrow {\it\theta}}\boldsymbol{n}_{{\it\theta}}\boldsymbol{\cdot }\unicode[STIX]{x1D646}({\it\theta},{\it\theta}^{\prime })=0, & \displaystyle\end{eqnarray}$$
 $$\begin{eqnarray}\displaystyle & \displaystyle \lim _{{\it\theta}^{\prime }\rightarrow {\it\theta}}\frac{\boldsymbol{t}_{{\it\theta}}\boldsymbol{\cdot }\unicode[STIX]{x1D646}({\it\theta},{\it\theta}^{\prime })}{\ln |{\it\theta}-{\it\theta}^{\prime }|}=-\frac{1}{2{\rm\pi}}\sin {\it\theta}, & \displaystyle\end{eqnarray}$$
 $$\begin{eqnarray}\displaystyle & \displaystyle \lim _{{\it\theta}^{\prime }\rightarrow {\it\theta}}\frac{I_{1}({\it\theta},{\it\theta}^{\prime })}{\ln |{\it\theta}-{\it\theta}^{\prime }|}=-\frac{1}{2{\rm\pi}}\cos {\it\theta}, & \displaystyle\end{eqnarray}$$
 $$\begin{eqnarray}\displaystyle & \displaystyle \lim _{{\it\theta}^{\prime }\rightarrow {\it\theta}}\frac{I_{2}({\it\theta},{\it\theta}^{\prime })}{\ln |{\it\theta}-{\it\theta}^{\prime }|}=\frac{1}{2{\rm\pi}}\cos {\it\theta}. & \displaystyle\end{eqnarray}$$
 $I_{1}({\it\theta},{\it\theta}^{\prime })$
and
 $I_{2}({\it\theta},{\it\theta}^{\prime })$
vanish at
 ${\it\theta}=0$
and
 ${\it\theta}={\rm\pi}$
. Properties (2.17a
)–(2.17d
) will be instrumental in achieving spectral accuracy in the discretization of system (2.13).
Equation (2.13a
) is a first-order integro-differential equation and as such would in principle require only one boundary condition. However, since the kernel (2.3) is obtained via averaging with respect to the azimuthal angle
 ${\it\phi}$
(due to the axisymmetry assumption (see Shariff et al.
Reference Shariff, Leonard and Ferziger2008)), the different terms and integrands in (2.13a
) exhibit the following reflection symmetries:
 $$\begin{eqnarray}\displaystyle & \displaystyle \forall ~{\it\theta}\in [0,{\rm\pi}],\quad \left(\boldsymbol{v}_{0}\boldsymbol{\cdot }\boldsymbol{t}\right)_{{\it\theta}}=-\left(\boldsymbol{v}_{0}\boldsymbol{\cdot }\boldsymbol{t}\right)_{-{\it\theta}}, & \displaystyle\end{eqnarray}$$
 $$\begin{eqnarray}\displaystyle & \displaystyle I_{1}({\it\theta},{\it\theta}^{\prime })=-I_{1}(-{\it\theta},-{\it\theta}^{\prime }), & \displaystyle\end{eqnarray}$$
 $$\begin{eqnarray}\displaystyle & \displaystyle I_{2}({\it\theta},{\it\theta}^{\prime })=-I_{2}(-{\it\theta},-{\it\theta}^{\prime }), & \displaystyle\end{eqnarray}$$
 ${\it\eta}=-{\it\theta}\in [-{\rm\pi},0]$
. This means that when (2.13a
) is considered on an extended periodic domain
 $[-{\rm\pi},{\rm\pi}]$
subject to even initial data
 $r(0,{\it\theta})=r(0,-{\it\theta})$
,
 ${\it\theta}\in (0,{\rm\pi})$
, its solution will also remain an even function of
 ${\it\theta}$
at all times, i.e.
 $r(t,{\it\theta})=r(t,-{\it\theta})$
,
 $t>0$
. In particular, if they are smooth enough, these solutions will satisfy the symmetry conditions
 $$\begin{eqnarray}\frac{\partial ^{2k-1}r}{\partial {\it\theta}^{2k-1}}\bigg|_{{\it\theta}=0}=\frac{\partial ^{2k-1}r}{\partial {\it\theta}^{2k-1}}\bigg|_{{\it\theta}={\rm\pi}}=0,\quad k=1,2,\ldots .\end{eqnarray}$$
Thus, system (2.13) with even initial data (which is consistent with the axisymmetry assumption) and subject to boundary conditions (2.19) is not an over-determined problem. These observations will be used in the next section to construct a spectral discretization of (2.13a ).
After introducing the ansatz
 $$\begin{eqnarray}r(t,{\it\theta})=\text{e}^{\text{i}{\it\lambda}t}\,u({\it\theta})+\text{c.c.},\end{eqnarray}$$
where
 $\text{i}:=\sqrt{-1}$
and
 ${\it\lambda}\in \mathbb{C}$
, system (2.13) together with the boundary conditions (2.19) takes the form of a constrained eigenvalue problem:
 $$\begin{eqnarray}\displaystyle & \displaystyle \text{i}\,{\it\lambda}\,u({\it\theta})=\left(\mathscr{L}u\right)({\it\theta}),\quad {\it\theta}\in (0,{\rm\pi}), & \displaystyle\end{eqnarray}$$
 $$\begin{eqnarray}\displaystyle & \displaystyle \text{subject to}\quad \frac{\partial ^{2k-1}u}{\partial {\it\theta}^{2k-1}}\bigg|_{{\it\theta}=0}=\frac{\partial ^{2k-1}u}{\partial {\it\theta}^{2k-1}}\bigg|_{{\it\theta}={\rm\pi}}=0,\quad k=1,2,\ldots , & \displaystyle\end{eqnarray}$$
 $$\begin{eqnarray}\displaystyle & \displaystyle \int _{0}^{{\rm\pi}}\sin {\it\theta}^{\prime }u({\it\theta}^{\prime })\,\text{d}{\it\theta}^{\prime }=0, & \displaystyle\end{eqnarray}$$
 $\mathscr{L}$
is defined in (2.13a
). The eigenvalues
 ${\it\lambda}$
and the eigenfunctions
 $u$
characterize the stability of Hill’s vortex to axisymmetric perturbations.
3 Numerical approach
In this section we describe the numerical approach with a focus on the discretization of system (2.21) and the solution of the resulting algebraic eigenvalue problem. We will also provide some details about how this approach has been validated. We are interested in achieving the highest possible accuracy and, in principle, eigenvalue problems for operators defined in the continuous setting on one-dimensional (1D) domains can be solved with machine precision using chebfun (Driscoll, Hale & Trefethen Reference Driscoll, Hale and Trefethen2014). However, at present, chebfun does not have the capability to deal with singular integral operators such as
 $\mathscr{L}$
. We have therefore implemented an alternative hybrid approach relying on a representation of the operator
 $\mathscr{L}$
in a trigonometric basis in which kernel singularities are treated analytically and chebfun is used to evaluate the remaining definite integrals with high precision.
The eigenfunctions
 $u$
are approximated with the truncated series
 $$\begin{eqnarray}u({\it\theta})\approx \boldsymbol{u}^{N}({\it\theta}):=\mathop{\sum }_{k=0}^{N-1}{\it\alpha}_{k}\cos k{\it\theta},\end{eqnarray}$$
where
 ${\it\alpha}_{0},\ldots ,{\it\alpha}_{N-1}\in \mathbb{R}$
are unknown coefficients, which satisfies exactly the boundary conditions (2.19). The interval
 $[0,{\rm\pi}]$
is discretized with equispaced grid points,
 $$\begin{eqnarray}{\it\theta}_{j}=\frac{{\rm\pi}}{N-1}\,j,\quad j=0,\ldots ,N-1\end{eqnarray}$$
(both endpoints are included in the grid). After substitution of ansatz (3.1), equation (2.21a ) is collocated on grid (3.2), whereas constraint (2.21c ) takes the form
 $$\begin{eqnarray}\mathop{\sum }_{k=0}^{N-1}{\it\alpha}_{k}\int _{0}^{{\rm\pi}}\sin {\it\theta}^{\prime }\cos k{\it\theta}^{\prime }\,\text{d}{\it\theta}^{\prime }=0,\end{eqnarray}$$
in which the integrals are evaluated as
 $$\begin{eqnarray}\int _{0}^{{\rm\pi}}\sin {\it\theta}^{\prime }\cos k{\it\theta}^{\prime }\,\text{d}{\it\theta}^{\prime }=\left\{\begin{array}{@{}ll@{}}0, & k=1,3,5,\ldots ,\\ -\displaystyle \frac{2}{k^{2}-1}, & k=0,2,4,\ldots \end{array}\right.\end{eqnarray}$$
(we note that these integrals vanish for all odd values of
 $k$
). As a result, we obtain the following discrete eigenvalue problem:
 $$\begin{eqnarray}\displaystyle & \displaystyle \text{i}{\it\lambda}\mathop{\sum }_{k=0}^{N-1}\unicode[STIX]{x1D608}_{jk}{\it\alpha}_{k}=\mathop{\sum }_{k=0}^{N-1}(\unicode[STIX]{x1D609}_{jk}+\unicode[STIX]{x1D60A}_{jk}+\unicode[STIX]{x1D60B}_{jk}){\it\alpha}_{k},\quad j=0,\ldots ,N-1, & \displaystyle\end{eqnarray}$$
 $$\begin{eqnarray}\displaystyle & \displaystyle \sum _{k\;even}\frac{{\it\alpha}_{k}}{k^{2}-1}=0, & \displaystyle\end{eqnarray}$$
 $$\begin{eqnarray}\unicode[STIX]{x1D608}_{jk}:=\cos k{\it\theta}_{j},\quad j,k=0,\ldots ,N-1\end{eqnarray}$$
is the (invertible) collocation matrix, whereas the matrices
 $\unicode[STIX]{x1D63D}$
,
 $\unicode[STIX]{x1D63E}$
and
 $\unicode[STIX]{x1D63F}$
correspond to the three terms in operator
 $\mathscr{L}$
, cf. (2.13a
). We remark that the terms corresponding to all values
 $k=0,\ldots ,N-1$
have to be included in expansion (3.1), even though their sum might not satisfy constraint (2.13b
), as otherwise the collocation problem is not well posed (i.e. matrix (3.6) is singular). Constraint (2.12) is then imposed through the generalized formulation (3.5).
The entries of matrix
 $\unicode[STIX]{x1D63D}$
, corresponding to the first term in operator
 $\mathscr{L}$
, are defined as follows:
 $$\begin{eqnarray}\unicode[STIX]{x1D609}_{jk}:=(\boldsymbol{v}_{0}\boldsymbol{\cdot }\boldsymbol{t})_{{\it\theta}_{j}}\,k\,\sin k{\it\theta}_{j},\quad j,k=0,\ldots ,N-1.\end{eqnarray}$$
The entries of matrix
 $\unicode[STIX]{x1D63E}$
, corresponding to the second term in operator
 $\mathscr{L}$
, are defined as follows:
 $$\begin{eqnarray}\unicode[STIX]{x1D60A}_{jk}:=\left(\mathscr{C}\,\int _{0}^{{\rm\pi}}I_{2}({\it\theta}_{j},{\it\theta}^{\prime })\,\text{d}{\it\theta}^{\prime }\right)\,\unicode[STIX]{x1D608}_{jk},\quad j,k=0,\ldots ,N-1,\end{eqnarray}$$
where the coefficient is given by an improper integral evaluated using the property (2.17d ) to separate the singular part of the kernel (Hackbusch Reference Hackbusch1995)
 $$\begin{eqnarray}\int _{0}^{{\rm\pi}}I_{2}({\it\theta},{\it\theta}^{\prime })\,\text{d}{\it\theta}^{\prime }=:\underbrace{\int _{0}^{{\rm\pi}}\left[I_{2}({\it\theta},{\it\theta}^{\prime })-\frac{\cos {\it\theta}}{2{\rm\pi}}\ln |{\it\theta}-{\it\theta}^{\prime }|\right]\,\text{d}{\it\theta}^{\prime }}_{\mathscr{T}({\it\theta})}+\underbrace{\frac{\cos {\it\theta}}{2{\rm\pi}}\int _{0}^{{\rm\pi}}\ln |{\it\theta}-{\it\theta}^{\prime }|\,\text{d}{\it\theta}^{\prime }}_{\mathscr{S}({\it\theta})}.\end{eqnarray}$$
Here
 $\mathscr{T}({\it\theta})$
has a bounded and continuous integrand expression and can therefore be accurately evaluated using the function sum from chebfun (for
 ${\it\theta}^{\prime }\approx {\it\theta}$
the integrand is represented in terms of a generalized series expansion), whereas
 $\mathscr{S}({\it\theta})$
can be computed analytically as
 $$\begin{eqnarray}\mathscr{S}({\it\theta})=\frac{\cos {\it\theta}}{2{\rm\pi}}\left[({\rm\pi}-{\it\theta})\,\ln ({\rm\pi}-{\it\theta})-{\it\theta}\,\ln {\it\theta}-{\rm\pi}\right],\quad {\it\theta}\in [0,{\rm\pi}].\end{eqnarray}$$
The entries of matrix
 $\unicode[STIX]{x1D63F}$
, corresponding to the last term in operator
 $\mathscr{L}$
, are defined as follows:
 $$\begin{eqnarray}\unicode[STIX]{x1D60B}_{jk}:=\mathscr{C}\,\int _{0}^{{\rm\pi}}I_{1}({\it\theta}_{j},{\it\theta}^{\prime })\cos k{\it\theta}^{\prime }\,\text{d}{\it\theta}^{\prime },\quad j,k=0,\ldots ,N-1,\end{eqnarray}$$
which represents the action of a weakly singular integral operator on trigonometric functions. In the light of the property (2.17c ), they are evaluated similarly to (3.9) by separating the singular part of the kernel. We thus obtain
 $$\begin{eqnarray}\displaystyle \int _{0}^{{\rm\pi}}I_{1}({\it\theta},{\it\theta}^{\prime })\cos (k{\it\theta}^{\prime })\,\text{d}{\it\theta}^{\prime } & =: & \displaystyle \underbrace{\int _{0}^{{\rm\pi}}\ln |{\it\theta}-{\it\theta}^{\prime }|\left[\frac{I_{1}({\it\theta},{\it\theta}^{\prime })}{\ln |{\it\theta}-{\it\theta}^{\prime }|}+\frac{\cos {\it\theta}}{2{\rm\pi}}\right]\cos k{\it\theta}^{\prime }\,\text{d}{\it\theta}^{\prime }}_{\mathscr{T}_{k}({\it\theta})}\nonumber\\ \displaystyle & & \displaystyle -\underbrace{\frac{\cos {\it\theta}}{2{\rm\pi}}\int _{0}^{{\rm\pi}}\ln |{\it\theta}-{\it\theta}^{\prime }|\cos k{\it\theta}^{\prime }\,\text{d}{\it\theta}^{\prime }}_{\mathscr{S}_{k}({\it\theta})}.\end{eqnarray}$$
Here
 $\mathscr{T}_{k}({\it\theta})$
has a bounded and continuous integrand expression and can therefore be accurately evaluated using the function sum from chebfun (for
 ${\it\theta}^{\prime }\approx {\it\theta}$
the integrand is represented in terms of a generalized series expansion). As regards
 $\mathscr{S}_{k}({\it\theta})$
, for
 $k=0$
, it is already given in (3.10). For
 $k>0$
, we obtain
 $$\begin{eqnarray}\displaystyle \int _{0}^{{\rm\pi}}\ln |{\it\theta}-{\it\theta}^{\prime }|\cos (k{\it\theta}^{\prime })\,\text{d}{\it\theta}^{\prime } & = & \displaystyle \frac{\text{i}}{2k}\{\!\text{e}^{\text{i}k{\it\theta}}[\mathscr{E}_{1}(\text{i}k{\it\theta})-\mathscr{E}_{1}(\text{i}k({\it\theta}-{\rm\pi}))+{\rm\pi}\text{i}]\nonumber\\ \displaystyle & & \displaystyle -\,\text{e}^{-\text{i}k{\it\theta}}[\mathscr{E}_{1}(-\text{i}k{\it\theta})-\mathscr{E}_{1}(\text{i}k({\rm\pi}-{\it\theta}))-{\rm\pi}\text{i}]\!\},\end{eqnarray}$$
where
 $\mathscr{E}_{1}(z)$
,
 $z\in \mathbb{C}$
, is the exponential integral defined as the complex extension of the function
 $\mathscr{E}_{1}(x):=\int _{x}^{\infty }(\text{e}^{-t}/t)\,\text{d}t$
,
 $x>0$
(Olver et al.
Reference Olver, Lozier, Boisvert and Clark2010). We note that, while the LHS of relation (3.13) is real-valued, it is evaluated in terms of a combination of complex-valued expressions. Since the exponential integral is multi-valued in the complex plane, care must be taken that its values used in (3.13) are taken from the same sheath.
The eigenvalue problem (3.5a
) needs to be restricted to eigenfunctions satisfying condition (3.5b
) and this is done with a projection approach. Defining
 $\boldsymbol{u}=[{\it\alpha}_{0},\ldots ,{\it\alpha}_{N-1}]^{\text{T}}$
and the matrix
 $\unicode[STIX]{x1D648}:=-\text{i}\,\unicode[STIX]{x1D63C}^{-1}(\unicode[STIX]{x1D63D}+\unicode[STIX]{x1D63E}+\unicode[STIX]{x1D63F})$
, equation (3.5a
) can be expressed as
 $$\begin{eqnarray}{\it\lambda}\,\boldsymbol{u}=\unicode[STIX]{x1D648}\,\boldsymbol{u}.\end{eqnarray}$$
Introducing operator
 $\boldsymbol{b}:\mathbb{R}^{N}\longrightarrow \mathbb{R}$
defined as
 $$\begin{eqnarray}\boldsymbol{b}=\left[2,~0,~-\frac{2}{3},~0,~-\frac{2}{15},~\ldots ,~-\frac{2}{(N-1)^{2}-1},~0\right],\end{eqnarray}$$
the constraint (3.5b
) can be expressed as
 $\boldsymbol{b}\boldsymbol{u}=0$
. The kernel space of this operator,
 $\mathscr{N}(\boldsymbol{b})$
, thus corresponds to the subspace of functions satisfying condition (3.5b
). The projection onto this subspace is realized by the operator
 $\mathscr{P}_{\!\!\mathscr{N}(\boldsymbol{b})}:=\unicode[STIX]{x1D644}-\boldsymbol{b}^{\dagger }\boldsymbol{b}$
, where
 $\unicode[STIX]{x1D644}$
is the
 $N\times N$
identity matrix and
 $\boldsymbol{b}^{\dagger }:=\boldsymbol{b}^{\text{T}}(\boldsymbol{b}\boldsymbol{b}^{\text{T}})^{-1}=\boldsymbol{b}^{\text{T}}/\Vert \boldsymbol{b}\Vert _{2}$
is the Moore–Penrose pseudo-inverse of the operator
 $\boldsymbol{b}$
(Laub Reference Laub2005). Defining the restricted variable
 $\boldsymbol{z}:=\mathscr{P}_{\!\!\mathscr{N}(\boldsymbol{b})}\,\boldsymbol{u}$
, problem (3.14) transforms to
 $$\begin{eqnarray}{\it\lambda}\,\boldsymbol{z}=\mathscr{P}_{\!\!\mathscr{N}(\boldsymbol{b})}\,\unicode[STIX]{x1D648}\,\mathscr{P}_{\!\!\mathscr{N}(\boldsymbol{b})}^{\dagger }\,\boldsymbol{z}=:\unicode[STIX]{x1D648}_{\boldsymbol{ b}}\,\boldsymbol{z},\end{eqnarray}$$
where
 $\mathscr{P}_{\!\!\mathscr{N}(\boldsymbol{b})}^{\dagger }$
is the Moore–Penrose pseudo-inverse of the projector
 $\mathscr{P}_{\!\!\mathscr{N}(\boldsymbol{b})}$
, which can now be solved using standard techniques. We note that the dimension of this problem is
 $N-1$
. An alternative approach to impose constraint (3.5b
) is to frame (3.5) as a generalized eigenvalue problem (Laub Reference Laub2005).
We now offer some comments about the accuracy and validation of the computational approach described above. The accuracy of approximation of singular integrals in (3.9) and (3.12) was tested by applying this approach to the integral operator in (2.2), which has the same singularity structure as
 $\mathscr{T}({\it\theta})$
in (3.9) and
 $\mathscr{T}_{k}({\it\theta})$
in (3.12), and for which an exact formula is available, cf. (1.3). In addition, an analogous test was conducted for the tangential velocity component given by
 $\mathscr{C}\,\boldsymbol{t}_{{\it\theta}}\boldsymbol{\cdot }[\int _{0}^{{\rm\pi}}\unicode[STIX]{x1D646}({\it\theta},{\it\theta}^{\prime })\,\text{d}{\it\theta}^{\prime }-W\,\boldsymbol{e}_{x}]$
. Using
 $\mathtt{maxLength}=10^{6}$
(which controls the length of the Chebyshev series in chebfun) resulted in
 $L_{\infty }$
errors of order
 $\mathit{O}(10^{-12})$
, which is close to the machine precision. The rather complicated analytical expression (3.13) used in
 $\mathscr{S}_{k}({\it\theta})$
, involving multi-valued functions with branch cuts in the complex plane, was validated by comparing it against a numerical approximation of the weakly singular integral defining
 $\mathscr{S}_{k}({\it\theta})$
. With the high precision of the numerical quadratures thus verified, the shape differentiation results in (2.11) were validated by comparing them against simple forward finite-difference approximations of the shape derivatives. For example, the consistency of the first term on the RHS in (2.11) was checked by comparing it (as a function of
 ${\it\theta}$
) to
 $$\begin{eqnarray}{\it\epsilon}^{-1}\,\mathscr{C}\,\left(\boldsymbol{n}_{\boldsymbol{ x}^{{\it\epsilon}}}-\boldsymbol{n}_{\boldsymbol{x}}\right)\boldsymbol{\cdot }\left[\int _{\partial \mathscr{A}}\unicode[STIX]{x1D646}(\boldsymbol{x}(t),\boldsymbol{x}^{\prime })\,\text{d}s_{\boldsymbol{ x}^{\prime }}-W\,\boldsymbol{e}_{x}\right]\end{eqnarray}$$
in the limit of vanishing
 ${\it\epsilon}$
. In the same spirit, the consistency of the second and third terms on the RHS of (2.11) was verified by perturbing the evaluation point
 $\boldsymbol{x}$
and the contour
 $\partial \mathscr{A}$
, respectively. We also checked computationally that the projection formulation (3.16) of the constrained eigenvalue problem (2.21) gives essentially the same results as its formulation in terms of a generalized eigenvalue problem (the former approach was in fact found to be somewhat more sensitive to round-off errors owing to the conditioning of the projection operator
 $\mathscr{P}_{\!\!\mathscr{N}(\boldsymbol{b})}$
). The algebraic eigenvalue problem was solved in Matlab with the QR and Cholesky methods producing essentially identical results.
Anticipating the results of § 4, we now introduce a regularized version of eigenvalue problem (3.16) in which it is ensured that the coefficients
 ${\it\alpha}_{k}$
decay with the wavenumber
 $k$
sufficiently rapidly, thus guaranteeing the required regularity of the eigenvectors
 $\boldsymbol{u}$
. We introduce the following diagonal operator acting as a low-pass filter:
 $$\begin{eqnarray}F_{jk}^{{\it\delta}}:=\left\{\begin{array}{@{}ll@{}}{\displaystyle \frac{1}{1+({\it\delta}\,k)^{2p}}}, & j=k,\\ 0, & j\neq k,\end{array}\right.\end{eqnarray}$$
where
 ${\it\delta}>0$
is the cut-off length scale and
 $p$
a positive integer, and define
 $\boldsymbol{z}^{{\it\delta}}:=\unicode[STIX]{x1D641}^{{\it\delta}}\,\boldsymbol{z}$
. This filter can be regarded as the discretization of the elliptic operator
 $[\text{Id}-(-1)^{p+1}{\it\delta}^{2p}\,\partial ^{2p}/\partial {\it\theta}^{2p}]^{-1}$
in the trigonometric basis. We then obtain from (3.16)
 $$\begin{eqnarray}{\it\lambda}\,\boldsymbol{z}^{{\it\delta}}=\unicode[STIX]{x1D641}^{{\it\delta}}\,\unicode[STIX]{x1D648}_{\boldsymbol{b}}\,(\unicode[STIX]{x1D641}^{{\it\delta}})^{-1}\,\boldsymbol{z}^{{\it\delta}}=:\unicode[STIX]{x1D648}_{\boldsymbol{ b}}^{{\it\delta}}\,\boldsymbol{z}^{{\it\delta}},\end{eqnarray}$$
from which the original problem is clearly recovered when
 ${\it\delta}\rightarrow 0$
. The regularized eigenvectors
 $\boldsymbol{u}^{{\it\delta}}$
corresponding to
 $\boldsymbol{z}^{{\it\delta}}$
are therefore guaranteed to be smoother than the original eigenvectors
 $\boldsymbol{u}$
(the actual improvement of smoothness depends on the value of
 $p$
). In the next section, among other results, we will study the behaviour of solutions to eigenvalue problem (3.19) for a decreasing sequence of regularization parameters
 ${\it\delta}$
.
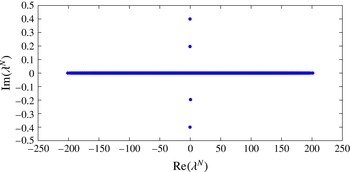
Eigenvalue spectrum of problem (3.19) obtained with
 $N=1024$
and
 ${\it\delta}=1/32$
.

4 Computational results
In this section we first summarize the numerical parameters used in the computations and then present the results obtained by solving eigenvalue problem (3.19) for different values of the regularization parameter
 ${\it\delta}$
. All computations were conducted setting
 $p=4$
in the regularization operator (3.18) and using the resolutions
 $N=64,128,256,512,1024$
in (3.1). We allowed the regularization parameter to take a wide range of values
 ${\it\delta}=1,1/2,1/4,\ldots ,1/1024$
. We note that, with the smallest values from this range, regularization barely affects the eigenvalue problem (3.19) even when the highest resolutions are used. Therefore, these values may be considered small enough to effectively correspond to the limit
 ${\it\delta}\rightarrow 0$
.
In our analysis below we will first demonstrate that, for a fixed parameter
 ${\it\delta}$
, the solutions of the regularized problem (3.19) converge as the numerical resolution
 $N$
is refined. Then, we will study the behaviour of the eigenvalues and eigenfunctions as the regularization parameter
 ${\it\delta}$
is reduced. A typical eigenvalue spectrum obtained by solving problem (3.19) is shown in figure 1. The fact that the spectrum is symmetric with respect to the lines
 $\text{Re}({\it\lambda})=0$
and
 $\text{Im}({\it\lambda})=0$
reflects the Hamiltonian structure of the problem. Given the ansatz for the perturbations introduced in § 2, eigenvalues with negative imaginary parts correspond to linearly unstable eigenmodes, and we see in figure 1 that there are two such eigenvalues in addition to two eigenvalues associated with linearly stable eigenmodes. We will refer to the eigenvalues with the larger and the smaller magnitudes as the first and the second, respectively. In addition to these four purely imaginary eigenvalues, there is also a large number of purely real eigenvalues covering a segment of the axis
 $\text{Im}({\it\lambda})=0$
, which can be interpreted as the continuous spectrum. The spectrum shown in figure 1 was found to be essentially independent of the regularization parameter
 ${\it\delta}$
, and its dependence on the numerical resolution
 $N$
is discussed below. In this analysis we will set
 ${\it\delta}=1/32$
.
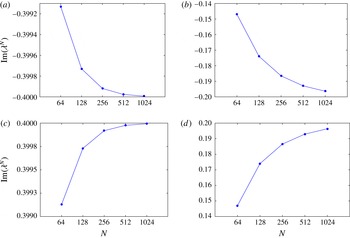
Dependence of the four purely imaginary eigenvalues on the resolution
 $N$
with a fixed regularization parameter
 ${\it\delta}=1/32$
. The eigenvalues shown in (a) and (b) correspond to the two unstable eigenmodes, whereas those shown in (c) and (d) correspond to the two stable eigenmodes.

The dependence of the four purely imaginary eigenvalues on the resolution
 $N$
is shown in figure 2(a–d), where we see that the eigenvalues all converge to well-defined limits. However, as will be discussed below, problem (3.5) does not admit smooth solutions (eigenvectors) and therefore the convergence of eigenvalues
 ${\it\lambda}^{N}$
with
 $N$
is only algebraic rather than spectral. Thus, the numerical approximation error for an eigenvalue
 ${\it\lambda}$
can be represented as
 $|{\it\lambda}^{N}-{\it\lambda}|=cN^{{\it\beta}}$
for some
 $c>0$
and
 ${\it\beta}<0$
. Using the data from figure 2 to evaluate
 $({\it\lambda}^{N}-{\it\lambda}^{2N})$
as a function of the resolution
 $N$
, one can estimate the order of convergence using a least-squares fit as
 ${\it\beta}\approx -1.72$
for the first eigenvalue (both stable and unstable) and
 ${\it\beta}\approx -0.99$
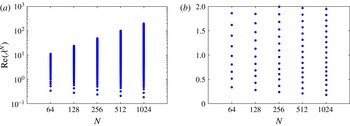
for the second (both stable and unstable). This confirms that the first eigenvalues converge much faster than the second. The dependence of the purely real eigenvalues on the resolution
 $N$
is illustrated in figure 3(a,b). First of all, we notice that the purely real eigenvalues do not appear to converge to any particular limit as
 $N$
is increased and instead fill an interval of the axis
 $\text{Im}({\it\lambda})=0$
with increasing density (figure 3
b). From figure 3(a) we can infer that the lower and upper bounds of this interval approximately scale with the resolution as
 $$\begin{eqnarray}\min _{i}\left[|\text{Re}({\it\lambda}_{i}^{N})|\right]\sim N^{-0.22}\quad \text{and}\quad \max _{i}\left[|\text{Re}({\it\lambda}_{i}^{N})|\right]\sim N^{1.04},\quad i=1,\ldots ,N,\end{eqnarray}$$
where
 ${\it\lambda}_{i}^{N}$
denotes the
 $i$
th eigenvalue computed with the resolution
 $N$
. All these observations allow us to conclude that the continuous eigenvalue problem (2.21) has four purely imaginary eigenvalues and a continuous spectrum coinciding with the axis
 $\text{Im}({\it\lambda})=0$
.
Dependence of the purely real eigenvalues on the resolution
 $N$
with a fixed regularization parameter
 ${\it\delta}=1/32$
plotted (a) using the logarithmic scale and (b) within the interval
 $[0,2]$
using the linear scale for the vertical axis. For clarity, only the eigenvalues with positive real parts (
 $\text{Re}({\it\lambda}_{i}^{N})>0$
) are shown.

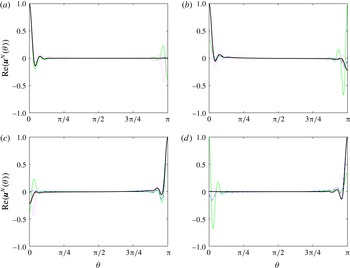
We now move on to discuss the eigenvectors corresponding to the purely imaginary eigenvalues. The linearly unstable and stable eigenvectors are shown as functions of the polar angle
 ${\it\theta}$
for different resolutions
 $N$
in figure 4(a–d). In this figure we only show the real parts of the eigenvectors, since, given our ansatz (2.20) for the perturbation, the imaginary parts do not play any role when the eigenvalues are purely imaginary. Hence, below, the term ‘eigenvector’ will refer to
 $\text{Re}(\boldsymbol{u}^{N}({\it\theta}))$
. We note that, as the resolution
 $N$
increases, the unstable and stable eigenvectors associated with a given eigenvalue become reflections of each other with respect to the midpoint
 ${\it\theta}={\rm\pi}/2$
, with the unstable eigenvectors exhibiting a localized peak near the rear stagnation point (
 ${\it\theta}=0$
) and the stable eigenvectors exhibiting such a peak near the front stagnation point (
 ${\it\theta}={\rm\pi}$
). In figure 4(a–d) we also observe that, for a fixed regularization parameter
 ${\it\delta}$
, the numerical approximations
 $\text{Re}(\boldsymbol{u}^{N}({\it\theta}))$
of eigenfunctions converge uniformly in
 ${\it\theta}$
for increasing
 $N$
, although this convergence is significantly slower for points
 ${\it\theta}$
close to the endpoint opposite to where the eigenvector exhibits a peak. We remark that the same behaviour of spectral approximations to eigenfunctions was also observed by Rozi (Reference Rozi1999). The two unstable eigenvectors
 $\text{Re}(\boldsymbol{u}_{1}^{N})$
and
 $\text{Re}(\boldsymbol{u}_{2}^{N})$
are strongly non-normal, with
 $\langle \,\text{Re}(\boldsymbol{u}_{1}^{N}),\text{Re}(\boldsymbol{u}_{2}^{N})\,\rangle _{L_{2}}/(\Vert \text{Re}(\boldsymbol{u}_{1}^{N})\Vert _{L_{2}}\Vert \text{Re}(\boldsymbol{u}_{2}^{N})\Vert _{L_{2}})\approx 0.96$
, where
 $\langle \cdot ,\cdot \rangle _{L_{2}}$
and
 $\Vert \cdot \Vert _{L_{2}}$
are, respectively, the inner product and the norm in the space
 $L_{2}(0,{\rm\pi})$
, when
 ${\it\delta}=1/32$
and
 $N=1024$
. Consequently, the two unstable eigenvectors appear quite similar as functions of
 ${\it\theta}$
, especially near the peak (cf. figure 4
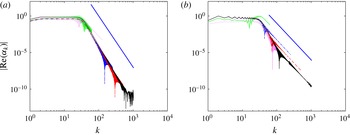
a,b). On the other hand, the Fourier spectra of their expansion coefficients shown in figure 5(a,b) exhibit quite distinct properties. More specifically, we see that the slope of the Fourier spectra for
 $k>1/{\it\delta}$
is quite different in the two cases: it is close to
 $-7$
and
 $-5$
for the eigenvectors associated with, respectively, the first and second eigenvalue. We emphasize however that the specific slopes are determined by the choice of the parameter
 $p$
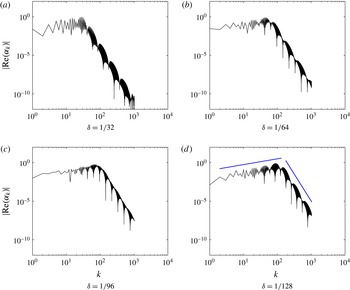
in the regularizing operator (3.18) and here we are interested in the relative difference of the slopes in the two cases. Further distinctions between the eigenvectors associated with the first and the second eigenvalue will be elucidated below when discussing their behaviour in the limit of decreasing regularization parameter
 ${\it\delta}$
.
Unstable eigenvectors corresponding to the first (a) and second (b) eigenvalue, and stable eigenvectors corresponding to the first (c) and second (d) eigenvalue for different resolutions:
 $N=64$
(green solid line),
 $N=128$
(magenta dotted line),
 $N=256$
(blue dash-dotted line),
 $N=512$
(red dashed line) and
 $N=1024$
(thick black solid line) with
 ${\it\delta}=1/32$
. The eigenvectors are normalized such that
 $\sup _{{\it\theta}\in [0,{\rm\pi}]}|\text{Re}(\boldsymbol{u}^{N}({\it\theta}))|=1$
.

Fourier coefficient spectra
 $|\text{Re}({\it\alpha}_{k})|$
,
 $k=1,\ldots ,N$
, characterizing the eigenvectors associated with the first (a) and the second (b) eigenvalue for different resolutions:
 $N=64$
(green solid line),
 $N=128$
(magenta dotted line),
 $N=256$
(blue dash-dotted line),
 $N=512$
(red dashed line) and
 $N=1024$
(thick black solid line). The spectra of the stable and unstable eigenvectors corresponding to eigenvalues with the same magnitude are identical. The straight blue solid lines show the slopes of
 $-7$
(a) and
 $-5$
(b).

Dependence of the unstable eigenvectors associated with the first (black solid line) and the second (red dashed line) eigenvalue on the polar angle
 ${\it\theta}$
near the rear (a) and the front (b) stagnation point for different values of the regularization parameter
 ${\it\delta}=1/32,1/64,1/96,1/128$
with
 $N=1024$
(smaller values of
 ${\it\delta}$
correspond to more localized eigenvectors). The eigenvectors are normalized such that
 $\sup _{{\it\theta}\in [0,{\rm\pi}]}|\text{Re}(\boldsymbol{u}^{N}({\it\theta}))|=1$
.

Having established the convergence of the numerical approximations of the eigenfunctions with the resolution
 $N$
for a fixed regularization parameter
 ${\it\delta}$
, we now go on to characterize their behaviour when
 ${\it\delta}$
is decreased. Unless indicated otherwise, the results presented below were obtained with the resolution
 $N=1024$
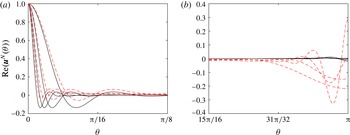
. In figure 6(a,b) we show the behaviour of the two unstable eigenvectors near the rear and front stagnation points for different values of the regularization parameter
 ${\it\delta}$
. We see that, as this parameter is decreased, the peak near the rear stagnation point (figure 6
a) becomes steeper and more localized, especially for the eigenvector associated with the first eigenvalue. Likewise, the oscillation of the unstable eigenvectors near the front stagnation point (figure 6
b) also becomes more intense and localized as
 ${\it\delta}$
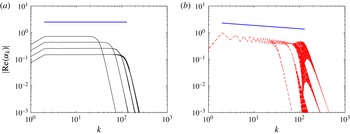
decreases, although this effect is more pronounced in the case of the eigenvector corresponding to the second eigenvalue. These properties are further characterized in the plots of the Fourier spectra of the two eigenvectors shown in figure 7(a,b) for different values of the regularization parameter
 ${\it\delta}$
. In these plots it is clear that, as the regularization effect vanishes (corresponding to decreasing values of
 ${\it\delta}$
), the point where the slope of the spectrum changes moves towards larger wavenumbers
 $k$
. For
 $k<1/{\it\delta}$
the approximate slopes of the coefficient spectra are, respectively,
 $0$
and
 $-1/8$
for the eigenvectors associated with the first and second eigenvalue (this difference of slopes may explain the different behaviours in the physical space already observed in figure 6(b)). Extrapolating from the trends evident in figure 7(a,b) it can be expected that these slopes will remain unchanged in the limit
 ${\it\delta}\rightarrow 0$
. With this behaviour of the Fourier coefficients, involving no decay at all for the first eigenvector and a slow decay for the second, expansion (3.1) does not converge in the limit of
 $N\rightarrow \infty$
, indicating that the stable and unstable eigenvectors do not have the form of smooth functions, but rather are ‘distributions’. As regards the nature of their singularity, the slopes observed in figure 7(a,b), i.e.
 $0$
and
 $-1/8$
, indicate that the eigenvector associated with the first eigenvalue is consistent with the Dirac delta (whose spectral slope is also 0), whereas the eigenvector associated with the second eigenvalue is intermediate between the Dirac delta and the Heaviside step function (whose spectral slope is
 $-1$
).
Fourier coefficient spectra
 $|\text{Re}({\it\alpha}_{k})|$
,
 $k=1,\ldots ,N$
, of the eigenvectors associated with the first (a) and second (b) eigenvalue for different values of the regularization parameter
 ${\it\delta}=1/32,1/64,1/96,1/128$
with
 $N=1024$
(smaller values of
 ${\it\delta}$
correspond to the plateau in
 $|\text{Re}({\it\alpha}_{k})|$
extending to larger wavenumbers). The straight blue solid lines represent the slopes of
 $0$
(a) and
 $-1/8$
(b).

Finally, we go on to discuss the eigenvectors associated with the purely real eigenvalues forming the continuous part of the spectrum. Since, as demonstrated in figure 3, for increasing resolutions
 $N$
different eigenvalues are actually computed in the continuous spectrum, there is no sense of convergence with
 $N$
. We will therefore analyse here the effect of decreasing the regularization parameter
 ${\it\delta}$
at a fixed resolution
 $N=1024$
. As above, we will focus on the real parts of the eigenvectors (with the imaginary parts having similar properties). To fix attention, we consider the neutrally stable eigenvector associated with the eigenvalue
 ${\it\lambda}\approx 1.0502$
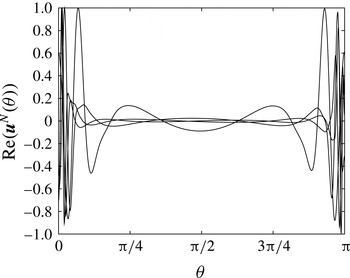
. In figure 8 we show the dependence of
 $\text{Re}(\boldsymbol{u}^{N}({\it\theta}))$
on the polar angle
 ${\it\theta}$
with
 $N=1024$
and for different values of the regularization parameter
 ${\it\delta}$
. We observe that, as
 ${\it\delta}$
decreases, the oscillations move away from the centre of the domain
 $[0,{\rm\pi}]$
towards the endpoints. The number of oscillations, however, remains approximately constant. The corresponding Fourier coefficient spectra are shown in figure 9(a–d). We see in these plots that the Fourier coefficients increase with
 $k$
as
 $|\text{Re}({\it\alpha}_{k})|\sim k^{3/4}$
when
 $k<1/{\it\delta}$
, which demonstrates that the neutrally stable eigenvectors are actually more singular objects than the stable and unstable eigenvectors discussed above. We note that, in the regularized regime (i.e. for
 $k>1/{\it\delta}$
), the Fourier coefficient spectrum of the neutrally stable eigenvectors vanishes with the slope of
 $-7$
(see figure 9
d). Extrapolating from the trends evident in figures 8 and 9 to the limit
 ${\it\delta}\rightarrow 0$
, we can anticipate that the neutrally stable eigenfunctions will have the form of a finite number of oscillations localized in an infinitesimal neighbourhood of the stagnation points
 ${\it\theta}=0$
and
 ${\it\theta}={\rm\pi}$
. The number of these oscillations appears to be an increasing function of the eigenvalue magnitude
 $|{\it\lambda}|$
.
Real part of the neutrally stable eigenvector corresponding to the eigenvalue
 ${\it\lambda}\approx 1.0502$
computed with the resolution
 $N=1024$
and with different values of the regularization parameter
 ${\it\delta}=1/32,1/64,1/96,1/128$
(smaller values of
 ${\it\delta}$
correspond to
 $\text{Re}(\boldsymbol{u}^{N}({\it\theta}))$
exhibiting oscillations closer to the endpoints of the domain). The eigenvectors are normalized such that
 $\sup _{{\it\theta}\in [0,{\rm\pi}]}|\text{Re}(\boldsymbol{u}^{N}({\it\theta}))|=1$
.

Fourier coefficient spectra
 $|\text{Re}({\it\alpha}_{k})|$
,
 $k=1,\ldots ,N$
, of the neutrally stable eigenvectors
 $\boldsymbol{u}^{N}$
shown in figure 8 for the indicated values of the regularization parameter
 ${\it\delta}$
. In (d) the blue solid lines represent the slopes of
 $3/4$
and
 $-7$
, respectively, for
 $k<1/{\it\delta}$
and for
 $k>1/{\it\delta}$
.

5 Discussion
In this section we first provide a simple argument to justify the numerical results obtained in § 4 and then make some comparisons with the results of earlier studies. Some properties of the eigenvectors discussed in § 4 are consequences of the ‘degeneracy’ of the stability operator (2.13a
). More specifically, knowing the streamfunction field (1.3) characterizing Hill’s vortex, the coefficient of the derivative term on the RHS in (2.13a
) can be expressed as
 $\boldsymbol{v}_{0}\boldsymbol{\cdot }\boldsymbol{t}_{{\it\theta}}=(\mathscr{C}a^{2}/5)\sin {\it\theta}$
, which vanishes at the endpoints
 ${\it\theta}=0,{\rm\pi}$
. To illustrate the effect of this degeneracy we will consider a simplified model problem obtained from (2.21a
) by dropping the integral terms and rescaling the coefficients, so that we obtain
 $$\begin{eqnarray}\text{i}{\it\lambda}\,w({\it\theta})=\sin {\it\theta}\frac{\text{d}w({\it\theta})}{\text{d}{\it\theta}},\quad {\it\theta}\in [0,{\rm\pi}],\end{eqnarray}$$
for some
 $w({\it\theta})$
. We now perform a change of variables
 $s=s({\it\theta})$
defined through
 $\text{d}s=\text{d}{\it\theta}/\sin {\it\theta}$
, so that
 $$\begin{eqnarray}s({\it\theta})=\int _{{\rm\pi}/2}^{{\it\theta}}\frac{\text{d}{\it\theta}^{\prime }}{\sin {\it\theta}^{\prime }}=\ln (\csc {\it\theta}-\cot {\it\theta}),\end{eqnarray}$$
where the lower integration bound was chosen to make the transformation antisymmetric with respect to the midpoint of the interval
 $[0,{\rm\pi}]$
. Transformation (5.2) has the properties
 $\lim _{{\it\theta}\rightarrow 0}s({\it\theta})=-\infty$
and
 $\lim _{{\it\theta}\rightarrow {\rm\pi}}s({\it\theta})=+\infty$
, such that it represents a one-to-one map from the interval
 $[0,{\rm\pi}]$
to the real line. Introducing this change of variables in (5.1), we obtain
 $$\begin{eqnarray}\text{i}{\it\lambda}\,w(s)=\sin {\it\theta}\frac{\text{d}w(s)}{\sin {\it\theta}\,\text{d}s}=\frac{\text{d}w(s)}{\text{d}s},\quad s\in \mathbb{R}.\end{eqnarray}$$
It then follows from (5.2) and (5.3) that (5.1) admits a continuous spectrum coinciding with the entire complex plane
 ${\it\lambda}\in \mathbb{C}$
with the eigenfunctions given by
 $w({\it\theta})=\text{e}^{\text{i}{\it\lambda}s({\it\theta})}$
. When the eigenvalues are restricted to the real line
 ${\it\lambda}={\it\lambda}_{re}\in \mathbb{R}$
, the corresponding eigenfunctions
 $w({\it\theta})$
exhibit oscillations with wavelengths decreasing as
 ${\it\theta}\rightarrow 0,{\rm\pi}$
, as was also observed in § 4 for the neutrally stable modes (cf. figure 8). On the other hand, for purely imaginary eigenvalues
 ${\it\lambda}=\text{i}{\it\lambda}_{im}$
, where
 ${\it\lambda}_{im}\in \mathbb{R}$
, the corresponding eigenfunctions take the form
 $w({\it\theta})=(\csc {\it\theta}-\cot {\it\theta})^{-{\it\lambda}_{im}}$
, which for
 ${\it\lambda}_{im}<0$
has the properties
 $\lim _{{\it\theta}\rightarrow 0^{+}}w({\it\theta})=\infty$
and
 $\lim _{{\it\theta}\rightarrow {\rm\pi}^{-}}w({\it\theta})=0$
consistent with the singular behaviour of the unstable eigenmodes observed in § 4 (cf. figures 4 and 6). Thus, one can conclude that the singular structure of the eigenvectors is a consequence of the degeneracy of the coefficient in front of the derivative term in (2.13a
) and some qualitative insights about this issue can be deduced based on the simplified problem (5.1). We add that similar problems are known to arise in hydrodynamic stability, for example, in the context of the inviscid Rayleigh equation describing the stability of plane parallel flows (Schmid & Hennigson Reference Schmid and Hennigson2001). In that problem, however, the singularity appears inside the domain, giving rise to critical layers with locations dependent on the eigenvalues.
We now return to a remark made in the introduction, namely, that Hill’s vortices represent a one-parameter family of solutions parametrized by the constant
 $\mathscr{C}$
, or equivalently by the translation velocity
 $W$
, cf. (1.4). We remark that the stability operator defined in (2.13a
) is linear in
 $\mathscr{C}$
, which implies that eigenvalues
 ${\it\lambda}$
(and hence also the growth rates) will be proportional to
 $\mathscr{C}$
(or
 $W$
). This is also consistent with the observations made by Moffatt & Moore (Reference Moffatt and Moore1978).
Next we compare our findings with the results of Moffatt & Moore (Reference Moffatt and Moore1978), which concerned essentially the same problem. We remark that these results were verified computationally by Pozrikidis (Reference Pozrikidis1986). The exponential growth rate of the unstable perturbations predicted by Moffatt & Moore (Reference Moffatt and Moore1978) was (using our present notation)
 $-3W/a=6/15=0.4$
, which is in excellent agreement with the first unstable eigenvalue found here (cf. figure 2
a). Similar agreement was found as regards the structure of the most unstable perturbation – Moffatt & Moore (Reference Moffatt and Moore1978) also found it to have the form of a localized spike at the rear stagnation point (the fact that this spike had a finite width seems related to the truncation of the infinite system of ordinary differential equations). It appears that the second unstable mode, cf. figure 4(b), was undetected by the analysis of Moffatt & Moore (Reference Moffatt and Moore1978) due to its smaller growth rate, cf. figure 2(b).
To close this section, we comment on the continuous part of the spectrum, which was reported in § 4, cf. figures 1 and 3. Such continuous spectra often appear in the study of infinite-dimensional Hamiltonian, or more generally non-self-adjoint systems, where non-trivial effects may arise from its interaction with the discrete spectrum (Weinstein Reference Weinstein, Hasselblatt and Katok2006). In the present problem, however, the results of Moffatt & Moore (Reference Moffatt and Moore1978) and Pozrikidis (Reference Pozrikidis1986) indicate that the observed instability has the form of a purely modal growth, which can be completely explained in terms of the discrete spectrum and the associated eigenfunctions. Moreover, this is confirmed by the very good agreement between the growth rate of the instability determined by Moffatt & Moore (Reference Moffatt and Moore1978) and the value of the first unstable eigenvalue obtained in our study. These observations thus allow us to conclude that there is no evidence for any role that the continuous spectrum might play in the observed instability mechanism.
6 Conclusions
In this study we have considered the linear stability of Hill’s vortex with respect to axisymmetric circulation-preserving perturbations. This was done using the systematic approach of Elcrat & Protas (Reference Elcrat and Protas2013) to obtain an eigenvalue problem characterizing the linearized evolution of perturbations to the shape of the vortex boundary. Recognizing that the Euler equation describing the evolution of discontinuous vorticity distributions gives rise to a free-boundary problem, our approach was based on shape differentiation of the contour-dynamics formulation in the 3D axisymmetric geometry (Shariff et al.
Reference Shariff, Leonard and Ferziger2008). As such, it did not involve the simplifications invoked in the earlier studies of this problem by Moffatt & Moore (Reference Moffatt and Moore1978), Fukuyu et al. (Reference Fukuyu, Ruzi and Kanai1994) and Rozi (Reference Rozi1999), which were related to, for example, only approximate satisfaction of the kinematic conditions on the vortex boundary. The resulting singular integro-differential operator was approximated with a spectral method in which the integral expressions were evaluated analytically and using chebfun. We considered a sequence of regularized eigenvalue problems (3.19) featuring smooth eigenfunctions for which the convergence of the numerical approximation was established. Then, the original problem was recovered in the limit of vanishing regularization parameter
 ${\it\delta}$
. Since in the limit
 ${\it\delta}\rightarrow 0$
the eigenfunctions were found to be distributions, the convergence of this approach with the resolution
 $N$
was not very fast, but it did provide a precise characterization of their regularity in terms of the rate of decay of the Fourier coefficients in expansion (3.1). Following this procedure we showed that the stability operator has four purely imaginary eigenvalues, associated with two unstable and two stable eigenmodes, in addition to a continuous spectrum of purely real eigenvalues associated with neutrally stable eigenmodes. The two unstable eigenmodes are distributions in the form of infinitely sharp peaks localized at the rear stagnation point and differ by their degree of singularity. The stable eigenmodes have the form of similar peaks localized at the front stagnation point. On the other hand, the neutrally stable eigenvectors have the form of ‘wiggles’ concentrated in a vanishing neighbourhood of the two stagnation points, with the number of oscillations increasing with the eigenvalue magnitude
 $|{\it\lambda}|$
.
Our results are consistent with the findings from the earlier studies of this problem by Moffatt & Moore (Reference Moffatt and Moore1978), Fukuyu et al. (Reference Fukuyu, Ruzi and Kanai1994) and Rozi (Reference Rozi1999). We emphasize that these earlier studies did not, however, solve the complete linear stability problem, and only considered the linearized evolution of some prescribed initial perturbation (they can therefore be regarded as evaluating the action of an operator (matrix) on a vector, rather than determining all of its eigenvalues and eigenvectors). These studies did conclude that initial perturbations evolve towards a sharp peak concentrated near the rear stagnation point. Thus, our present findings may be interpreted as sharpening the results of these earlier studies. In particular, excellent agreement was found with the growth rate of the unstable perturbations found by Moffatt & Moore (Reference Moffatt and Moore1978).
The findings of the present study lead to some intriguing questions concerning the initial-value problem for the evolution of Hill’s vortex with a perturbed boundary. It appears that, in the continuous setting without any regularization, this problem may not be well posed, in the sense that, for generic initial perturbations, the vortex boundary may exhibit the same poor regularity as observed for the unstable eigenvectors in § 4 (i.e. be at least discontinuous). While it is possible that the nonlinearity might exert some regularizing effect, this is an aspect of the problem that should be taken into account in its numerical solution. A standard numerical approach to the solution of such problems is the axisymmetric version of the ‘contour dynamics’ method (Pozrikidis Reference Pozrikidis1986; Wakelin & Riley Reference Wakelin and Riley1996; Shariff et al. Reference Shariff, Leonard and Ferziger2008) in which the discretization of the contour boundary with straight segments or circular arcs combined with an approximation of the singular integrals provides the required regularizing effect. On the other hand, the singular structure of the solution can be captured more readily with higher-order methods, such as the spectral approach developed here.
There are a number of related problems that deserve attention and will be considered in the near future. A natural extension of the questions addressed here is to investigate the stability of Hill’s vortex with respect to non-axisymmetric perturbations, as already explored by Fukuyu et al. (Reference Fukuyu, Ruzi and Kanai1994) and Rozi (Reference Rozi1999). Another interesting question is to consider the effect of swirl (Moffatt Reference Moffatt1969; Hattori & Hijiya Reference Hattori and Hijiya2010). Hill’s vortex is a member of the Norbury–Fraenkel family of inviscid vortex rings and their stability remains an open problem. It was argued by Moffatt & Moore (Reference Moffatt and Moore1978) that the highly localized nature of the boundary response of Hill’s vortex to perturbations is a consequence of the presence of a stagnation point. Since the Norbury–Fraenkel vortices other than Hill’s vortex do not feature stagnation points on the vortex boundary, it may be conjectured that in those cases eigenfunctions of the stability operator will be smooth functions of the arclength coordinate. Therefore, in the context of the linear stability problem, the family of the Norbury–Fraenkel vortex rings may be regarded as a ‘regularization’ of Hill’s vortex analogous and alternative to our approach developed in § 3, cf. (3.18)–(3.19). The different problems mentioned in this paragraph, except for the effect of swirl, can be investigated using the approach developed by Elcrat & Protas (Reference Elcrat and Protas2013) and also employed in the present study. As regards the stability of Hill’s vortex with swirl, the difficulty stems from the fact that, to the best of our knowledge, there is currently no vortex-dynamics formulation of the type (2.1) available for axisymmetric flows with swirl. Our next step will be to analyse the stability of the Norbury–Fraenkel vortex rings to axisymmetric perturbations. Finally, it will also be interesting to compare the present findings with the results of the short-wavelength stability analysis of Hattori & Hijiya (Reference Hattori and Hijiya2010). In particular, one would like to know if there is any overlap between the two stability analyses and, if so, whether they can produce comparable predictions of the growth rates.
Acknowledgements
The authors are grateful to T. Driscoll for helpful advice on a number of chebfun-related issues and to D. Pelinovsky for his comments on the singular structure of the eigenfunctions. The anonymous referees provided constructive comments that helped us to improve the paper. B.P. acknowledges the support through an NSERC (Canada) Discovery grant. Alan Elcrat, who passed away on 20 December 2013, played a key role in the early stages of this study, but did not live to see the final version of the manuscript.