







1. Introduction
The effect of throughflow was first investigated theoretically in the mid-twentieth century (see Bussmann & Münz Reference Bussmann and Münz1942; Pretsch Reference Pretsch1942; Schlichting & Bußmann Reference Schlichting and Bußmann1943) and the findings of these initial papers are summarised and amended by Chiarulli & Freeman (Reference Chiarulli and Freeman1948). This work resulted in the discovery, and subsequent linear stability analysis, of the asymptotic suction profile and provided the first analytic indication that throughflow has potentially stabilising effects.
Throughflow occurs naturally when a fluid flows over a porous media such as a river bed. This drastically changes characteristics such as the velocity profile of the river (Chen & Chiew Reference Chen and Chiew2004) and sediment transport (Cao & Chiew Reference Cao and Chiew2014). Modelling such a system requires an additional equation of motion such as Darcy's law describing how the flow responds to its porous surroundings (see for example Deng & Martinez Reference Deng and Martinez2005).
Throughflow can also be added to a system intentionally as a control method for maintaining a laminar boundary layer. Experimental studies have shown that suction leads to a decrease in skin friction on an aerofoil (Braslow et al. Reference Braslow, Burrows, Tetervin and Visconti1951; Hwang Reference Hwang1997), which would improve a plane's fuel efficiency by reducing the drag on its wings. More recent studies (Koepp et al. Reference Koepp, Atzori, Rezaei, Jansson, Vinuesa, Laure, Schlatter and Weinkauf2020) have used sophisticated numerical simulations and found similar results. Other applications include cooling a turbine's blades (Zhou et al. Reference Zhou, Li, Wang, Xie and You2019) and reducing drag due to wind on high-rise buildings (Zheng & Zhang Reference Zheng and Zhang2012). In each of these applications, suction is induced by creating small slits through which throughflow is generated.
For this paper, we will use the following definition of throughflow. Given a fluid moving according to some base flow, throughflow and suction are both used to refer to a second flow component that acts perpendicular to the direction of the base flow. For the channel flows we will consider, throughflow will be induced by injecting fluid through a porous lower wall and extracting it out of a porous upper wall. While the rate of this injection and extraction need not be constant, this paper will focus on the case where these effects happen at the same rate, leading to a throughflow of constant velocity. The motion through these walls will not be modelled. Instead, we apply no slip and no additional penetration, excluding the throughflow itself.
To analyse this control method, we concentrate on the simplest possible shear flow, namely plane Couette flow. It is well known that in the absence of throughflow, plane Couette flow is linearly stable at all Reynolds numbers  $\textit {Re}$ (Romanov Reference Romanov1973). However, it has also been experimentally observed to be unstable at finite
 $\textit {Re}$ (Tillmark & Alfredsson Reference Tillmark and Alfredsson1992). Three-dimensional plane Couette flow was first shown to have finite-amplitude solutions by Nagata (Reference Nagata1990) and subsequently many researchers have computed solutions with various symmetries. The physical mechanism underlying these nonlinear solutions is the theory of self-sustaining processes (SSPs), described by Hamilton, Kim & Waleffe (Reference Hamilton, Kim and Waleffe1995) and Waleffe (Reference Waleffe1997). These structures are generated by a nonlinear interaction between streamwise streaks, spanwise rolls and travelling waves propagating in the streamwise direction. For a detailed discussion of these processes, see Ruban, Gajjar & Walton (Reference Ruban, Gajjar and Walton2023). Such a construction is an inherently three-dimensional process and, while the effect of throughflow on those solutions is undoubtedly of interest, we will concentrate here on nonlinear solutions arising purely from two-dimensional effects, as a first step in understanding the nonlinear stability of this flow.
The analytic portion of our investigation is concerned with identifying a nonlinear travelling wave structure valid at asymptotically large  $\textit {Re}$. This structure is self-sustaining, not by the roll/streak/wave interaction referred to above, but rather by an intricate interaction between the viscous wall layers and a strongly nonlinear internal critical layer located where the streamwise component of the base flow is equal to the phase velocity of the travelling wave. The theory describing such a critical layer was developed by Benney & Bergeron (Reference Benney and Bergeron1969), Haberman (Reference Haberman1972) and Smith & Bodonyi (Reference Smith and Bodonyi1982b) in the context of boundary-layer flows. It was found that the
 $\mathit {O}(1)$ phase shift across a linear critical layer (Lin Reference Lin1955; Stuart Reference Stuart1963) becomes asymptotically small as the disturbance's amplitude increases. This nonlinear theory has successfully been used to identify coherent structures in many flows and these solutions have been shown to agree quantitatively with finite
 $\textit {Re}$ nonlinear travelling wave solutions to the Navier–Stokes equations. Examples include Hagen–Poiseuille flow (analytic work by Smith & Bodonyi (Reference Smith and Bodonyi1982a) and numerical work by Deguchi & Walton Reference Deguchi and Walton2013b), plane Poiseuille flow (Deguchi & Walton Reference Deguchi and Walton2018) and annular sliding Couette flow (Deguchi & Walton Reference Deguchi and Walton2013a).
There have previously been several studies concerned with how throughflow affects the linear stability of channel flows. The earliest examples are analyses of plane Poiseuille flow (Sheppard Reference Sheppard1972; Fransson & Alfredsson Reference Fransson and Alfredsson2003), which found throughflow to be strictly stabilising. The effect of throughflow on Couette–Poiseuille flow has also been investigated in the special case where the pressure gradient is chosen to ensure the base flow profile remains linear (Nicoud & Angilella Reference Nicoud and Angilella1997). This study found that throughflow was destabilising at low throughflow speeds but stabilising at large speeds. Recently, multiple studies have analysed the linear stability of Couette flow with throughflow. Shankar & Shivakumara (Reference Shankar and Shivakumara2021) modelled the porous walls using the Brinkman-extended Darcy equation, while Sun, Yalcin & Oberlack (Reference Sun, Yalcin and Oberlack2024) focused solely on the motion within the channel. Sun et al. (Reference Sun, Yalcin and Oberlack2024) used an analytic solution to the modified Orr–Sommerfeld equation in terms of hypergeometric functions to find linear neutral curves for sufficiently strong throughflow numbers.
The remainder of this paper is structured as follows. In § 2, the precise problem and base flow in question are described. Section 3 focuses on the linear stability analysis, building upon the results of Sun et al. (Reference Sun, Yalcin and Oberlack2024), discussing both the relevant linear stability properties of this flow and how at large  $\textit {Re}$, multi-deck asymptotic structures can develop as throughflow increases. In § 4, we bifurcate from the linear neutral curve to numerically find nonlinear neutral travelling wave solutions to the Navier–Stokes equations. Our numerical approach generates a neutral surface of solutions for each value of
 $\eta$ (including those for which no linear neutral curve exists) and the structures of some of these solutions are discussed. In § 5, a strongly nonlinear critical layer analysis is performed to obtain a leading order analytic description of the nonlinear upper branch neutral solutions at asymptotically large
 $\textit {Re}$. The numerical and asymptotic nonlinear neutral solutions found in §§ 4 and 5, respectively, are then compared in § 6. Despite the absence of any tuning parameters, there is encouraging agreement between the two approaches in both the magnitude and shape of the leading order disturbances.
2. Governing equations and basic flow
Using the dimensional coordinate system  $(x^*,y^*)$ and velocity
 $\boldsymbol {u}^*$, consider an infinite two-dimensional channel with walls at
 $y^*=\pm h^*$. This channel is filled with incompressible Newtonian fluid of density
 $\rho ^*$ and kinematic viscosity
 $\nu ^*$. The upper wall is moved at a speed
 $u^*_0$ in the
 $x^*$ direction to induce a Couette flow. The walls of the channel are porous and allow a constant throughflow of speed
 $v^*_0$ in the
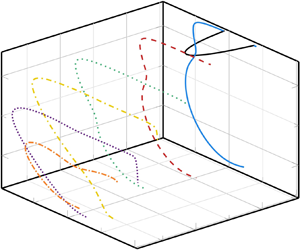
 $y^*$ direction as depicted in figure 1.
Dimensional Couette flow with constant throughflow. The basic flow profile is given with a throughflow strength varying from  $\eta =0$ (pure plane Couette flow) to
 $\eta =10$.

Altering the directions of motion and relative speed of either wall or the throughflow can be achieved by a change of basis and appropriate frame of reference. As such, this set-up provides a general framework for all wall and constant throughflow velocities. To simplify the algebra, the coordinates and frame of reference are chosen so that the bottom wall is stationary, the throughflow acts in the positive  $y^*$ direction and the upper wall moves in the positive
 $x^*$ direction.
A steady solution exists for the fluid velocity of the form  $\boldsymbol {u}^*_0=(U^*(\kern0.7pt y^*),v^*_0)$ with
 \begin{equation} U^*(\kern0.7pt y^*)=\frac{u^*_0}{2\sinh\left(\dfrac{v^*_0h^*}{\nu^*}\right)} \left(\exp\left(\frac{v^*_0y^*}{\nu^*}\right) -\exp\left(-\frac{v^*_0h^*}{\nu^*}\right)\right), \end{equation}
and zero pressure gradient. This solution is non-dimensionalised with the quantities  $\boldsymbol {u}_0=(u,v)=\boldsymbol {u}^*_0/u^*_0$,
 $(x,y)=(x^*,y^*)/h^*$ and
 $t=t^*u^*_0/h^*$. This rescales (2.1) into
 \begin{equation} u=U(\kern0.7pt y) =\frac{{\rm
e}^{\eta y}-{\rm e}^{-\eta}}{2\sinh\eta},\quad
v=\frac{\eta}{\textit{Re}},
\end{equation}
and the Navier–Stokes equations into
 \begin{gather} \frac{\partial u}{\partial x}+\frac{\partial v}{\partial y}=0, \end{gather}
 \begin{gather}\frac{\partial u}{\partial t}+u\frac{\partial u}{\partial x}+v\frac{\partial u}{\partial y} ={-}\frac{\partial p}{\partial x}+\frac{1}{\textit{Re}}\nabla^2u, \end{gather}
 \begin{gather}\frac{\partial v}{\partial t}+u\frac{\partial v}{\partial x}+v\frac{\partial v}{\partial y} ={-}\frac{\partial p}{\partial y}+\frac{1}{\textit{Re}}\nabla^2v. \end{gather}
The dimensionless parameters  $\textit {Re}$ and
 $\eta$ are given by
 \begin{equation} \textit{Re}=\frac{u^*_0h^*}{\nu^*},\quad \eta=\frac{v^*_0h^*}{\nu^*}. \end{equation}
These dimensionless parameters correspond to an effective Reynolds number in the  $x$ and
 $y$ directions, respectively. The number
 $\textit {Re}$ will be referred to as the Reynolds number, while
 $\eta$ will be called the throughflow number. As discussed above, the case
 $\eta <0$ can be achieved by a change of basis and appropriate frame of reference, meaning we can restrict our attention to the case
 $\eta \geqslant 0$ without loss of generality. This can be physically interpreted as injecting fluid through the lower stationary wall and extracting fluid out of the upper wall which moves at unit speed in the positive
 $x$-direction. The magnitude of
 $\eta$ determines the speed of the throughflow. It can be verified by taking the limit of (2.2a,b) as
 $\eta \to 0$ that, in the absence of throughflow, we recover the familiar Couette linear profile. The basic flow (2.2a,b) is shown in figure 1. It is also instructive to consider the limit
 $\eta \gg 1$, where it can be shown that the base flow decays exponentially with distance from the upper wall, creating a two-tiered structure. Neglecting exponentially small terms, the base flow becomes
 \begin{equation} U(\kern0.7pt y) \sim\begin{cases} {\rm e}^{-\tilde{y}} & \text{in the inner region }\tilde{y}\geqslant0,\\ 0 & \text{in the outer region }-1\leqslant y<1, \end{cases} \end{equation}
where
 \begin{equation} \tilde{y}=\eta(1-y) \end{equation}
is the order one variable in this inner region of thickness  $1/\eta$. Whenever we take
 $\eta \gg 1$, it is assumed that
 $\eta \ll \mathit {O}(\textit {Re})$, meaning the throughflow is never stronger than the streamwise base flow. If
 $\eta \gg \mathit {O}(\textit {Re})$ or
 $\eta \sim \mathit {O}(\textit {Re})$, much of the asymptotic analysis breaks down, as the system becomes dominated by the throughflow.
3. Linear stability analysis
The linear stability of this flow was recently considered by Sun et al. (Reference Sun, Yalcin and Oberlack2024). The linear neutral stability curves provide a springboard for the computation of finite amplitude states in § 4 and so this section provides the necessary background for the subsequent analysis. In our work, a different domain for the base flow is chosen compared with that used by Sun et al. (Reference Sun, Yalcin and Oberlack2024), leading to our results differing by a factor of 2. Accounting for this, the linear stability results that were calculated independently for this paper agree with those reported by Sun et al. (Reference Sun, Yalcin and Oberlack2024). Building on their work, the asymptotic structure of the linear neutral curves are also discussed.
3.1. The modified Orr–Sommerfeld equation
The linear stability of this system is governed by a modified version of the Orr–Sommerfeld equation. To derive this equation, we perturb the basic flow with the expansions
 \begin{equation} u=U(\kern0.7pt y)+\varepsilon\hat{u}(\kern0.7pt y){\rm e}^{\mathrm{i}\xi},\quad v=\frac{\eta}{\textit{Re}}+\varepsilon\hat{v}(\kern0.7pt y){\rm e}^{\mathrm{i}\xi},\quad p=\varepsilon\hat{p}(\kern0.7pt y){\rm e}^{\mathrm{i}\xi}, \end{equation}
where  $\xi =\alpha (x-ct)$,
 $\alpha \in \mathbb {R}$ is the wavenumber,
 $c\in \mathbb {C}$ is the corresponding wavespeed and
 $\varepsilon$ is a small parameter. To obtain the governing equation, (3.1a–c) is substituted into (2.3), terms of
 $O(\varepsilon ^2)$ are neglected and
 $\hat {u},\hat {p}$ are both eliminated giving
 \begin{equation} \left(U(\kern0.7pt y)-c+\frac{\eta}{\mathrm{i}\alpha\textit{Re}}\frac{\mathrm{d}}{\mathrm{d}y}\right) \left(\frac{\mathrm{d}^2}{\mathrm{d}y^2}-\alpha^2\right)\hat{v} -\frac{\mathrm{d}^2U}{\mathrm{d}y^2}\hat{v} =\frac{1}{\mathrm{i}\alpha\textit{Re}}\left(\frac{\mathrm{d}^2}{\mathrm{d}y^2}-\alpha^2\right)^2\hat{v}, \end{equation}
along with the boundary conditions
 \begin{equation} \hat{v}(\pm1)=\left.\frac{\mathrm{d}\hat{v}}{\mathrm{d}y}\right|_{y=\pm1}=0. \end{equation}
To solve (3.2), a Chebyshev collocation approach pioneered by Orszag (Reference Orszag1971) was used. For this particular base flow, an analytic solution in terms of hypergeometric functions is known due to Baldwin (Reference Baldwin1970), but this is somewhat cumbersome to evaluate and it is preferable for the nonlinear extension in § 4 to have a purely numeric solution. Equation (3.2) has been considered in previous studies, applied to different base flows (see Sheppard Reference Sheppard1972; Fransson & Alfredsson Reference Fransson and Alfredsson2003; Sun et al. Reference Sun, Yalcin and Oberlack2024). The results obtained in this paper have been compared with these studies (using the appropriate base flow) to validate the numerical procedure.
Figure 2(a) shows linear neutral curves found for different values of the throughflow number. Recall that when  $\eta =0$, we recover Couette flow which is linearly stable for all Reynolds numbers. The relationship between
 $\alpha$ and
 $c$ on this neutral curve is shown in figure 2(b) and will be explored in more detail below. The smallest Reynolds number at which linear instability occurs, the linear critical Reynolds number, is denoted
 $\textit {Re}^{\ell }_c$ and the corresponding wavenumber is denoted
 $\alpha ^{\ell }_c$. Both are shown in figure 3 as
 $\eta$ increases. From this, we can see that there exists a critical throughflow number,
 $\eta ^{\ell }_c$, such that for
 $\eta >\eta ^{\ell }_c$, linear neutral stability curves exist. From figure 3, we find
 $\eta ^{\ell }_c\approx 3.35$. This estimate will be refined shortly. The flow is most unstable (
 $\textit {Re}^{\ell }_c$ is minimised) when
 $\eta \approx 4.90$. Both of these throughflow numbers agree with Sun et al. (Reference Sun, Yalcin and Oberlack2024) after appropriate rescaling.
Linear neutral curves for different values of the throughflow number  $\eta$. (a) Relationship between
 $\textit {Re}$ and
 $\alpha$, and (b) relationship between
 $c$ and
 $\alpha$ on the linear neutral curve.

(a) Linear critical Reynolds number and (b) corresponding wavenumber as  $\eta$ is varied. The dashed line is the asymptote as
 $\eta \to \eta ^{\ell }_c$ from above.

To improve our estimate of  $\eta ^{\ell }_c$ and better understand the structure of this solution, we proceed as follows. Consider the limit of (3.2) as
 $\alpha \to 0$ and
 $\textit {Re}\to \infty$ such that
 $\gamma =\alpha \textit {Re}$ remains
 $\mathit {O}(1)$. Note this is a formal limit and
 $\gamma$ may still be numerically large or small provided it is finite. This simplifies (3.2a) to
 \begin{equation} \frac{1}{\mathrm{i}\gamma} \left(\frac{\mathrm{d}^4\hat{v}}{\mathrm{d}y^4} -\eta\frac{\mathrm{d}^3\hat{v}}{\mathrm{d}y^3}\right) -(U-c)\frac{\mathrm{d}^2\hat{v}}{\mathrm{d}y^2} +\frac{\mathrm{d}^2U}{\mathrm{d}y^2}\hat{v}=0. \end{equation}
We can solve (3.3) with the boundary conditions (3.2b), again using Chebyshev collocation, to obtain the linear neutral curve in  $(\eta,\gamma )$ space. The resulting neutral curve is shown in figure 4.
Linear neutral curve in the limit  $\alpha \to 0$,
 $\textit {Re}\to \infty$,
 $\gamma =\alpha \textit {Re}=\mathit {O}(1)$.

We can use this system to efficiently find  $\eta ^{\ell }_c$ to a high accuracy. By the above definition,
 $\eta ^{\ell }_c$ is the minimum
 $\eta$ on the curve in figure 4, which is found to be
 $\eta ^{\ell }_c\approx 3.3511$. The fact that our chosen limit still produces a neutral curve demonstrates that the curves in figure 2 behave such that
 $\alpha \propto \textit {Re}^{-1}$ as
 $\textit {Re}\to \infty$. As a result, we do not expect a multi-deck upper and lower branch structure to form that we can analyse analytically in this limit. However, figure 4 also shows that as
 $\eta$ increases,
 $\gamma \to \infty$. This implies that in the
 $\eta \gg 1$ limit, new upper and lower branch structures will emerge, and we study these below.
3.2. Lower and upper branch structures
To analyse the lower and upper branch structures found when  $1\ll \eta \ll \mathit {O}(\textit {Re})$, a similar approach to Smith (Reference Smith1979) and Bodonyi & Smith (Reference Bodonyi and Smith1981) is taken for the lower and upper branch, respectively. The coefficients found in the expansions of
 $\alpha$ and
 $c$ are similar to those of the asymptotic suction profile in Hughes & Reid (Reference Hughes and Reid1965, p. 13) and Dempsey & Walton (Reference Dempsey and Walton2017, p. 9) ensuring confidence in the results. Due to the similarity to previous studies, only an outline of the derivation will be given, with the aim of illustrating why these structures only emerge in the
 $\eta \gg 1$ limit.
To perform this analysis, the small parameter  $\varepsilon$ is introduced which we will find in terms of the Reynolds number for both structures separately. For the lower branch, we expect a triple deck structure to form as shown in figure 5(a). For the upper branch, six layers are anticipated, as shown in figure 5(b). Note that the coordinate system of figure 5 is flipped when compared with figure 1, due to the transformation (2.6). Since the analysis is completed entirely using the inner coordinates
 $(\tilde {x},\tilde {y})$, this flipped perspective avoids unnecessary negative signs and results in a closer correspondence to the asymptotic suction profile's upper/lower branch structures. In terms of
 $\textit {Re}$, the small parameter
 $\varepsilon$ is not the same for both structures, so a label has been added for clarity in figure 5. When
 $\varepsilon$ is used without a label, the statement will apply to both structures. Figure 3 shows linear growth of both
 $\textit {Re}$ and
 $\alpha$ in
 $\eta$, so we expect to see this in our distinguished limit. The wavelike variable
 $\xi$ should also remain
 $\mathit {O}(1)$, which is achieved by rescaling
 $x$ and
 $t$. Hence, we define
 \begin{equation} \widetilde{\textit{Re}}=\frac{\textit{Re}}{\eta},\quad \tilde{\alpha}=\frac{\alpha}{\eta},\quad \tilde{x}=\eta x,\quad\tilde{t}=\eta t, \end{equation}
to be our variables in this distinguished limit. Recall that when both  $\eta,\textit {Re}\gg 1$, we assume
 $\eta \ll \mathit {O}(\textit {Re})$, in which case we still have
 $\widetilde {\textit {Re}}\gg 1$. The wavenumber and wavespeed are expanded in the small parameter
 $\varepsilon$ as
 \begin{gather} \tilde{\alpha}=\varepsilon\alpha_1+\varepsilon^2\alpha_2 +\varepsilon^3\alpha_3+\cdots, \end{gather}
 \begin{gather}c=c_0-\varepsilon c_1-\varepsilon^2c_2 -\varepsilon^3c_3+\cdots. \end{gather}
We only expect this structure to exist in the  $\eta \gg 1$ limit, where the base flow splits into an inner and outer region as stated in (2.5). Substituting the scalings (3.4a–d) for the outer region into (2.3), we find that the perturbation in this outer region is exponentially small. Hence, we restrict our analysis to take place entirely within the inner region with
 $\mathit {O}(1)$ variable
 $\tilde {y}$ given in (2.6). In doing so, our solution must decay to zero exponentially as
 $\tilde {y}\to \infty$ to match the outer region. The expansions
 \begin{equation} u=U(\kern0.7pt \tilde{y})+\Delta\hat{u}(\kern0.7pt \tilde{y}){\rm e}^{\mathrm{i}\xi},\quad v=\frac{\eta}{\textit{Re}}-\Delta\hat{v}(\kern0.7pt \tilde{y}){\rm e}^{\mathrm{i}\xi},\quad p=\Delta\hat{p}(\kern0.7pt \tilde{y}){\rm e}^{\mathrm{i}\xi}, \end{equation}
are used where  $\xi =\tilde {\alpha }(\tilde {x}-c\tilde {t})=\alpha (x-ct)$ and
 $\varDelta \ll 1$. Substituting (3.6a–c) into (2.3) and neglecting terms of
 $\mathit {O}(\varDelta ^2)$, we derive the governing equations of a linear perturbation in the inner region as
 \begin{gather} \mathrm{i}\tilde{\alpha}\hat{u}+\frac{\mathrm{d}\hat{v}}{\mathrm{d}\tilde{y}}=0, \end{gather}
 \begin{gather}\mathrm{i}\tilde{\alpha}(U-c)\hat{u}+\frac{\mathrm{d}U}{\mathrm{d}\tilde{y}}\hat{v} ={-}\mathrm{i}\tilde{\alpha}\hat{p} +\frac{1}{\widetilde{\textit{Re}}}\left( \frac{\mathrm{d}^2\hat{u}}{\mathrm{d}\tilde{y}^2} +\frac{\mathrm{d}\hat{u}}{\mathrm{d}\tilde{y}} -\tilde{\alpha}^2\hat{u}\right), \end{gather}
 \begin{gather}\mathrm{i}\tilde{\alpha}(U-c)\hat{v} ={-}\frac{\mathrm{d}\hat{p}}{\mathrm{d}\tilde{y}} +\frac{1}{\widetilde{\textit{Re}}}\left( \frac{\mathrm{d}^2\hat{v}}{\mathrm{d}\tilde{y}^2} +\frac{\mathrm{d}\hat{v}}{\mathrm{d}\tilde{y}} -\tilde{\alpha}^2\hat{v}\right). \end{gather}
We aim to find  $c_0,c_1,\alpha _1$ and
 $\varepsilon$, which is achieved by finding leading order solutions across all of the layers. These solutions are subject to no slip and no penetration at
 $\tilde {y}=0$, exponential decay as
 $\tilde {y}\to \infty$ and matching between adjacent layers.
Layer structures for the (a) lower branch and (b) upper branch solutions. The scalings are given in terms of the inner variables  $\tilde {x}$ and
 $\tilde {y}$, resulting in a flipped perspective compared with figure 1.

The inviscid cores are perhaps most important, as the leading order vertical velocity,  $\hat {v}(\kern0.7pt \tilde {y})=\varepsilon G_0(\kern0.7pt \tilde {y})+\mathit {O}(\varepsilon ^2)$, can be found to be given by
 \begin{equation} G_0(\kern0.7pt \tilde{y})=\mathrm{i}\alpha_1A_0|c_0-{\rm e}^{-\tilde{y}}|, \end{equation}
where  $A_0$ is a constant of integration. This is significant as both structures in figure 5 require a thinner layer below the inviscid core. For this to be achieved, it can be verified that we require
 $G_0(\kern0.7pt \tilde{y})\to 0$ as
 $\tilde{y}\to 0$, and hence that
 $c_0=1$. It transpires that a solution with unit wavespeed is only possible in the
 $\eta \gg 1$ limit, explaining why these upper and lower branch structures only exist in this limit. It can be seen in figure 2(b) that the largest value of
 $c$ is approaching unity as
 $\eta$ increases but does not attain this value. With
 $\eta =10$,
 $c$ only obtains a maximum of
 $0.956$, resulting in the upper/lower branch structures breaking down quickly. A large value of
 $\eta$ is needed to maintain the structures as
 $\widetilde {\textit {Re}}$ increases.
The scalings given in figure 5 are found by matching between layers as appropriate. Both  $\varepsilon _l$ and
 $\varepsilon _u$ can be found in terms of
 $\widetilde {\textit {Re}}$ by considering the balance between viscous and inertial terms in appropriate layers. Doing so gives
 \begin{equation} \varepsilon_l=\widetilde{\textit{Re}}^{{-}1/4},\quad \varepsilon_u=\widetilde{\textit{Re}}^{{-}1/6}. \end{equation}
Completing the analysis and matching between each layer allows us to obtain  $\alpha _1$ and
 $c_1$. It should be noted that for the upper branch solution, the existence of the critical layer results in a phase jump of
 $+{\rm \pi} {\rm i}$ from above the critical layer to below it. Linear critical layers are well studied and the
 $+$ sign comes from the fact
 $U'(\kern0.7pt y_c)<0$, where
 $y_c$ is the location of the critical layer. For a more detailed explanation of this jump condition, see Ruban et al. (Reference Ruban, Gajjar and Walton2023).
Overall, it is found that in the lower branch structure,
 \begin{equation} \alpha^l_1\approx1.0006525,\quad c^l_1\approx2.2967186, \end{equation}
and for the upper branch structure,
 \begin{equation} \alpha^u_1=c^u_1=(2{\rm \pi}^2)^{{-}1/6}. \end{equation}
Combining these constants with the appropriate  $\varepsilon$, we can approximate the neutral curves in figure 2 with
 \begin{gather} \tilde{\alpha}=\alpha^l_1\widetilde{\textit{Re}}^{{-}1/4} \quad\iff\quad \alpha=\alpha^l_1\eta^{5/4}\textit{Re}^{{-}1/4} \end{gather}
 \begin{gather} \tilde{\alpha}=(2{\rm \pi}^2)^{{-}1/6}\widetilde{\textit{Re}}^{{-}1/6} \quad\iff\quad \alpha=(2{\rm \pi}^2)^{{-}1/6}\eta^{7/6}\textit{Re}^{{-}1/6}. \end{gather}
This is a leading order description based on  $\widetilde {\textit {Re}}$ being asymptotically large, meaning we only expect this approximation to be accurate for very large values of
 $\widetilde {\textit {Re}}$.
3.3. Comparison of asymptotic theory and numerical solutions
Now that we have obtained leading order upper and lower branch asymptotic approximations to the curves in figure 2(a), we wish to analyse their accuracy. To do so, we rescale the solutions in figure 2(a) to the  $(\widetilde {\textit {Re}},\tilde {\alpha })$ coordinates. We also include a neutral curve with
 $\eta =100$, as for any finite
 $\eta$, our upper and lower branch structures will eventually break down and the curve will tend to the appropriate limit from figure 4. Increasing
 $\eta$ results in the multi-deck structure holding for larger values of
 $\widetilde {\textit {Re}}$, enabling (3.11) to be a better approximation. The results of this rescaling, as well as the asymptotes from (3.11), are shown in figure 6.
Linear neutral curves, rescaled into the parameters  $\widetilde {\textit {Re}}=\textit {Re}/\eta$ and
 $\tilde {\alpha }=\alpha /\eta$. The black curves represent the upper and lower branch asymptotic approximations.

As  $\widetilde {\textit {Re}}$ increases, the curves diverge greatly. For
 $\eta \leqslant 10$, the asymptotic structures quickly disappear and the behaviour shown in figure 4 dominates. The value
 $\eta =100$ is sufficiently large that our upper and lower branch structures do not break down within the domain plotted, allowing us to see a convergence to the appropriate asymptotes.
As an aside, we see that as  $\eta$ increases, the curves coincide near
 $\widetilde {\textit {Re}}^{\ell }_c=\textit {Re}^{\ell }_c/\eta$. This implies that in the large
 $\eta$ limit, the curves in figure 6 are accurate approximations of the linear neutral curve for asymptotic suction flow near the linear critical Reynolds number and we can use this to estimate the critical Reynolds number for this flow. Using the
 $\eta =100$ curve in figure 6, it is estimated that the linear critical Reynolds number of the asymptotic suction profile is 54 378.60263 which is in very close agreement with the value of 54 378.62032 from Yalcin, Turkac & Oberlack (Reference Yalcin, Turkac and Oberlack2021), lending further credence to the reliability of these results.
4. Nonlinear travelling wave solutions at finite Reynolds number
4.1. Nonlinear numerical method
Given our previous linear analysis, we now aim to perform a nonlinear analysis of our stability problem. This will be performed at finite Reynolds number and will involve looking for travelling wave solutions to (2.3). The numerical method used in this section is based on that employed by Wong & Walton (Reference Wong and Walton2012). We seek solutions of the form
 \begin{equation}
(u,v,p)=\left(U(\kern0.7pt y)+\hat{u}_0(\kern0.7pt
y),\frac{\eta}{\textit{Re}},\hat{p}_0(\kern0.7pt y)\right)
+\sum_{n=1}^\infty(\hat{u}_n(\kern0.7pt
y),\hat{v}_n(\kern0.7pt y),\hat{p}_n(\kern0.7pt y))
{\rm e}^{\mathrm{i}n\hat{\xi}} +\text{c.c.},
\end{equation}
where  $U(\kern0.7pt y)$ is given by (2.2a,b) and
 $\hat {\xi }=\alpha (x-ct)$. The terms
 $\hat {u}_0(\kern0.7pt y)$ and
 $\hat {p}_0(\kern0.7pt y)$ are the mean flow distortion and mean pressure distortion, respectively. For simplicity of notation, we define
 $\hat {v}_{-n}(\kern0.7pt y)=\overline {\hat {v}_n(\kern0.7pt y)}$. Substituting (4.1) into (2.3) gives our governing equations. To ensure that the problem is computationally feasible, only the first
 $N$ modes are retained with the value of
 $N$ taken sufficiently large to achieve satisfactory resolution of the solutions. The equation involving the mean pressure distortion uncouples from the rest of the system and need not be considered further. Taking the resulting system of equations, every instance of
 $\hat {u}_n$ and
 $\hat {p}_n$ for
 $n\geqslant 1$ can be eliminated to give the following system:
 \begin{gather} \hat{u}_0''-\eta\hat{u}_0' =\sum_{k=1}^N\frac{\mathrm{i}\textit{Re}}{\alpha k} (\hat{v}_k''\hat{v}_{{-}k} -\hat{v}_k\hat{v}_{{-}k}''),\end{gather}
 \begin{gather} {-}\frac{1}{\alpha^2n^2\textit{Re}} \mathrm{D}_n^2\hat{v}_n +\frac{\mathrm{i}}{\alpha n} \left(U+\hat{u}_0-c +\frac{\eta}{\mathrm{i}\alpha n\textit{Re}}\frac{\mathrm{d}}{\mathrm{d}y}\right) \mathrm{D}_n\hat{v}_n -\frac{\mathrm{i}}{\alpha n} (U''+\hat{u}_0'')\hat{v}_n\nonumber\\ =\sum_{k=1}^{n-1}S_{k,n}^{(1)}(\kern0.7pt y) +\sum_{k=n+1}^NS_{k,n}^{(2)}(\kern0.7pt y), \end{gather}
 \begin{gather} \hat{u}_0(\pm1)=\hat{v}_n(\pm1)=\hat{v}_n'(\pm1)=0, \end{gather}
where
 \begin{gather} S_{k,n}^{(1)}(\kern0.7pt y) =\left(1-\frac{k}{n-k}\right)\hat{v}_k\hat{v}_{n-k}' +\frac{1}{\alpha^2n(n-k)} (\hat{v}_k''\hat{v}_{n-k}' +\hat{v}_k'\hat{v}_{n-k}'')\nonumber\\ -\frac{1}{\alpha^2kn} (\hat{v}_k'''\hat{v}_{n-k} +\hat{v}_k''\hat{v}_{n-k}'), \end{gather}
 \begin{gather} S_{k,n}^{(2)}(\kern0.7pt y) =\left(1-\frac{k}{n-k}\right)\hat{v}_k\hat{v}_{n-k}' +\left(1-\frac{n-k}{k}\right)\hat{v}_k'\hat{v}_{n-k} +\frac{1}{\alpha^2k(n-k)} (\hat{v}_k''\hat{v}_{n-k}' +\hat{v}_k'\hat{v}_{n-k}'')\nonumber\\ -\frac{1}{\alpha^2nk} (\hat{v}_k'''\hat{v}_{n-k} +\hat{v}_k''\hat{v}_{n-k}') -\frac{1}{\alpha^2n(n-k)} (\hat{v}_k\hat{v}_{n-k}''' +\hat{v}_k'\hat{v}_{n-k}''), \end{gather}
 \begin{equation} \mathrm{D}_n\equiv\frac{\mathrm{d}^2}{\mathrm{d}y^2}-\alpha^2n^2, \end{equation}
and  $'$ denotes differentiation with respect to
 $y$. It can be shown, given a solution
 $\hat {v}_n(\kern0.7pt y)$ to (4.2a–c), that
 $\hat {v}_n\mapsto \hat {v}_n{\rm e}^{\mathrm {i}n\theta }$ is also a valid solution to (4.2) for any
 $\theta \in \mathbb {R}$; this means that we need to impose a condition to fix the value of
 $\theta$, which is achieved with the equation
 \begin{equation} \sum_{n=1}^N {\rm Re}(\hat{v}_n(0))=0. \end{equation}
It can be shown that  $\exists \theta \in [0,2{\rm \pi} ]$ such that (4.2g) can always be satisfied. For given values of
 $\textit {Re}$ and
 $\eta$, we expect our numerical approach to yield a curve of neutral solutions in the
 $(\alpha,c)$ plane. To identify different solutions along this curve, an additional input to our system is required which can be perturbed to find different solutions at fixed values of
 $\textit {Re}$ and
 $\eta$. This new input is given in the form of a nonlinear amplitude
 \begin{equation} \hat{A}^2=\sum_{n=1}^N {\rm Re}(\hat{v}_n(0))^2+{\rm Im}(\hat{v}_n(0))^2. \end{equation}
It should be emphasised that the only approximation made in the derivation of (4.2) is the truncation of the Fourier series in  $\hat {\xi }$. This means a fully resolved solution to (4.2) with
 $\hat {A}>0$ corresponds to a nonlinear travelling wave solution to the full Navier–Stokes equations (2.3).
To solve (4.2) numerically, we again use Chebyshev collocation. The solution will be evaluated using  $M+1$ Chebyshev polynomials evaluated at the Gauss points
 $y_j=\cos ({\rm \pi} (j-1)/M)$ for
 $j=1,2,\ldots,M+1$. We express
 $\hat {u}_0(\kern0.7pt y)$ and
 $\hat {v}_n(\kern0.7pt y)$ as
 \begin{equation} \hat{u}_0(\kern0.7pt y)=\sum_{m=1}^{M+1}\gamma_mT_{m-1}(\kern0.7pt y),\quad \hat{v}_n(\kern0.7pt y)=\sum_{m=1}^{M+1}(a_m^{(n)}+\mathrm{i}b_m^{(n)})T_{m-1}(\kern0.7pt y), \end{equation}
where  $T_m(\kern0.7pt y)$ is the
 $m$th Chebyshev polynomial of the first kind and
 $\gamma _m,a_m^{(n)},b_m^{(n)}$ are real coefficients of the Chebyshev series. This gives a total of
 $(2N+1)(M+1)+2$ parameters for our system and (4.2) corresponds to
 $(2N+1)(M+1)+2$ equations after substitution of (4.3a,b) and splitting into real/imaginary components. This allows us to express (4.2) as a vector equation of the inputs
 $\alpha,c,a_m^{(n)},b_m^{(n)},\gamma _m$ and Newton iteration can be used to find a solution.
While this is a well-posed numerical problem, in practice, we require a very close initial guess to a correct solution for the procedure to converge. This means that we will not be able to find any solutions without a systematic way to find a starting guess. Observe that if  $n=1$ and
 $\hat {u}_0\equiv 0$, the left-hand side of (4.2b) is equivalent to (3.2a) after moving all the terms in (3.2a) to the left-hand side and multiplying by
 $\mathrm {i}/\alpha$. Suppose
 $\hat {v}(\kern0.7pt y),\alpha _{or},c_{or}$ is a solution to (3.2) for a given
 $\textit {Re},\eta$ normalised so that
 $\hat {v}(0)=1$. Then, by this observation,
 \begin{equation} \hat{v}_1(\kern0.7pt y)=\mathrm{i}\hat{A}\hat{v}(\kern0.7pt y),\quad \alpha=\alpha_{or},\quad c=c_{or},\quad \hat{u}_0(\kern0.7pt y)=\hat{v}_n(\kern0.7pt y)\equiv0\quad\text{for }n\geqslant2, \end{equation}
is a solution to (4.2b), (4.2c), (4.2g) and (4.2h). Importantly, (4.4) is a solution for arbitrary  $\hat {A}\geqslant 0$. While (4.4) does not satisfy (4.2a) unless
 $\hat {A}=0$, setting
 $\hat {A}$ close to zero makes (4.4) arbitrarily close to a non-trivial solution. This observation means we can take a neutral solution to the modified Orr–Sommerfeld equation and bifurcate from this curve into non-zero amplitude space.
This will allow us to find solutions to (4.2), but due to the complexity of the system, convergence would require taking very small steps in  $\hat {A}$. To remedy this and make the algorithm more robust, the Jacobian of (4.2) has been calculated analytically. This requires taking derivatives of each equation in (4.2) with respect to each parameter
 $\alpha,c,a_m^{(n)},b_m^{(n)},\gamma _m$. These derivatives, while important, are algebraically cumbersome and so have not been included for brevity.
This method requires a linear neutral curve from which to bifurcate to generate the initial solutions. This means that this method can only be used for  $\eta \geqslant \eta ^{\ell }_c$. For values outside of this range, or to investigate neutral solutions with Reynolds numbers smaller than
 $\textit {Re}^{\ell }_c$, a different approach is used. Results can be obtained by stepping through values of
 $\eta$ or
 $\textit {Re}$ in
 $\hat {A}>0$ space. This allows an investigation into a solution space that was not previously accessible. Indeed, it is theoretically possible to decrease
 $\eta$ to zero, allowing a nonlinear investigation of Couette flow. Although this procedure was used to obtain some of the results, solutions in these regimes require far more Fourier modes to achieve accurate convergence. Using more than
 $N=40$ modes resulted in unreasonable computation times and so a detailed investigation of these highly nonlinear solutions has not been included.
4.2. Weakly nonlinear analysis
To validate the results described subsequently in § 4.3, a weakly nonlinear analysis is used for comparison. The result of this analysis, the Landau–Stuart equation, was first conceived by Landau (Reference Landau1944) and subsequently formally derived by Stuart (Reference Stuart1960) and Watson (Reference Watson1960). Weakly nonlinear theory has been successfully used to classify the bifurcation from the linear neutral curve in a variety of flows including circular Couette flow (Davey Reference Davey1962) and Poiseuille flow (Reynolds & Potter Reference Reynolds and Potter1967). For a full account of the theory, the reader is referred to Ruban et al. (Reference Ruban, Gajjar and Walton2023). Our aim is to see how the nonlinear amplitude  $\hat {A}$ varies with
 $\alpha$ at fixed values of
 $\textit {Re}$ and
 $\eta$. This approximation should correctly identify whether there is a subcritical or supercritical bifurcation. Suppose
 $\alpha _0,c_0$ is a neutral solution to (3.2) at some
 $\textit {Re}$ and
 $\eta$. We wish to analyse the system at
 $\alpha =\alpha _0+\delta a$, where
 $a=\mathit {O}(1)$ and
 $\delta \ll 1$.
To undertake this analysis, we expand in the small parameter  $\varepsilon$, which will be chosen as a function of
 $\delta$, using the streamfunction
 \begin{equation} \psi(x,y,t) =\varPsi(x,y) +\varepsilon\psi_1(\bar{\xi},y,\bar{t}) +\varepsilon^2\psi_2(\bar{\xi},y,\bar{t})+\cdots, \end{equation}
where
 \begin{equation} \varPsi(x,y)=\int_0^y U(z)\,\mathrm{d}z-\frac{\eta}{\textit{Re}}x,\quad \psi_1(\bar{\xi},y,\bar{t})=\bar{A}(\bar{t}){\rm e}^{\mathrm{i}\bar{\xi}}\phi_1(\kern0.7pt y)+\text{c.c.}, \end{equation}
and our variables are defined as  $\bar {\xi }=\alpha _0(x-c_0t)$ and
 $\bar {t}=\delta t$. From (4.6a,b), we see there are two time scales,
 $t$ corresponding to oscillations of the perturbations and
 $\bar {t}$ to describe the slow growth of amplitude. We want the simplest non-trivial solution for the amplitude and it transpires this will occur when
 $\delta =\varepsilon ^2$. The analysis involves the first three orders of equations from substituting (4.5) into (2.3). At leading order, we find that
 $\phi _1(\kern0.7pt y)$ is governed by (3.2), making any solution arbitrary up to a multiplicative constant. To normalise the problem, it was chosen to enforce
 $\phi _1(0)=1$. From this analysis, we obtain the Landau–Stuart equation,
 \begin{equation} \frac{\mathrm{d}|\bar{A}|^2}{\mathrm{d}\bar{t}} =2a\kappa_r|\bar{A}|^2-\ell_r|\bar{A}|^4, \end{equation}
where  $\kappa _r$ and
 $\ell _r$ are real constants found as part of the analysis. The expressions of
 $\kappa _r,\ell _r$ are similar to those of Ruban et al. (Reference Ruban, Gajjar and Walton2023), after propagating the non-trivial effects of
 $\eta \neq 0$ throughout and varying
 $\alpha$ instead of
 $\textit {Re}$. These expressions have been omitted explicitly for brevity.
Our aim is to compare the growth of  $\bar {A}$ (the weakly nonlinear amplitude) and
 $\hat {A}$ (the strongly nonlinear amplitude). We expect a neutral solution in our weak formulation if
 $|\bar {A}|$ is constant, i.e.
 \begin{equation} |\bar{A}|=\sqrt{\frac{2a\kappa_r}{\ell_r}}, \end{equation}
from (4.7). To compare the weak and strong formulations, note that the leading orders in (4.1) and (4.5) are analogous,
 \begin{equation} \hat{v}_1(\kern0.7pt y){\rm e}^{\mathrm{i}\hat{\xi}}+\text{c.c.} \approx{-}\mathrm{i}\varepsilon\alpha_0\bar{A}{\rm e}^{\mathrm{i}\bar{\xi}}\phi_1(\kern0.7pt y)+\text{c.c.} \end{equation}
Since we expect a weakly nonlinear solution to only match the strongly nonlinear solution near the linear neutral curve, we approximate  $\hat {\xi }\approx \bar {\xi }$. Recall from (4.4) that close to the linear neutral curve, we have
 $\hat {v}_1(0)\approx \mathrm {i}\hat {A}$. Finally, as part of the weakly nonlinear analysis, it was chosen that
 $\phi _1(0)=1$, so evaluating (4.9) at
 $y=0$ gives us
 \begin{equation} \varepsilon ={-}\frac{\hat{A}}{\alpha_0\bar{A}} =\frac{\hat{A}}{\alpha_0}\sqrt{\frac{\ell_r}{2a\kappa_r}}, \end{equation}
after using (4.8) to find  $\bar {A}$ so that
 $\varepsilon \in \mathbb {R}$ and
 $\varepsilon >0$. Using (4.10) and the fact
 $\varepsilon ^2=\delta =(\alpha -\alpha _0)/a$, we find the relationship
 \begin{equation} \hat{A}^2\approx\frac{2\kappa_r}{\ell_r}\alpha_0^2(\alpha-\alpha_0). \end{equation}
This is our approximation of the nonlinear amplitude and will allow a partial check of the numerical results in § 4.3. This is a linear approximation for  $\hat {A}^2$, so when plotting
 $\hat {A}^2$ against
 $\alpha$, the approximation will be, at best, tangent to the curve at
 $\hat {A}=0$.
4.3. Numerical results
In this section, we examine results generated from the numerical approach discussed in § 4.1. The neutral curves in figure 2 exist at relatively high Reynolds numbers, which generally means that many Fourier modes and Chebyshev polynomials are required to accurately generate nonlinear continuations of these curves. To reduce this computational burden, most of the simulations are performed with Reynolds numbers as small as possible, most commonly of magnitude  $10^5$.
To begin, the nonlinear amplitude  $\hat {A}$ is compared with the approximation from the weakly nonlinear analysis given in (4.11). The amplitudes have been normalised relative to the maximum value attained by
 $\hat {A}$, which is denoted
 $\hat {A}_{{max}}$. That is to say, we have defined
 $\hat {A}_n=\hat {A}/\hat {A}_{{max}}$. Equation (4.11) is rescaled to approximate
 $\hat {A}_n$ instead of
 $\hat {A}$. To aid the comparison,
 $\hat {A}_n^2$ has been plotted as this makes the weak approximation linear in
 $\alpha$. In figure 7, we see the neutral curves at a Reynolds number of
 $\textit {Re}={360\,000}$ and a throughflow number of
 $\eta =6$. It appears that the linear approximation is tangent to the nonlinear amplitude at
 $\hat {A}=0$, as expected. Both curves in figure 7 correspond to a subcritical bifurcation. Here,
 $\hat {A}_n$ is of the magnitude
 $10^{-3}$, which is very small compared with its maximum value of 1. This limited accuracy of the linear approximation can also be observed in other studies (see for example Deguchi & Walton Reference Deguchi and Walton2018, figure 2). Figure 8 shows how, at a fixed Reynolds number of 500 000, increasing the throughflow strength decreases the slope
 $\kappa _r/\ell _r$ from (4.11). Due to the linear neutral curves only coming into existence at
 $\eta ^{\ell }_c\approx 3.35$, the growth has only been tracked from
 $\eta =4$, but it is clear that increasing throughflow makes
 $\alpha$ grow more rapidly when varying amplitude.
Normalised amplitude growth predicted by the weakly nonlinear approximation and the strongly nonlinear simulation when bifurcating from (a) the upper branch and (b) the lower branch of the linear neutral curve. A throughflow number of  $\eta =6$ was used and a Reynolds number of
 $\textit {Re}={360\,000}$.

Slope of the initial amplitude growth, as predicted by the weakly nonlinear theory, of the upper branch at a Reynolds number of 500 000 as a function of the throughflow number.

A selection of nonlinear neutral curves with  $\eta =6$ are shown in figure 9. Between
 $N=10$ and
 $N=20$ Fourier modes and
 $M=150$ Chebyshev polynomials were used to generate the various curves in figure 9. Note that the lower branch is only shown for a limited range of amplitudes beyond which it proved impossible to obtain a converged solution. The inability to computationally continue the lower branch into the strongly nonlinear regime has been observed before, e.g. for boundary-layer flow (Hall Reference Hall1995, figure 2) and plane Poiseuille flow (Deguchi & Walton Reference Deguchi and Walton2018, figure 2).
Nonlinear neutral curves for  $\eta =6$. Both (a,c) a two-dimensional (2-D) representation and (b,d) a three-dimensional (3-D) representation are shown with the black curves being the appropriate linear neutral curve from figure 2. The relationship between the amplitude and wavenumber are shown in panels (a,b) and the relationship between the wavenumber and wavespeed in panels (c,d).

Both the relationship between  $\hat {A}$ and
 $\alpha$ (figure 9a,b) and the relationship between
 $\alpha$ and
 $c$ (figure 9c,d) are shown. The lower branch can be observed leaving the linear neutral curves in figures 9(b) and 9(d) for
 $\textit {Re}={360\,000}, {500\,000}$, but these solutions have only been calculated for small
 $\hat {A}$. While the choice of amplitude measure is somewhat arbitrary, the relationship between
 $\alpha$ and
 $c$ is objective and should be used as the primary view of these neutral curves. All graphs in figure 9 show a rapid growth in wavenumber for small perturbations in
 $\hat {A}$ or
 $c$ near the linear neutral curve.
The curves in figure 9 form part of the nonlinear neutral surface that contains neutral solutions far below the linear limit of  $\textit {Re}^{\ell }_c\approx {357\,769}$. If
 $\textit {Re}_c$ denotes the minimum
 $\textit {Re}$ on the nonlinear neutral surface, when
 $\eta =6$, it was found that
 $\textit {Re}_c\approx {19\,200}$. The nonlinear critical Reynolds number is shown for a range of values of
 $\eta$ in figure 10. There is a small amount of curvature; however, the curve appears to be an approximately linear relationship. Crucially, figure 10 implies that faster throughflow leads to a larger range of stable modes. So while
 $\textit {Re}_c$ is an order of magnitude smaller than its linear counterpart
 $\textit {Re}^{\ell }_c$, both show that sufficiently strong throughflow stabilises Couette flow.
Nonlinear critical Reynolds number as the throughflow number varies.

Individual neutral solutions can also be investigated, some of which are shown in figure 11. The functions shown are the mean flow distortion  $u_0(\kern0.7pt y)$ and the travelling wave components
 $v_n(\kern0.7pt y){\rm e}^{\mathrm {i}n\hat {\xi }}+\text {c.c.}$. Since the
 $v_n(\kern0.7pt y)$ are complex-valued, we plot twice their imaginary part. The reason for this choice is discussed in § 6 when we compare these functions to their analytic counterparts obtained from an asymptotic theory. From each figure, we observe an ordering where
 $u_0>v_1>v_2>v_3$ with the disturbance concentrated over a region located at the top of the domain. This suggests the existence of a structure that we will look for in § 5. As the amplitude increases, this ordering and structure breaks down. This is most noticeable in figure 11(d), where
 $v_2$ and
 $v_3$ are of a similar order of magnitude and
 $u_0$ does not exponentially decay to zero as
 $y\to -1$. This behaviour is due to figure 11(d) using an amplitude which is near the maximum for the corresponding neutral curve in figure 9(a).
The first few modes of the nonlinear neutral solutions. Each graph uses  $\eta =6$ and different values for
 $\textit {Re}$ and
 $\hat {A}$, as indicated in the bottom right. For the complex-valued modes,
 $2{\rm Im}(f(\kern0.7pt y))$ is plotted.

The individual components shown in figure 11 can be appropriately combined to visualise the total perturbation to the base flow, as shown in figure 12. The flow visualised is for the parameters shown in figure 11(c). Over one period, we can see that the majority of the activity happens towards the top of the domain. This is due to the mean flow distortion (the dominant flow term) being significant only for  $y>0$.
A nonlinear neutrally stable perturbation to the base flow with  $\eta =6$,
 $\textit {Re}={500\,000}$,
 $\hat {A}=0.005$. The individual components are shown in figure 11(c).

These neutral solutions allow a much more thorough and realistic investigation into the behaviour of this flow than their linear counterparts. It is clear by comparing the values of  $\textit {Re}^{\ell }_c$ and
 $\textit {Re}_c$ in figures 3(a) and 10, respectively, that these nonlinear results differ greatly from the linear theory. However, obtaining these solutions is computationally expensive, especially at large Reynolds numbers. Furthermore, trying to track
 $\textit {Re}_c$ becomes computationally infeasible as
 $\eta$ decreases, preventing us from numerically finding the critical value of
 $\eta$ beyond which these nonlinear solutions exist. The results in figure 11 seem to indicate an asymptotic structure which would give a pathway to analytically investigate this nonlinear problem.
5. Strongly nonlinear critical layer analysis at high Reynolds number
In this section, a strongly nonlinear analysis will be performed seeking self-sustaining structures in the flow at asymptotically large Reynolds numbers. We aim to provide an asymptotic description of the upper branch modes found computationally in § 4. Similar analyses have been conducted for many flows, including boundary layer flows (Bodonyi, Smith & Gajjar Reference Bodonyi, Smith and Gajjar1983), Hagen–Poiseuille flow (Smith & Bodonyi Reference Smith and Bodonyi1982a), unsteady pipe flow (Walton Reference Walton2011) and plane Poiseuille flow (Smith, Doorly & Rothmayer Reference Smith, Doorly and Rothmayer1990; Deguchi & Walton Reference Deguchi and Walton2018). The analysis conducted in this paper follows most closely to that of zero-mass-flux plane Poiseuille–Couette flow by Walton & Barnes (Reference Walton and Barnes2023). The effect of throughflow is primarily to change the behaviour in the inviscid core, which will be explained in detail. For the rest of the analysis, Walton & Barnes (Reference Walton and Barnes2023) should be consulted for further details.
To perform this analysis, we take  $\textit {Re}\gg 1$. To begin, the case
 $\eta =\mathit {O}(1)$ will be considered, and we assume
 $\alpha \sim c=\mathit {O}(1)$. The layer structure is shown in figure 13. The thickness of the wall layer is to ensure a leading order balance between the inertial and viscous terms. The thickness of the critical layer is equal to our perturbation parameter
 $\varepsilon$. This is found in terms of
 $\textit {Re}$ as part of the solution. Only one critical layer is expected due to
 $U(\kern0.7pt y)$, as given in (2.2a), being monotonic. When
 $\eta >0$, the critical layer is expected to be skewed to the top of the domain for most wavespeeds. By inverting our base flow
 $U(\kern0.7pt y)$, we find that at a wavespeed
 $c$, the critical layer will be located at
 \begin{equation} y_c=\frac{1}{\eta}\ln(2c\sinh\eta+{\rm e}^{-\eta}). \end{equation}
We now aim to analyse each layer of this structure with particular emphasis on how throughflow changes the behaviour of the inviscid core.
Layer structure used in the strongly nonlinear critical layer analysis.

5.1. Inviscid core
In the inviscid core, we expand our fluid parameters as
 \begin{gather} u(x,y,t) =U(\kern0.7pt y)+\varepsilon U_M(\kern0.7pt y)+\varepsilon^2AF(\kern0.7pt y)\cos\xi+\cdots, \end{gather}
 \begin{gather}v(x,y,t) =\frac{\eta}{\textit{Re}}+\varepsilon^2AG(\kern0.7pt y)\sin\xi+\cdots, \end{gather}
 \begin{gather}p(x,y,t) =\varepsilon^2AP(\kern0.7pt y)\cos\xi+\cdots, \end{gather}
where  $\xi =\alpha (x-ct)$. Substituting (5.2) into (2.3) gives us the governing equations
 \begin{gather} \alpha F(\kern0.7pt y) =G'(\kern0.7pt y), \end{gather}
 \begin{gather}U''(\kern0.7pt y)G(\kern0.7pt y) =(U(\kern0.7pt y)-c)(G''(\kern0.7pt y)-\alpha^2G(\kern0.7pt y)), \end{gather}
 \begin{gather}P(\kern0.7pt y) =\alpha^{{-}1}(U'(\kern0.7pt y)G(\kern0.7pt y)-(U(\kern0.7pt y)-c)G'(\kern0.7pt y)), \end{gather}
 \begin{gather}U_M''(\kern0.7pt y) =\eta U_M'(\kern0.7pt y), \end{gather}
where  $'$ denotes a derivative with respect to
 $y$. These equations are subject to the inviscid conditions
 $G(\pm 1)=0$, as well as jump conditions across the critical layer. As discussed in § 2, the
 $\eta <0$ case can be transformed into the
 $\eta >0$ case by appropriate choice of coordinate system and frame of reference, so we can restrict ourselves to
 $\eta >0$ without loss of generality. This means that from (5.3d), we have a piecewise exponential mean flow distortion. We expect continuity of
 $U_M(\kern0.7pt y)$ over the critical layer; however, the derivative of
 $U_M(\kern0.7pt y)$ is necessarily discontinuous as we shall see below. Solving (5.3d) subject to these boundary conditions gives
 \begin{align} U_M(\kern0.7pt y)=\begin{cases}
A_1(1-\exp({\eta(\kern0.7pt y+1)})) & \text{if }-1\leqslant y<
y_c,\\
A_1\left(\dfrac{1-\exp({\eta(\kern0.7pt y_c+1)})}{1-\exp({\eta(\kern0.7pt y_c-1)})}\right)(1-\exp({\eta(\kern0.7pt y-1)}))
& \text{if }y_c< y\leqslant1.
\end{cases}
\end{align}
It is clear that  $U_M(\kern0.7pt y)$ cannot have a continuous derivative and be non-trivial, and hence the constant
 $A_1$ is determined by the jump condition of
 $U_M'(\kern0.7pt y)$ over the critical layer. The size of this jump is given by
 \begin{align} J_{CL} =U_M'(\kern0.7pt y_c^+)-U_M'(\kern0.7pt y_c^-) =\eta A_1{\rm e}^{\eta y_c} \bigg[ {\rm e}^\eta -\bigg(\frac{1-{\rm e}^{\eta(\kern0.7pt y_c+1)}}{1-{\rm e}^{\eta(\kern0.7pt y_c-1)}}\bigg) {\rm e}^{-\eta} \bigg]. \end{align}
Next, the Rayleigh equation (5.3b) is solved to find  $G(\kern0.7pt y)$. We also have the boundary conditions
 $G(\pm 1)=0$ and a jump condition over the critical layer. It is expected that when solving for
 $y>y_c$, there will be a term of the form
 $(\kern0.7pt y-y_c)\ln (\kern0.7pt y-y_c)$ in the Frobenius solution for
 $G(\kern0.7pt y)$ that leads to a logarithmic singularity in
 $F(\kern0.7pt y)$. Since we are assuming a strongly nonlinear critical layer, the appropriate jump condition to continue the solution to
 $y< y_c$ will be to replace this logarithmic term with
 \begin{equation} (\kern0.7pt y-y_c)\ln|y-y_c|, \end{equation}
as done in other studies (see for example Bodonyi et al. Reference Bodonyi, Smith and Gajjar1983; Walton Reference Walton2003; Walton & Barnes Reference Walton and Barnes2023). A full explanation of this nonlinear phase shift condition can be found from Ruban et al. (Reference Ruban, Gajjar and Walton2023). While it is common to solve the Rayleigh equation numerically, the specific form of the base flow (2.2a,b) allows us to take a semi-analytic approach. This approach is described in Appendix A and culminates in (A4) defining the relationship between  $\alpha$ and
 $c$. The normalising condition used was
 $G(\kern0.7pt y_c)=1$.
The relationship between  $\alpha$ and
 $c$ that results from (A4) is shown in figure 14. Perhaps the most important property to discuss is the existence of solutions. None of the curves in figure 14 span the full domain
 $0\leqslant c\leqslant 1$. Furthermore, it is known that solutions do not exist at
 $\eta =0$ (pure plane Couette flow), so it is important to establish the parameter space for which solutions can be found. We will now show that solutions exist given sufficiently strong throughflow, so we define
 $\eta _c$ such that solutions in figure 14 exist for all
 $\eta \geqslant \eta _c$.


To identify  $\eta _c$, we consider the limit
 $\alpha \ll 1$. From figure 14, it seems that to leading order, the wavespeed remains
 $\mathit {O}(1)$ and so we set
 $c=c_0$ to be determined. Substituting this limit into (5.3b) leads to the simplified equation
 \begin{equation} G(\kern0.7pt y)U''(\kern0.7pt y) =(U(\kern0.7pt y)-c_0)G''(\kern0.7pt y), \end{equation}
which can be solved analytically. Solving (5.7) subject to  $G(\pm 1)=0$ and the jump condition (5.6) for a non-zero solution results in the solvability condition
 \begin{equation} c_0(1-c_0) \ln\frac{\kappa_0(1-c_0)}{(1+\kappa_0)c_0} +\kappa_0+c_0 =0,\quad \kappa_0=\frac{{\rm e}^{-\eta}}{2\sinh\eta}. \end{equation}
For a given  $\eta$, (5.8a,b) can be solved for
 $c_0$ and two branches of solutions are shown in figure 15. These two branches correspond to the upper and lower values of
 $c$, between which we found solutions in figure 14. The behaviour of these branches for large
 $\eta$ can be derived as
 \begin{equation} c_0 =1+\frac{1}{W_{{-}1}(-{\rm e}^{{-}2\eta})},\quad c_0 =\zeta {\rm e}^{{-}2\eta}, \end{equation}
on the upper and lower branches, respectively, where  $\zeta =1/W_0(1/e)\approx 3.5911$ is the solution to the equation
 $\zeta (\ln \zeta -1)=1$ and
 $W_k(x)$ is the
 $k$th branch of the Lambert
 $W$-function. These approximations are also shown in figure 15 and visually agree with the true solution for
 $\eta \gtrsim 4$. The rates at which the upper and lower branches tend to 1 and 0, respectively, explain why as
 $\eta$ increases, we see
 $c\to 0$ more rapidly than
 $c\to 1$ in figure 14.
Leading order wavespeed in the long-wavelength limit for varying throughflow strength. The dotted lines are the asymptotic approximations given in (5.9a,b).

It can be shown that when varying  $c_0$, the minimum of the left-hand side of (5.8a,b) always occurs at
 $c_0=0.5$. It follows that solutions to (A4) only exist when the left-hand side of (5.8a,b) with
 $c_0=0.5$ is
 $\leqslant 0$. Setting
 $c_0=0.5$ and
 $\kappa _c={\rm e}^{-\eta _c}/2\sinh \eta _c$ gives the equation
 \begin{equation} \ln\frac{\kappa_c}{1+\kappa_c}+4\kappa_c+2=0, \end{equation}
which can be solved numerically for  $\kappa _c$ and hence
 $\eta _c$. This allows us to efficiently find
 $\eta _c$ to arbitrary precision and it is found that
 $\eta _c\approx 1.1997$. This is significantly smaller than the critical throughflow number for the linear stability analysis at finite Reynolds number
 $\eta ^{\ell }_c\approx 3.3511$. As well as the relation in figure 14, solving (5.3b) has given us an expression for
 $G(\kern0.7pt y)$ and its derivative which can be used in other layers as appropriate. The values of
 $G'(\pm 1)$ are of great importance and have been shown in figure 16. We always have
 $G'(1)<0$ and
 $G'(-1)>0$, but the relative sizes of both values varies with
 $c$ and
 $\eta$.
Values of (a)  $G'(1)$ and (b)
 $G'(-1)$ for each solution to the Rayleigh equation shown in figure 14.

To complete our leading order description of this system, we must find  $A$,
 $J_{CL}$ as defined in (5.5) and the expansion parameter
 $\varepsilon$ in terms of
 $\textit {Re}$. Doing so requires a leading order description of the wall layers and critical layer; we start with the former.
5.2. Wall layers
In the lower wall layer, the order one coordinate used is  $Y_-=\textit {Re}^{1/2}(\kern0.7pt y+1)$ and our expansions are
 \begin{gather} u(x,Y_-,t) =U(\kern0.7pt y)+\varepsilon^2\tilde{u}^{(-)}(\xi,Y_-)+\cdots+\varepsilon\textit{Re}^{{-}1/2}u_M^{(-)}(Y_-)+\cdots, \end{gather}
 \begin{gather}v(x,Y_-,t)=\frac{\eta}{\textit{Re}}+\varepsilon^2\textit{Re}^{{-}1/2}\tilde{v}^{(-)}(\xi,Y_-)+\cdots, \end{gather}
 \begin{gather}p(x,Y_-,t)=\varepsilon^2\tilde{p}^{(-)}(\xi,Y_-)+\cdots. \end{gather}
This system is subject to no penetration and no slip at  $Y_-=0$ and matching to the inviscid core as
 $Y_-\to \infty$. It can be shown that the leading order velocities take the form
 \begin{gather} \tilde{u}^{(-)}(\xi,Y_-) =\tfrac{1}{2}\tilde{U}^{(-)}(Y_-){\rm e}^{\mathrm{i}\xi}+\text{c.c.}, \end{gather}
 \begin{gather}\tilde{v}^{(-)}(\xi,Y_-) =\tfrac{1}{2}\tilde{V}^{(-)}(Y_-){\rm e}^{\mathrm{i}\xi} +\text{c.c.}, \end{gather}
where  $U^{(-)}(Y_-)$ and
 $V^{(-)}(Y_-)$ can be found analytically. We also require the mean-flow distortion solution
 $u_M(Y_-)$, which requires inspection of the next order of equations. Substituting (5.11) into (2.3b), the terms of order
 $\varepsilon ^4$ are investigated. The inertial contribution is
 \begin{align}
\alpha\tilde{u}^{(-)}\frac{\partial\tilde{u}^{(-)}}{\partial\xi}
+\tilde{v}^{(-)}\frac{\partial\tilde{u}^{(-)}}{\partial
Y_-} =\frac{1}{4}(
(\mathrm{i}\alpha\tilde{U}^{(-)2}
+\tilde{V}^{(-)}\tilde{U}^{(-)\prime}) {\rm
e}^{2\mathrm{i}\xi}
+\tilde{U}^{(-)\prime}\overline{\tilde{V}^{(-)}}
+\text{c.c.} ), \end{align}
which must be balanced by viscosity and pressure gradient effects. Crucially, (5.13) contains a term independent of  $\xi$, which can only be balanced by the mean flow distortion. For this to occur, we need a balance between the
 $\varepsilon ^4$ terms and the leading order mean flow distortion of magnitude
 $\varepsilon \textit {Re}^{-1/2}$ from (5.11a) giving the scaling
 \begin{equation} \varepsilon=\textit{Re}^{{-}1/6}. \end{equation}
This scaling is typical of a nonlinear critical layer study (see for example Smith & Bodonyi Reference Smith and Bodonyi1982b; Walton Reference Walton2003; Walton & Barnes Reference Walton and Barnes2023). The lower wall analysis can then be completed by finding  $u_M^{(-)}(Y_-)$. The upper wall layer uses the order one coordinate
 $Y_+=\textit {Re}^{1/2}(1-y)$ and the same method to find the leading order description.
5.3. Critical layer and amplitude equation
This leaves only the critical layer in which to determine the leading order solution. To complete our analysis, the first five orders must be considered which leads to a lengthy calculation. This allows us to quantify the jump in the mean flow distortion over the critical layer,  $J_{CL}$. Then, by considering a net vorticity jump across all layers, an equation for the amplitude
 $A$ can be obtained. The details can be found in other studies (Kumar & Walton Reference Kumar and Walton2019; Walton & Barnes Reference Walton and Barnes2023) with adjustments being made due to the addition of throughflow. It is found that the jump in the derivative of the mean flow distortion over the critical layer is given by
 \begin{equation} J_{CL} =\frac{2^{5/2}{\rm \pi} q_2(\kern0.7pt y_c)\varTheta} {(\alpha q_1(\kern0.7pt y_c))^{1/2}} A^{1/2}G(\kern0.7pt y_c)^{1/2}, \end{equation}
and the amplitude is given by
 \begin{equation} A =8\alpha^{1/3}\biggl(
-{\rm \pi}\varTheta q_2(\kern0.7pt y_c) \sqrt{\frac{G(\kern0.7pt
y_c)}{q_1(\kern0.7pt y_c)}} \biggr)^{2/3} \left(
\frac{G'(1)^2}{\mu^{(+)}}-\frac{G'({-}1)^2}{\mu^{(-)}}
\right)^{{-}2/3}, \end{equation}
where
 \begin{equation} q_n(\kern0.7pt y)
=\frac{1}{n!}\frac{\mathrm{d}^nU}{\mathrm{d}y^n},\quad
\mu^{(+)} =\sqrt{\frac{\alpha(1-c)}{2}},\quad \mu^{(-)}
=\sqrt{\frac{\alpha c}{2}}
\end{equation}
and
 \begin{equation}
\varTheta =\int_1^\infty\biggl(\int_0^{2{\rm \pi}}
(s-\cos\xi)^{{-}1}\,\mathrm{d}\xi \biggr)^{{-}1}
-\frac{1}{2{\rm \pi} s^{1/2}}\,\mathrm{d}s -\frac{1}{\rm \pi}
\approx{-}0.3103.
\end{equation}
Using the solution found to (5.3b), all terms in (5.16) are known and  $A$ can be calculated. The results are shown in figure 17. Observe that the amplitude is only real-valued for a subset of the values for which we found solutions in figure 14, as this requires the final bracketed term in (5.16) to be positive. It can be seen from figure 16 that this will not always be true.
Amplitude  $A$ plotted for varying values of
 $c$ and
 $\eta$.

With this additional information, the relationship between  $\alpha$ and
 $c$ is shown again in figure 18, but now it is indicated where a real amplitude exists with a solid line. As
 $\eta$ is increased, a solution exists for a greater proportion of each curve. This tells us that faster throughflow results in our asymptotic structure existing for a greater range of wavespeeds.
Relationship found between  $\alpha$ and
 $c$ from the Rayleigh equation (5.3b). The lines are solid where a non-negative real amplitude exists and dotted where no such amplitude exists.

By considering the  $1\ll \eta \ll \mathit {O}(\textit {Re})$ limit of this asymptotic structure, it can be demonstrated that a real amplitude exists for the entire domain
 $0\leqslant c\leqslant 1$. Thus, asymptotically large throughflow can enable our asymptotic structure to exist for the entire domain of wavespeeds available. It is not until
 $\eta \sim \mathit {O}(\textit {Re})$ that the structure breaks down.
6. Comparison between strongly nonlinear numerical and asymptotic results
Across §§ 4 and 5, the strongly nonlinear stability of Couette flow subject to a constant throughflow has been investigated both numerically and analytically. At finite  $\textit {Re}$, we can compute solutions to arbitrary accuracy at precise values of the parameters
 $\textit {Re},\eta,\hat {A}$. Unfortunately, this comes at a large computational cost. A
 $[(2N+1)(M+1)+2]\times [(2N+1)(M+1)+2]$ matrix must be inverted several times to find solutions, and small steps in
 $\textit {Re},\eta,\hat {A}$ must be used to ensure convergence. There are also issues with convergence as
 $\eta$ or
 $\textit {Re}$ become large, as well as a large number of modes
 $N$ being required once
 $\eta,\textit {Re},\hat {A}$ vary significantly from their values on the linear neutral curve. Typical values of
 $(M,N)$ required to achieve satisfactory convergence can be as large as
 $(300,40)$.
The strongly nonlinear asymptotic analysis avoids issues of convergence and gives us a precise description of the flow, as well as an understanding of the various internal mechanisms that interact to produce the solution. However, strictly speaking, the theory is only valid if  $\textit {Re}$ is asymptotically large. It is therefore fair to question the practical applicability of such a solution compared with high-precision numerics.
Given that we have produced both types of solutions, we can compare them to provide some insight into the answer to this question. In figure 19, the mean flow distortion and first mode of the numerical solution have been shown with  $\eta =6,\textit {Re}={500\,000},\hat {A}=5\times 10^{-3}$ for which
 $c\approx 0.665$. Examining the expansions used for the nonlinear modes in (4.1) and for the asymptotic solution in (5.2), it is evident that we should compare
 $\hat {u}_0(\kern0.7pt y)$ to
 $\varepsilon U_M(\kern0.7pt y)$ for the mean-flow distortion and
 $\hat {v}_1(\kern0.7pt y){\rm e}^{\mathrm {i}\hat {\xi }}+\text {c.c.}$ to
 $\varepsilon ^2AG(\kern0.7pt y)\sin \xi$ for the first harmonic. For the latter terms, an appropriate phase must be chosen for the comparison. Equation (4.2g) implies that
 ${\rm Re}(\hat {v}_1(0))\approx 0$ and hence
 $\hat {v}_1(\kern0.7pt y){\rm e}^{\mathrm {i}\hat {\xi }}+\text {c.c.}\sim \pm 2{\rm Im}(\hat {v}_1(\kern0.7pt y))\sin \xi$. This is a fairly crude approximation, but ensures the phase of the solutions is similar without explicit numerical matching. The
 $\pm$ sign is due to the travelling-wave coordinate
 $\xi$ for each solution only being equivalent up to a phase shift of
 ${\rm \pi}$. For the parameter values chosen, it was found that the
 $+$ sign was appropriate. We therefore plot the quantity
 $2{\rm Im}(\hat {v}_1(\kern0.7pt y))$ in figure 19 as a representation of the first mode of the numerical solution. As a comparison, we also show the asymptotic solution for the parameter values
 $\eta =6$,
 $c=0.665$ and
 $\varepsilon ={500\,000}^{-1/6}$ with the appropriate amplitude
 $A$ calculated from (5.16). We can see encouraging agreement between the two solutions for both the mean-flow distortion and the first harmonic. To improve the agreement, a second numerical solution at a larger Reynolds number
 $\textit {Re}={5\,000\,000}$ has been added to the figure. An amplitude of
 $\hat {A}=1.8\times 10^{-3}$ was chosen for this solution, as this corresponds to a similar wavespeed to the previous solutions. The Reynolds number of each numerical solution is indicated by the subscripts in the legend in figure 19. The numerical solutions have also been scaled to remove the dependence of their magnitude on
 $\textit {Re}$.
Both the leading order analytic and numeric solutions for (a) the mean flow distortion and (b) the leading order vertical component. Each curve has  $\eta =6$ and appropriate parameters are chosen so that
 $c\approx 0.665$ to give a fair comparison. The Reynolds numbers of the numerical solutions are given as an additional subscript in the legend.

The values used in figure 19 result, via (5.14), in asymptotic parameters  $\varepsilon \approx 0.1122$ and
 $\varepsilon \approx 0.07647$ for
 $\textit {Re}={500\,000}$ and 5 000 000, respectively. These are both relatively large expansion parameters for an asymptotic approach. However, the general distribution and magnitude of the asymptotic solutions do match with those arising from a purely numerical solution. It should be emphasised that the only matching between the solutions in figure 19 involves the phase and wavespeed, and there are no additional fitting parameters. The comparison in figure 19 is typical and similar comparisons can be made for each of the results in figure 11. Comparing the two numerical results, it is clear that the increase in
 $\textit {Re}$ does result in an improvement in the agreement. As
 $\hat {A}$ approaches its maximum value, the comparison becomes worse, due to the phase condition for the matching becoming less accurate and the breakdown of the asymptotic structure, as seen in figure 11(d), where the first harmonic no longer dominates the flow.
7. Conclusion
In this paper, both the linear and nonlinear stability of Couette flow with a constant throughflow have been analysed.
It was shown that throughflow linearly destabilises Couette flow beyond a critical throughflow number of  $\eta ^{\ell }_c\approx 3.3511$. As
 $\eta$ becomes asymptotically large, a multi-deck upper and lower branch structure was found to emerge. Using these structures, a leading order asymptotic description of each branch of the linear neutral curve was obtained and this was seen to approximate well the numerically computed branches at sufficiently large
 $\eta$ and
 $\textit {Re}$, as shown in figure 6.
Nonlinear travelling wave solutions to the Navier–Stokes equations were then found at finite Reynolds numbers. These solutions showed a strongly subcritical bifurcation from the linear neutral curve which agreed with a weakly nonlinear analysis. Using a throughflow number of  $\eta =6$, it was found that the nonlinear critical number was
 $\textit {Re}_c\approx {19\,200}$, far smaller than the corresponding linear critical Reynolds number
 $\textit {Re}^{\ell }_c\approx {357\,769}$. This trend can be seen for a range of values of
 $\eta$ by comparing figures 3(a) and 10. It was found that increasing
 $\eta$, raised both the linear and nonlinear critical Reynolds numbers, supporting the idea that throughflow delays the laminar–turbulent transition.
Using strongly nonlinear critical layer theory, a self-sustaining structure was found for an asymptotically large Reynolds number. This structure exists for a throughflow number greater than  $\eta _c\approx 1.1997$, which is much lower than the value required for linear instability
 $\eta ^{\ell }_c$. This asymptotic structure remains valid until
 $\eta \sim \mathit {O}(\textit {Re})$, at which stage the throughflow is comparable in magnitude with the streamwise component of the base flow.
The finite  $\textit {Re}$ and asymptotic solutions were compared in figure 19, and it was found that the asymptotic solution approximated the fully nonlinear numerical solutions even at moderate Reynolds numbers of
 $\mathit {O}(10^5)$. The agreement between these methods provides both a partial check on the results and confirms the applicability of the asymptotic approach.
The work presented could be extended in numerous ways to further explore the effect of throughflow. One avenue would be to investigate how the existing three-dimensional coherent structures in plane Couette flow (Waleffe Reference Waleffe1998; Deguchi & Hall Reference Deguchi and Hall2014) are affected by the introduction of a throughflow component. Other flow geometries could be considered to determine whether the stabilising effect of throughflow is reliant on the Cartesian geometry used in most studies. The dynamics within the porous walls could also be modelled using an equation such as Darcy's law. The linear stability of such a system has been explored for both Poiseuille (Yu Reference Yu2024) and Couette (Shankar & Shivakumara Reference Shankar and Shivakumara2021) flow. The linear instabilities in these problems could be used to generate nonlinear neutral surfaces with throughflow found as part of the solution, enabling more realistic and complex models. Finally, given the applications to improving aerodynamics, the addition of compressible effects would help model more realistically the potential benefits of throughflow in practical applications.
Funding
J.C. would like to thank the Mathematics Department at Imperial College London for the award of a Roth scholarship.
Declaration of interests
The authors report no conflict of interest.
Appendix A. Analytic solution to the Rayleigh equation with finite throughflow
To solve (5.3b) semi-analytically, we first substitute (2.2a) into (5.3b) and make the substitution  $z=-\eta (\kern0.7pt y-y_c)$ to obtain the equation
 \begin{equation} G''(\kern0.7pt y)-\tilde{\alpha}^2G(\kern0.7pt y) =\frac{1}{1-{\rm e}^z}G(\kern0.7pt y). \end{equation}
The previous notation defined in (3.4b),  $\tilde {\alpha }=\alpha /\eta$, is used for simplicity. We then set
 $\beta =\sqrt {\tilde {\alpha }^2+1}$,
 $w=1-{\rm e}^z$ and
 $G(\kern0.7pt y)={\rm e}^{\beta z}f(w)$. Substituting these definitions into (A1), it can be shown that
 $f(w)$ satisfies the equation
 \begin{equation} w(1-w)\frac{\mathrm{d}^2f}{\mathrm{d}w^2}-(2\beta+1)w\frac{\mathrm{d}f}{\mathrm{d}w}-f=0. \end{equation}
This is a hypergeometric equation and has a standard solution given by DLMF (2024, Chapter 15). Our domain is  $-1\leqslant y\leqslant 1$, which corresponds to a domain for
 $w$ of
 $1-\exp ({\eta (\kern0.7pt y_c+1)})\leqslant w\leqslant 1-\exp ({\eta (\kern0.7pt y_c-1)})$. Since
 $-1\leqslant y_c\leqslant 1$, this means
 $w=0$ is always in our domain and the domain can extend outside
 $-1\leqslant w<1$. Given this, a value of
 $w_{0} \in (-1,0)$ exists such that our solution can be written piecewise, as an infinite series within
 $|w|<-w_0<1$ and as a combination of hypergeometric functions for
 $w< w_0$. In particular,
 \begin{gather} G(\kern0.7pt y)={\rm e}^{\beta z} \begin{cases} Ay_1(1-{\rm e}^z)+By_2(1-{\rm e}^z) & \text{for }1-{\rm e}^z>w_0,\\ Cy_3(a,b;1-{\rm e}^z)+Dy_3(b,a;1-{\rm e}^z) & \text{for }1-{\rm e}^z< w_0, \end{cases} \end{gather}
 \begin{gather}y_1(w)=w{}_2F_1\left(a+1,b+1,2;w\right), \end{gather}
 \begin{gather} y_2(w)=y_1(w)\ln|w| +\frac{1}{ab}+\sum_{n=1}^\infty\frac{(a+1)_n(b+1)_n}{(2)_nn!} [\psi(a+1+n)+\psi(b+1+n)\nonumber\\ -\psi(n+2)-\psi(n+1)]w^{n+1}, \end{gather}
 \begin{gather} y_3(m,n;w) =({-}w)^{{-}m}{}_2F_1\Big(m,m+1,m-n+1;\frac{1}{w}\Big), \end{gather}
where  $A,B,C,D$ are arbitrary constants,
 ${}_2F_1$ is the hypergeometric function,
 $\psi (z)$ is the digamma function,
 $(x)_n$ is the rising factorial,
 $a=\beta -\tilde {\alpha }$ and
 $b=\beta +\tilde {\alpha }$. The choice of
 $-1< w_0<0$ is arbitrary, but the series in (A3c) diverges as
 $w\to -1$ and the lower region of (A3a) has an input which diverges to
 $\infty$ as
 $w\to 0$. With this in mind,
 $w_0=-0.5$ was chosen. The solution in (A3) satisfies (5.3b) and the jump condition (5.6), so it remains to apply our boundary conditions. These are that
 $G(\pm 1)=0$ and the match between the upper and lower region at
 $w=w_0$ for both
 $G(\kern0.7pt y)$ and its derivative. The function is also normalised by setting
 $G(\kern0.7pt y_c)=1$, which is equivalent to choosing
 $B=1$. This gives the eigenrelation
 \begin{gather} Ay_1'(w_0)+y_2'(w_0) =Cy_3'(a,b;w_0)+Dy_3'(b,a;w_0), \end{gather}
 \begin{gather}A={-}\frac{y_2(1-\exp({\eta(\kern0.7pt y_c-1)}))}{y_1(1-\exp({\eta(\kern0.7pt y_c-1)}))}, \end{gather}
 \begin{gather}C=C_0D, \end{gather}
 \begin{gather}C_0={-}\frac{y_3(b,a;1-\exp({\eta(\kern0.7pt y_c+1)}))} {y_3(a,b;1-\exp({\eta(\kern0.7pt y_c+1)}))}, \end{gather}
 \begin{gather}D=\frac{Ay_1(w_0)+y_2(w_0)} {C_0y_3(a,b;w_0)+y_3(b,a;w_0)}, \end{gather}
where the derivatives in (A4a) are with respect to  $w$ and can be found analytically in terms of hypergeometric functions using the identities in DLMF (2024, Chapter 15). Equation (A4) is then solved numerically to obtain the eigenrelation between
 $\alpha$ and
 $c$.


 Open access

