





1. Introduction
Generating useful output from a coaxial plasma gun (CPG) requires a quantitative understanding of the plasma dynamics of its sheath formation and propagation. To achieve the desired benchmark accelerator exit performance, this can be accomplished by optimising the plasma parameters informed from diagnostics, including triple probes for electron temperature and density (Chen & Sekiguchi Reference Chen and Sekiguchi1965; Schmidt et al. Reference Schmidt, Laufer, Herdrich and Hyde2025), multi-chord heterodyne interferometry for electron density and bulk time of flight (Merritt et al. Reference Merritt, Lynn, Gilmore and Hsu2012a
,
Reference Merritt, Lynn, Gilmore, Thoma, Loverich and Hsub
) and B-dot probes for vector magnetic field evolution (Moffett et al. Reference Moffett, Chesny, Cole, Hatfield and Rusovici2022). However, an intermediate step prior to deploying diagnostics can be comparing the plasma morphology with computational modelling. Generalised models of the behaviour of initial plasma ionisation and rundown phase propagation during the operation of a CPG can be described using either the one-dimensional (1-D) snowplough model (Mather Reference Mather1965; Hart Reference Hart1962, Reference Hart1964), the slug model (Mostov, Neuringer & Rigney Reference Mostov, Neuringer and Rigney1961; Powell & Batteh Reference Powell and Batteh1981, Reference Powell and Batteh1983) or deflagration (Cheng Reference Cheng1970), and each are well supported by experiment (Herziger et al. Reference Herziger, Krompholz, Schneider and Schönbach1979; Price Reference Price1988; Stepanov et al. Reference Stepanov, Shumlak, McLean, Nelson, Claveau, Forbes, Weber and Zhang2020). The initial plasma formation assumptions of these models are fundamentally different in that the snowplough model assumes an infinitely thin plasma sheet that sweeps up and fully ionises neutral gas (Hart Reference Hart1962) while the slug model considers a finite sheath thickness of constant mass (Powell & Batteh Reference Powell and Batteh1981). In contrast, deflagration is an ignition wave across a low-pressure front that does not sweep up neutral particles into a sheath. However, certain assumptions are identical across these models, including a perfectly conducting plasma where the magnetic field pushes the sheath from behind (Herziger et al. Reference Herziger, Krompholz, Schneider and Schönbach1979). In the snowplough model, this
 $\boldsymbol{J} \times \boldsymbol{B}$
force resulting from the radial current density
 $\boldsymbol {J}$
and generated azimuthal magnetic field
 $\boldsymbol {B}$
accelerate the plasma sheath axially down the electrodes in the rundown phase, and then over the end of the electrodes in the runover phase (Tang, Adams & Rusnak Reference Tang, Adams and Rusnak2010). In these two models, this axial acceleration phase is identical and is well quantified analytically (Mostov et al. Reference Mostov, Neuringer and Rigney1961; Price Reference Price1988; Stepanov et al. Reference Stepanov, Shumlak, McLean, Nelson, Claveau, Forbes, Weber and Zhang2020; Datta, Meier & Shumlak Reference Datta, Meier and Shumlak2024). It is the snowplough and slug models with their rundown mode behaviours and carrying the densest plasma sheath that we will focus upon in this paper to characterise accelerator performance.
In practice, a radial gradient in this axial
 $\boldsymbol {J} \times \boldsymbol {B}$
force can cause disparate axial velocities within the sheath known as blow-by (Baker et al. Reference Baker, Horton, Hwang, Evans and Howard2002; Cassibry, Thio & Wu Reference Cassibry, Thio and Wu2006). In straight coaxial electrodes, the magnetic field falls off radially
 $\propto r^{-1}$
following the thin straight current-carrying wire approximation (Subramaniam & Raja Reference Subramaniam and Raja2017; Stepanov et al. Reference Stepanov, Shumlak, McLean, Nelson, Claveau, Forbes, Weber and Zhang2020) while the magnetic pressure is proportional to
 $r^{-2}$
from
 $|B|^{2} / 2 \mu _{0}$
, where
 $\mu_{0}$
is the permeability of free space. Therefore, for a true 1-D slug-type rundown acceleration, the initial radial density profile should closely match the
 $r^{-2}$
dependence (Cassibry et al. Reference Cassibry, Thio and Wu2006). Deviations from this ideal behaviour may result in blow-by during the rundown phase and a rather less predictable evolution of density and magnetic field profiles of the plasma sheath. Since this may not be desired for CPG applications, the ability to predict these non-ideal distributions in spite of blow-by is a useful exercise. This paper is focused on verifying the plasma properties and morphology of operational CPG rundown dynamics for future applications (see below). Considerations of the empirical axial acceleration and quantification of its off nominal behaviour compared with the 1-D snowplough model is the focus of this manuscript.
Two-dimensional (2-D) axisymmetric magnetohydrodynamic (MHD) models of CPGs (Sitaraman & Raja Reference Sitaraman and Raja2014; Subramaniam & Raja Reference Subramaniam and Raja2017) are widely successful in mimicking the observed plasma dynamics and properties, and can accurately predict the evolution of numerous profiles, including mass density, pressure, electric and magnetic fields and velocity. Therefore, to a significant extent, first approximations about the operation of a CPG electrode geometry can be quantified through 2-D axisymmetric resistive MHD modelling. We describe an open-source 2-D axisymmetric code that was used to decipher the differences between the empirical nature of the plasma sheath propagation in an operational gas puff CPG in comparison with the ideal 1-D snowplough rundown phase.
We have custom constructed and operated a solid-state switched CPG for a future application to study the onset and evolution of torsional magnetic reconnection (TMR (Pontin & Galsgaard Reference Pontin and Galsgaard2007; Priest & Pontin Reference Priest and Pontin2009; Pontin, Al-Hachami & Galsgaard Reference Pontin, Al-Hachami and Galsgaard2011; Pontin Reference Pontin2011)). This study is meant to benchmark the operation of this CPG as a direct comparison with its use in future experiments. In TMR, a global radial 3-D null point following the fan-spine topology (Parnell et al. Reference Parnell, Smith, Neukirch and Priest1996) is perturbed by an azimuthal magnetic field applied to either the spine axis (torsional fan mode (Hosseinpour Reference Hosseinpour2014a ; Chesny et al. Reference Chesny, Orange and Hatfield2021b )) or to the fan plane (torsional spine mode (Hosseinpour Reference Hosseinpour2014b ; Chesny, Hatfield & Moffett Reference Chesny, Hatfield and Moffett2024)). In each case, collimated high-speed particle acceleration can be exploited for any number of applications, including high-power electric propulsion and plasma jet magneto-inertial fusion (PJMIF (Cassibry, Stanic & Hsu Reference Cassibry, Stanic and Hsu2013; LaJoie et al. Reference LaJoie2024)). While TMR has not yet been demonstrated in a laboratory environment, individual constituent hardware that can generate the requisite magnetic fields have been constructed and tested (Chesny et al. Reference Chesny, Orange and Dempsey2021a ; Chesny et al. Reference Chesny, Moffett, Cole, Baptiste and Orange2022a , Reference Chesny, Moffett, Hatfield, Cole, Landers, Shokrollahi and Egeb ; Moffett et al. Reference Moffett, Chesny, Cole, Hatfield and Rusovici2022) and this paper represents a deeper characterisation of the CPG that will be used in TMR tests.
The choice of a CPG is made to play two important roles in TMR. First, to generate an MHD plasma in which the frozen-in condition is satisfied, and second, to provide an azimuthal magnetic field internal to the plasma that will provide the perturbing force to induce TMR. Prior to a suite of diagnostic sensors being deployed on the CPG, fast imaging of ionisation and propagation are compared with resistive MHD modelling in this paper to (i) understand the initial plasma conditions leading to the observed CPG operation, and (ii) inform the placement of diagnostics. These future diagnostics can include triple probes, multi-chord laser interferometry and B-dot probe arrays. Quantifying plasma initiation and the manifestation of anomalous behaviour during the rundown phase of the CPG through resistive MHD modelling allows for prediction of the internal CPG plasma profiles, including the magnetic field.
The repeatable operation of the CPG that is key to building a fast imaging sequence was enabled using solid-state switching. Rather than using a triggered spark gap which is not ideal for long-duration operation, especially for repetitive pulsing of the order of 1–10 Hz, as would be required for electric propulsion or PJMIF applications, the computerised operation of solid-state switching provides digital control of the plasma discharge and thus a time-stamped benchmark for diagnostic sensor analyses. These also represented key system tests for future experimental TMR campaigns where
 $\unicode{x03BC}$
s-level multi-circuit simultaneity will play a larger role in ensuring plasma interactions with peak magnetic field strengths in high-power capacitive systems (Chesny et al. Reference Chesny, Moffett, Cole, Baptiste and Orange2022a
,
Reference Chesny, Moffett, Hatfield, Cole, Landers, Shokrollahi and Egeb
).
We describe the experimental set-up in § 2, the CPG operation in § 3 and the resistive MHD model in § 4. Numerical results are given in § 4.2 with a comparison of the CPG operation to snowplough and slug models in § 5. Then we discuss the results and conclude in §§ 6 and 7, respectively.
2. Experimental set-up
The CPG chamber is constructed from a 3’ (91.44 cm) long acrylic tube of 4” (10.16 cm) outer diameter and 3/8” (0.95 cm) thickness. The CPG is built into the left end of the tube so that insulated high-power connections are easily accessible on the outside. The right end cap is constructed with the vacuum pump line. The minimum background pressure using a roughing pump is consistently 67 Pa (0.5 Torr).
Cylindrically symmetric geometry of the CPG electrodes, to scale. The 0.32 cm wide gas puff injection is located on the left side and points to the right. Pressure sensors are located along the gas puff inlet line 18 in. to the left and along the vacuum line 12 in. to the right. Grey colour denotes copper electrodes, black is ceramic insulator and red shows the plasma discharge location. The cylindrical axis of symmetry is the lower horizontal boundary. This geometry is used in resistive MHD modelling (§ 4).

The CPG is constructed with a single 0.25” (0.64 cm) diameter inner electrode (the anode), 3” (7.62 cm) in length surrounded by six electrically connected outer electrodes (the cathode) of the same dimensions at an inter-electrode gap distance of 1” (2.54 cm). The cylindrically symmetric CPG dimensions are shown in figure 1 with the extended vacuum domain shown for MHD modelling purposes. The extended MHD model domain (22.86 cm) is chosen to match the approximate domain of the global shutter camera imaging described in § 3. The length of the CPG electrodes extend to 7.62 cm, and the plasma propagation will be shown to extend approximately twice the length past the ends of the electrodes. The electrodes are copper with a plastic insulator separating the inner electrode from the array of outer electrodes. The base of the inner electrode is a thin ceramic surface to facilitate plasma breakdown and sheath initiation. Axial gas puff injection is provided by four evenly spaced 0.125” (0.32 cm) diameter holes each at a radial distance of 0.5” (1.27 cm) in between the inner electrode and the array of outer electrodes. The four gas puff inlets are fed by a plenum volume held off from the atmosphere by a solenoid valve. The working gas is air.
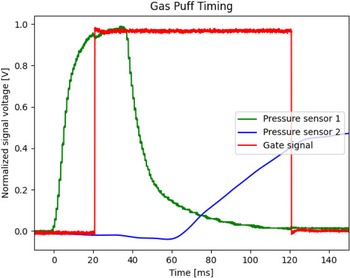
Gas puff tests to optimise the CPG trigger timing were performed and are shown in figure 2. Two pressure sensors were installed on the chamber system to monitor the gas input. The first is in line with the gas plenum and is located after the solenoid valve, and is approximately 18 in. from the CPG base. The second is at the far end of the chamber tube, approximately 12 in. past the vacuum tube outlet, to capture the pressure wave after it traverses the entire 3’ (91.44 cm) volume. At the initiation time of a 40 ms duration gas puff, the first sensor (green curve) shows a rise of pressure to a maximum value. The gas puff pressure wave reaches the pressure sensor on the far side of the chamber (blue curve)
 ${\approx}62$
ms after the gas puff initiation. The CPG trigger gate signal (red curve, 5 V DC) is therefore optimised to be given 20 ms after the initial pressure wave. This gas puff timing characterisation, including both the mechanical operation of the solenoid valve and the length of the tubing leading to each pressure sensor, was found to be extremely stable due to its time scale of the order of tens of milliseconds, whereas the metal-oxide-semiconductor field-effect transistor (MOSFET)-based digital control of the gas puff valve and gate signal are on the
 $\unicode{x03BC}$
s jitter level. Through a series of tests, these empirical timing optimisations were found to ensure that the plasma sheath breakdown occurs at the breech of the CPG. This is a direct diagnostic of the type of CPG gas puff initiation discussed in electric propulsion studies (Woodley, Horstman & Underwood 2025). While many CPGs operate using
 ${\sim}$
kV-level pulsed power to accomplish gas puff durations of the order of tens to hundreds of
 $\unicode{x03BC}$
s, that is an equipment upgrade that is left for future expansion, thus a full characterisation of the gas puff is out of the scope of this paper.
Gas puff pressure sensors with optimised CPG trigger timing. All signals are normalised to demonstrate relative timings. The rise time of a 40 ms gas puff (green line) reaches the other end of the chamber tube after
 ${\approx}2\,{\rm ms}$
(blue curve, smoothed response). The CPG 5 V gate signal (red line, 100 ms duration) is empirically timed to initiate plasma breakdown close to the rise of the gas puff peak.

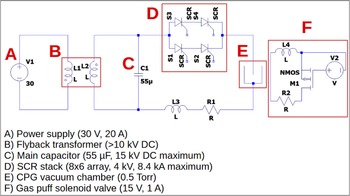
The CPG pulsed power circuit. Both the gas puff and main CPG pulse are fully solid-state switched.

Figure 3. Long description
A diagram of a coaxial plasma gun pulsed power circuit. Panel A: A power supply labeled V1 with a voltage of 30 volts. Panel B: A flyback transformer with labeled inductors L1 and L2. Panel C: A main capacitor labeled C1 with a capacitance of 55 microfarads. Panel D: An SCR stack consisting of eight SCRs arranged in a 4 by 2 array. Panel E: A CPG vacuum chamber. Panel F: A gas puff solenoid valve labeled V2 with a voltage of 15 volts. The diagram shows the connections between these components, illustrating the flow of electrical power through the circuit.
The pulsed power circuit driving the CPG is shown in figure 3. A flyback transformer charges a 55
 $\unicode{x03BC}\mathrm{F}$
, 15 kV (maximum) capacitor to 4 kV, with 440 J of stored energy. The gas puff is opened using a MOSFET triggered by a 5 V microcontroller signal to switch a DC power supply into the solenoid, as operated in figure 2, with its signal being sent 20 ms before the main CPG pulse. Another 5 V gate signal from the microcontroller triggers the silicon-controlled rectifier (SCR) stack to switch the stored 4 kV to the CPG electrodes for the main plasma ionisation stage. The SCR stack (see below), provided by Equilibria Power, is configured from 48 total thyristors into an 8x6 array (8 thyristors per series branch, 6 total parallel branches) to allow up to 4 kV and 8.4 kA of pulsed power. A custom built and calibrated Rogowski coil Moffett et al. (Reference Moffett, Chesny, Cole, Hatfield and Rusovici2022) monitors the main CPG current after the cathode of the SCR stack. Prior to the full 4 kV plasma shots, the CPG electrodes were shorted and a series of relatively low voltage discharges (a few
 ${\approx}10^{2}$
V) generate Rogowski coil outputs that are numerically integrated and compared with a known Hall effect current sensor output in series with the pulse. These discharges form a linear fit, with error bounds, that can be extrapolated to much higher
 ${\sim}10^{3} {-} 10^{4}$
A currents (Moffett et al. Reference Moffett, Chesny, Cole, Hatfield and Rusovici2022).
For the purposes of this study, a transition to solid-state switching from traditional gas switching (i.e. spark gaps) was made for two reasons, reliability and efficiency. Solid-state switching is a method of controlled electrical signalling using semiconductors, where instead of a physical stand-off distance between two electrodes in a gas switch, charge carriers in a semiconductor are modulated by an electric field (a gate signal) to transition the electrode standoff material from an insulating state to a conducting state. The gate signal is a low voltage (typically 3–5 V) bias applied to the electron depletion region between the source and drain leads of the device that transitions the semiconductor to a charge-carrying state. This gating operation can be initiated at the timing resolution of a microcontroller, thus providing the user digital command of the plasma breakdown process.
3. Experimental results
Understanding the topological details of the gas puff CPG operation and characterising its plasma morphology is enabled by the highly repeatable operation of this CPG architecture. A long-duration (1.6 s, f/5.6, ISO 200) image of one of the gas puffed, 4 kV CPG plasma discharges taken from a colour DSLR camera is shown in figure 4. It was seen that the plasma extends approximately twice the length of the CPG electrodes beyond the end of the electrodes, and it is our goal to elucidate and understand the plasma dynamics of the operation phases of this CPG. To accomplish this, we operate a 1.6-megapixel Raspberry Pi global shutter camera with a single-frame 8.721
 $\unicode{x03BC}$
s shutter speed. Since the camera is triggered digitally, the global shutter frame is configured to image the plasma at any desired digital delay within our control system and with respect to the digital gate signal sent to the solid-state switch array. In this fashion, we are able to image the plasma at any time step during its evolution. The repeatability provided by the solid-state switch enables a high-speed imaging analogue through an aggregate of shutter frames over multiple separate CPG shots. The results of this imaging produces a movie of the plasma evolution and propagation.
Long-duration DSLR camera image of a gas puffed 4 kV, 7.8 kA CPG discharge. The camera specifications are 1.6 s exposure time, f/5.6, ISO 200 and taken with four layers of 0.6 neutral density (ND) film over the lens to lower the peak brightness by a factor of 1/251.

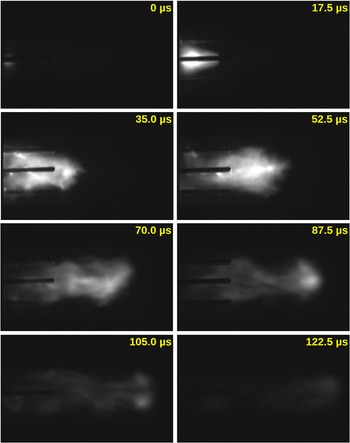
Global shutter camera imaging of the CPG operation is shown in figure 5 (left to right and top to bottom). The reliability and repeatability of the SCR stack allows the operation of the CPG at relatively identical behaviour across an indefinite number of shots. Thus, operating the CPG under the same voltage conditions and imaging each frame with a different digital delay given to the camera enables the build-up of a movie of the bulk plasma behaviour. Since the SCR stack and the global shutter camera are both triggered from a 5 V microcontroller signal, the delay time between the camera shutter opening and the plasma breakdown had to be determined empirically (
 ${\approx}200$
 $\unicode{x03BC}$
s). This initial delay was optimised so that the 8.7
 $\unicode{x03BC}$
s shutter opening time captured the initial plasma breakdown at the breech of the electrodes (figure 5, top left frame, 0
 $\unicode{x03BC}$
s). The key aspect of this earliest ionisation is the initial density profile inferred from the brightness close to the inner electrode. For a seed plasma density
 $\rho$
profile that falls off exponentially
 $\rho r^{\gamma }$
, the
 $\gamma$
value strongly affects the radial acceleration profile and can cause sheath blow-by due to velocity asymmetries (Cassibry et al. Reference Cassibry, Thio and Wu2006). Such blow-by is seen to be the case in the second frame at 17.5
 $\unicode{x03BC}$
s, where the plasma at small radii propagates down the inner electrode faster than at larger radii. With respect to the modes of CPG operation, we consider that this leading blow-by front may consist of a deflagration front that leads the brighter and denser plasma toward the back of the gun. Regardless, this deflagration will precede the rundown of the denser snowplough sheath as a blow-by condition. Such confirmation of the initiation of the snowplough rundown phase for this CPG is important for understanding the sheath propagation dynamics toward CPG applications. The effect of blow-by for CPG applications will be discussed in detail in § 6.
The leading plasma has passed by the end of the CPG electrodes by 35.0
 $\unicode{x03BC}$
s. Residual sheath rundown plasma has nearly filled the electrode gap volume and the fastest snowplough plasma has run over the inner electrode to compress just past the inner electrode tip. Bright filaments are seen along the inner and outer electrodes where continued snowplough ionisation occurs during this rundown phase. At 52.5
 $\unicode{x03BC}$
s, the bulk of the brightest plasma has exited the gun electrodes and compressed along the central axis into a disorganised pinch formation with circulating plasma filaments at larger radii forming the bulk. By 70.0
 $\unicode{x03BC}$
s, the bulk flow begins to disconnect from the electrodes in a weakly organised plasmoid at the front followed by plasma streams off the electrodes. This plasmoid is better seen to nearly detach at 87.5
 $\unicode{x03BC}$
s off the front and becomes slightly brighter at the plasmoid centre location. The plasmoid propagates and begins to fade at 105.0
 $\unicode{x03BC}$
s with a strong central void forming along the axis. The residual plasma plasmoid fades at 122.5
 $\unicode{x03BC}$
s as it fully detaches from the residual electrode plasma and collisionally dissipates with the background.
Global shutter camera frames (left to right, top to bottom) of eight separate 4 kV, 7.74 kA CPG shots, each with a 17.5
 $\unicode{x03BC}$
s digital delay from the previous shot. The camera lens is covered by three layers of 0.6 (ND film to lower the peak brightness by a factor of 1/63.

Figure 6 shows the current monitored by the Rogowski coil on the main discharge line. The raw signal (red solid) is numerically integrated and calibrated to the peak current (
 $7.74 \pm 0.39$
kA). Of note is the
 ${\rm d}i/{\rm d}t$
, where
 $i$
is the instantaneous current, calculated from the calibration routine (black dotted) from the empirically determined mutual inductance
 $M$
during the calibration routine as
 ${\rm d}i(t)/{\rm d}t = M v(t)$
. The peak
 ${\rm d}i/{\rm d}t$
is 334 A/
 $\unicode{x03BC}$
s, whereas the data sheet rating of each individual thyristor is 100–200 A/
 $\unicode{x03BC}$
s. Operationally exceeding this data sheet rating of any single component is achieved by the approximately equivalent sharing of the total current through each of the six parallel branches of thyristor strings (
 ${\approx}55$
A/
 $\unicode{x03BC}$
s per branch). The vertical green dotted lines are the timings of the global shutter image frames relative to the initial 5 V gate signal (solid black at
 $t=0$
), with approximate errors (shaded green). Each of the 8.721
 $\unicode{x03BC}$
s shutter windows is shown in grey shading and associates the imaging morphologies directly with the current evolution.
The initial ionisation includes the peak
 ${\rm d}i/{\rm d}t$
rise within the first
 ${\approx}20$
 $\unicode{x03BC}$
s. The blow-by seen in frame 2 at 17.5
 $\unicode{x03BC}$
s still occurs during the initial rise in current and before the peak. It is not until the plasma begins to run over the end of the gun in frame 3 at 35
 $\unicode{x03BC}$
s that the current reaches its peak value. The disorganised pinch dynamics in frame 4 at 52.5
 $\unicode{x03BC}$
s occurs near the end of the main current pulse. From there, the current decreases with some inductive ringing as the plasmoid forms, detaches from the electrodes, propagates into the background and ultimately dissipates.
Rogowski coil data from one of the eight identical 4 kV CPG shots. The initial black line at
 $t=0$
is the 5 V switch gate signal. The red solid line is the raw Rogowski coil voltage response. The blue solid line is the integrated and calibrated Rogowski coil current that peaks at
 ${\approx}7.74$
kA. The black dotted line overlaying the converted Rogowski coil data is the switch
 ${\rm d}i/{\rm d}t$
that peaks at 339 A/
 $\unicode{x03BC}$
s. The vertical green dotted lines are the camera trigger timings, with errors (green shaded). The grey shaded regions are the 8.7
 $\unicode{x03BC}$
s time windows of the open camera shutter.

Figure 6. Long description
A line graph titled Solid-state Switched C P G Discharge 4 kV. The horizontal axis represents Time in microseconds ranging from 0 to 140. The left vertical axis represents Plasma Current in kiloamperes ranging from 0 to 8. The right vertical axis represents Gate and Rogowski Coil Voltage in volts ranging from -200 to 300. The graph includes multiple data lines: a black line for the gate signal, a red line for the raw Rogowski coil voltage response, a blue line for the integrated and calibrated Rogowski coil current, and a black dotted line for the switch. Vertical green dotted lines indicate camera trigger timings with errors shown as green shaded regions. Grey shaded regions represent the 8.7 microsecond time windows of the open camera shutter. The plasma current peaks at around 7 kiloamperes, while the switch peaks at 339 amperes per second.
4. OpenMHD
To interpret the observed plasma dynamics and quantify the onset of blow-by resolved in global shutter imaging, we performed 2-D axisymmetric resistive MHD simulations using the open-source OpenMHD code. These simulations were designed to reproduce the experimentally observed sheath evolution and provide a controlled framework for comparing realistic plasma behaviour with idealised snowplough theory. By matching initial density and magnetic field profiles to experimental imaging, the modelling offers physical insight into the role of radial mass loading, initial conditions and boundary conditions (BCs) in driving sheath asymmetries. The results of matching the plasma profiles in comparison with the fast imaging can then be used as a benchmark to decipher locations of interest for future diagnostics.
4.1. Numerical set-up
The OpenMHD code is described by Zenitani & Miyoshi Reference Zenitani and Miyoshi2011 and has been used to study instabilities, shocks, turbulence and magnetic reconnection in low
 $\beta$
plasmas, where
 $\beta$
is the ratio of the thermal to magnetic pressure (Zenitani Reference Zenitani2015; Shimizu, Kondoh & Zenitani Reference Shimizu, Kondoh and Zenitani2017; Hosseinpour, Chen & Zenitani Reference Hosseinpour, Chen and Zenitani2018; Zenitani & Miyoshi Reference Zenitani and Miyoshi2020). OpenMHD is open-source and available for download at https://sci.nao.ac.jp/MEMBER/zenitani/openmhd-e.html. The resistive MHD equations used in this framework are made dimensionless with
 $\mu _{0}=1$
, enforcing the condition (Pontin & Galsgaard Reference Pontin and Galsgaard2007) that with dimensionless quantities of mass density and magnetic field strength
 $|\rho |=|\boldsymbol {B}|=1$
, respectively, an Alfvén wave will travel the full domain of length
 $L$
in an Alfvén time
 $\tau _{A} = L \sqrt {\mu _{0} \rho _{0}} / B_{0}$
as calculated using the dimensional quantities of
 $\mu _{0}$
,
 $\rho _{0}$
and
 $B_{0}$
. OpenMHD is written in the Cartesian coordinate system (
 $x, y, z$
), but to achieve cylindrical coordinates (
 $r, \theta , z$
) we claim the equivalence of the axisymmetric (
 $r, z$
) plane to (
 $x, z$
) at
 $y=0$
.
To the authors’ knowledge, this study represents the first implementation of physical BCs in using OpenMHD. Upon request, the authors will make the source code available to other researchers. We base the CPG model code on the example case
 $\mathsf {2D\_reconnection}$
available in the source code due to its inclusion of plasma resistivity and turbulence. The physical dimensions of the experimental device were duplicated in the MHD domain, as shown in figure 1 and described in § 2. The authors used the results of the global shutter imaging in figure 5, top left frame at 0.0
 $\unicode{x03BC}$
s, to approximate the initial conditions of the plasma as detailed quantitatively in the system of equations (4.1) to (4.6). Since there are no diagnostics deployed on the CPG to quantify any plasma parameters, equations (4.1) to (4.6) are considered dimensionless. Successfully approximating the physical morphology of the plasma propagation with respect to the form of the initial conditions is considered a primary result of this study. Previous results using OpenMHD have been considered dimensionless with respect to the plasma parameters, with the evolution of the fields and density profiles being the significant takeaways therein (Zenitani & Miyoshi Reference Zenitani and Miyoshi2011; Zenitani Reference Zenitani2015; Shimizu et al. Reference Shimizu, Kondoh and Zenitani2017; Zenitani & Miyoshi Reference Zenitani and Miyoshi2020). The goal of this study is to do the same during an application of the OpenMHD framework to an operational experimental device.
In OpenMHD, modifications are made to the following source files. The lead file
 $\mathsf {main.f90}$
sets integer values for the size of the (
 $x, y$
) mesh (axisymmetric
 $r, z$
), the time step and duration of the simulation and the output interval of time-stamped data sets. In this file we define the integer values of the CPG electrodes geometry (figure 1) and the initial plasma volume.
The velocity
 $v$
, magnetic field
 $B$
, density
 $\rho$
and pressure
 $P$
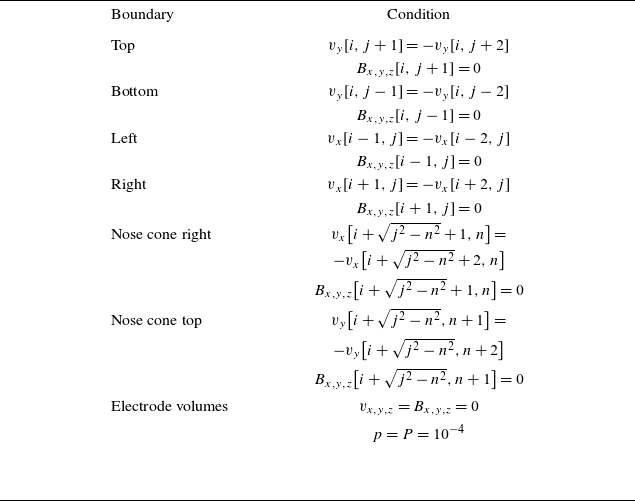
BCs and definitions implemented for physical electrodes and walls in OpenMHD. The horizontal
 $x$
-direction (axisymmetric
 $z$
) uses index
 $i$
, and the vertical
 $y$
-direction (axisymmetric
 $r$
) uses index
 $j$
. The iterative index
 $n$
is included to define the parametric geometry of the circular nose cone shape. Note that Cartesian coordinates (
 $x, y$
) in OpenMHD correspond to (
 $r, z$
) in the axisymmetric CPG geometry.

Table 1. Long description
The table lists boundary conditions (BCs) for velocity, magnetic field, density, and pressure in OpenMHD. It includes conditions for top, bottom, left, right, nose cone right, nose cone top, and electrode volumes. Each BC is defined using specific equations involving indices and variables. The conditions are set to ensure proper implementation of physical electrodes and walls in the simulation.
BCs for all electrodes, walls and initial plasma states are set within the file
 $\mathsf {bc.f90}$
. The boundaries for the physical electrodes are ghost cells that reflect the velocity
 $v$
(momentum) conditions normal to the surface. This type of free-slip BC where the momentum vectors normal to the surface interaction are reversed is typical of electrode boundaries (Subramaniam & Raja Reference Subramaniam and Raja2017; Datta et al. Reference Datta, Meier and Shumlak2024). The top, bottom and right sides of the domain are momentum outflow BCs. The top of the domain is a vacuum wall but we imposed the momentum outflow BC to eliminate reflective motions that shroud the primary plasma morphology. Table 1 lists the BCs imposed for the CPG electrode definitions shown in figure 7. We note that the imposed electrode BCs are made to the conserved variables and not to the interpolated spatial profile states (Zenitani & Miyoshi Reference Zenitani and Miyoshi2011). To exclude magnetic flux from the electrodes, the magnetic field is set to zero within the electrode boundaries, i.e.
 $B_{x}=B_{y}=B_{z}=0$
throughout the simulation within the electrode boundaries. In a practical sense, the exclusion of flux represents a physical conductor, and the flee-slip condition mimics a physical barrier.
Electrode BCs of the CPG geometry shown in figure 1. Ghost cell BCs are implemented on top, bottom, right and nose cone edges, with constant values within. The wall boundaries each allow plasma to pass through. Plasma BCs, including initial velocity, are defined at the
 $t=0$
time step only.

The initial conditions (ICs) of the simulation are set within the file
 $\mathsf {model.f90}$
and define the initial density, pressure, velocity and magnetic field throughout the simulation volume. The ICs are chosen to empirically match the observed morphological plasma profile in the first ionisation frame (0.0
 $\unicode{x03BC}$
s in figure 5) and to be mathematically consistent with typical ICs in MHD modelling of CPGs. Viewing the initial ionisation plasma sheath from global shutter imaging (figure 5, 0
 $\unicode{x03BC}$
s, top left), the mass density profile is observed to have a relatively wide profile and is numerically represented by the
 $\psi (r, z)$
function in (4.1). This stand-alone
 $\psi (r, z)$
function has a constant value along
 $r$
at any discrete axial
 $z$
value. Along any axial cross-section, it forms a normal distribution centred about small
 $z$
values (
 $Z_{s}$
variable below). Multiplying
 $\psi (r, z)$
by an
 $r^{-\gamma }$
term in the subsequent profiles then gives each IC an additional radial dependence on top of
 $\psi (r, z)$
to qualitatively match the spatial profile of the initial ionisation frame. This
 $\psi (r, z)$
profile is then used to define the initial spatial distribution of the other plasma profiles in (4.2) to (4.6). The initial spatial distribution of the
 $\psi (r, z) r^{-\gamma }$
profile can be seen in the first row (
 $t=0$
frames in landscape format) of figure 8 described in § 4.2
 \begin{align} \psi (r, z) &= \frac {{\tanh}(\sigma (r + w_{s}) - Z_{s}) - {\tanh}(\sigma (r - w_{s}) - Z_{s})}{2 \, {\tanh}(\sigma Z_{s})},\\[-10pt]\nonumber \end{align}
 \begin{align} \rho (r, z) &= \rho _{b} + \psi (r, z) r^{-\gamma },\\[-10pt]\nonumber \end{align}
 \begin{align} P(r, z) &= 0.5 \beta \rho (r),\\[-10pt]\nonumber \end{align}
 \begin{align} v_{z}(r, z) &= v_{z,0} \psi (r, z),\\[-10pt]\nonumber \end{align}
 \begin{align} B_{\theta }(r, z) &= B_{0} \psi (r, z) r^{-1},\\[-10pt]\nonumber \end{align}
 \begin{align} \eta (r, z) &= \eta _{0} + \eta _{1} \psi (r, z) r^{-\gamma }. \end{align}
In these ICs,
 $\rho _{b} = 0.01$
is the uniform mass density of the background,
 $\sigma = 3$
regulates the flatness of the profile,
 $w_{s} = 0.5$
is the width of the sheath,
 $Z_{s} = 2.421$
is the axial position of the sheath and the exponent
 $\gamma = 1$
determines the radial profile distribution which is key to the emergence of blow-by (Cassibry et al. Reference Cassibry, Thio and Wu2006). The plasma beta parameter
 $\beta$
is also set within this file, which is the ratio of thermal to magnetic pressure. Using the numerical value
 $\beta =0.2$
is identical to other OpenMHD studies (Zenitani & Miyoshi Reference Zenitani and Miyoshi2011; Zenitani Reference Zenitani2015). The numerical result of this initial OpenMHD sheath in comparison with the observed sheath is shown in the top row (left and middle) of figures 8 and 9. These images were split across two figures for clarity.
First half of CPG imaging and OpenMHD results for times
 $t^{\prime }=0$
to
 $t^{\prime }=1.8$
presented in landscape format. (Left column) Red–blue numerical scaling of the raw global shutter imaging shown in figure 5 (left). These images are a 3-D morphology projected onto a 2-D plane. (Middle column) Axisymmetric OpenMHD profiles of density and azimuthal magnetic field
 $B_{\theta }$
(colour bars, respectively), which are identical in topologies and which act as cross-sectional analogues of imaging. (Right column) OpenMHD pressure profiles at even time increments of
 $\Delta t^{\prime } = 0.6$
.

Second half of CPG imaging and OpenMHD results for times
 $t^{\prime }=2.4$
to
 $t^{\prime }=4.2$
presented in landscape format. (Left column) Red–blue numerical scaling of the raw global shutter imaging shown in figure 5 (left). These images are a 3-D morphology projected onto a 2-D plane. (Middle column) Axisymmetric OpenMHD profiles of density and azimuthal magnetic field
 $B_{\theta }$
(colorbars, respectively), which are identical in topologies and which act as cross-sectional analogues of imaging. (Right column) OpenMHD pressure profiles at even time increments of
 $\Delta t^{\prime } = 0.6$
.

Figure 9. Long description
The image contains multiple panels showing the evolution of density, pressure, and magnetic field in a plasma experiment over time. Panel A: The first column shows global shutter frames at different times (70.0 µs, 87.5 µs, 105.0 µs, and 122.5 µs) with the radial distance (R) on the x-axis and an unspecified unit on the y-axis. Panel B: The second column displays density profiles at times 2.4, 3.0, 3.6, and 4.2 with the spatial coordinate (Z) on the x-axis and radial distance (R) on the y-axis. Panel C: The third column shows pressure profiles at the same times as the density profiles, with the same axes. Panel D: The fourth column presents magnetic field profiles at the same times, with the same axes. Each panel uses a color scale to represent the intensity of the respective quantities, with the color bar indicating the range of values.
The choice of
 $v_{z, 0}=5$
is made so that the longest extent of the plasma simulation best matches the greatest extent of the plasma imaging. While the simulations are axisymmetric in the (
 $r, z$
) plane, as shown in figures 1 and 7, the results described in § 4.2 are plotted by reflecting the (
 $+r, z$
) simulation time steps into the (
 $-r, z$
) plane to match the full CPG geometry captured in the imaging (figure 5). The computational grid is set within both
 $\mathsf {main.f90}$
and
 $\mathsf {model.f90}$
, with a set size of (
 $r, z$
) = (4.60, 22.86) corresponding to the cgs units of the CPG domain, and with a mesh size of (604, 3000). The time step is set to
 $\Delta t = 0.10$
and is advanced using a second-order Runge–Kutta method (Zenitani & Miyoshi Reference Zenitani and Miyoshi2011). OpenMHD uses a divergence cleaning approach using a using a generalised Lagrange multiplier method (Dedner et al. Reference Dedner, Kemm, Kröner, Munz, Schnitzer and Wesenberg2002) and tracks
 $\boldsymbol{\nabla }\boldsymbol{\cdot }\boldsymbol {B}$
errors, which are shown to be
 ${\sim}10^{-6}$
at each time step in our CPG simulations.
The result of imposing the initial density radial dependence
 $r^{-1}$
in (4.1) and (4.2) is the simulated blow-by in frame 2 (17.5
 $\unicode{x03BC}$
s) of figure 5. An axial sheath velocity asymmetry emerges with a higher velocity at smaller radii, despite the density profile remaining high at these smaller radii. It was found that the numerical factor of five times the Alfvén speed,
 $v_{z,0} = 5.0$
, in (4.4) provides the best match to the imaged dynamics of the plasma propagating across the domain, and this factor will be further discussed in § 5. While the simulated blow-by does not match precisely with the axial extent seen in plasma imaging, the position of the peak density in such blow-by profiles will be shown to be an accurate estimation (see below).
The initial azimuthal magnetic field
 $B_{\theta }$
of the plasma sheath follows the typical coaxial profile
 $B \sim \mu _{0} I / 2 \pi r$
, and where
 $B_{0} = 1$
is chosen for (4.5) for this run. We note that the magnetic field profile does not include a circuit current
 $i(t)$
term embedded within OpenMHD that is useful for more robust MHD modelling of coaxial accelerators (Datta et al. Reference Datta, Meier and Shumlak2024). This may become a future OpenMHD upgrade, but it out of the scope of this study. Since the goal of this paper is to produce an initial, first approximation solution for an open source resistive MHD model of a CPG, the general solution of this magnetic field with
 $B_{0}$
of unity allows the plasma sheath to evolve to match the observed dynamics (see § 5). We note that increasing the
 $B_{0}$
order-of-magnitude value to mimic the
 ${\sim}$
kA-level currents destroyed the plasma sheath and introduced far more reflection off of the outer electrode than is seen to be physical.
In the file
 $\mathsf {flux\_resistive.f90}$
, we embedded a plasma resistivity profile
 $\eta _{r, z}$
, where a background value
 $\eta _{0} = 1/1000$
has a localised peaked value distribution
 $\eta _{1} = 1/60$
(Zenitani & Miyoshi Reference Zenitani and Miyoshi2011) that is coincident to the plasma density and identical to the other
 $r^{\gamma }$
profiles in (4.6). Taking the step of imposing a localised resistivity profile
 $\eta _{1}$
is important for considerations of turbulence, the Hall effect, high atomic number
 $Z$
effects, electron kinetics and the emergence of a possible magnetic reconnection dynamics (Zenitani & Miyoshi Reference Zenitani and Miyoshi2011) in future studies that are outside the scope of this paper (Chesny et al. Reference Chesny, Hatfield, Cassibry and Moffett2025). However, it is important that the plasma resistivity is editable in OpenMHD to demonstrate its robustness as a resistive MHD architecture applicable to CPGs. Finally, we note that most of the profiles using (4.1) are thus proportional to
 $r^{-\gamma }$
and that the effects of blow-by, or preventing blow-by, can be observed and investigated in future studies.
4.2. Numerical results
The resistive OpenMHD modelling results are shown in figures 8 and 9. The information is presented in landscape format to show the largest format possible. From bottom-to-top in each image (and left-to-right viewing in landscape format), respectively, the columns are global shutter imaging from figure 5, density
 $\rho$
, pressure
 $p$
, azimuthal magnetic field
 $B_{\theta }$
. Vertically in landscape format, the model timings follow equal spacings in increments of
 $t^{\prime }=0.6$
.
While an asymmetry in the first ionisation frame is apparent in the radial direction (top and bottom) of the actual CPG (figure 8, top left), the initial density, pressure and magnetic field profiles (figure 8, top row, middle and right), show the
 $t=0$
simulation plasma profiles matching the general density behaviour. Note that the resistivity profile matches the same
 $r^{\gamma }$
gradient (where
 $\gamma = -1$
), while the full sheath velocity profile is a constant in
 $r$
that follows the axial
 $\psi (r, z)$
distribution function. At
 $t=0.6$
, the plasma has propagated roughly halfway down the electrodes (figure 8, second row, second column) and the blow-by effect has manifested with the plasma at smaller radii running past the plasma at the outer electrode. This was predicted to be the blow-by effect due to the imprecise mass loading in the radial direction, where Cassibry et al. (Reference Cassibry, Thio and Wu2006) demonstrated that a
 $\gamma = -2.5$
would prevent blow-by and result in a radially uniform sheath velocity. This improper mass loading is a direct result of our CPG gas puff being located at the centre of the inter-electrode gap. If the gas puff inlets were located closer to the inner electrode radius, we anticipate that this blow-by effect would be mitigated. The authors stress that it is this initial behaviour of plasma initiation and the manifestation of blow-by during the rundown phase that was the goal of the resistive MHD modelling using OpenMHD. Understanding the plasma profiles and especially the internal magnetic field are the primary goals accomplished here. It is noted that a leading pressure wave begins to emerge at
 $t=0.6$
that precedes the denser blowby. This may be a numerical manifestation of the shock heated deflagration front (Cheng Reference Cheng1970).
The runover and pinch phases are captured by the simulated time stamps from
 $t=1.2$
and
 $t=1.8$
with the internal plasma at small radii becoming the densest portions into
 $t=2.4$
. We note that these axisymmetric simulations are only a cross-section of the plasma behaviour, while the global shutter imaging captures the full 3-D morphology as a projection onto a 2-D plane. Due to the axisymmetric nature of the simulation, an observer looking along the radial direction would see a 3-D projection of the radial plane all along the
 $Z$
axis. The concavity of the simulation would form the leading edge of the imaged plasma bulk. The leading deflagration front begins to precede the dense plasma and is most evident in the heated pressure shock front shown in the third column. As this plasma bulk propagates axially at
 $t=3.0$
and later, the more diffuse plasma density connecting the sheath back to the electrodes begins to fade, as it does in the imaging at
 $t=87.5$
and
 $t=105.0$
 $\unicode{x03BC}$
s. This is indicative of the plasmoid formation, separation and propagation as the magnetic field is carried along with the bulk plasma density (figure 5). Here, the bulk plasma density becomes more concave as it propagates, and it elongates and diffuses.
An important implication from this modelling is that the magnetic field component
 $B_{\theta }$
embedded in the initial plasma sheath (fourth column) is dragged along with the plasmoid and both density and magnetic field peak values occur at the same locations. More insight into this implication will be provided in § 5 when these results are compared with the classic snowplough model, but this shows that imaging the location of bright density enhancements implies the location of the strongest azimuthal magnetic field (Stepanov et al. Reference Stepanov, Shumlak, McLean, Nelson, Claveau, Forbes, Weber and Zhang2020). When future TMR experiments are conducted and the plasma must be forced to interact with an external magnetic field in the fan-spine topology, the locations of the plasma’s perturbing magnetic field can be known to a high degree of fidelity.
The background density is
 $\rho _{b} = 10^{-2}$
of the plasma slug IC, and the pressure profiles (third column) demonstrate the interaction of the sheath with a substantial background (figures 8 and 9, right column). The CPG chamber is at a background pressure of 0.5 Torr, considered a medium vacuum level, and collisions with the neutral background are significant. This effect likely contributes to the lack of propagation of the plasma bulk in imaging frames at
 $t=87.5$
to
 $t=122.0$
 $\unicode{x03BC}$
s.
The OpenMHD modelling results can be extrapolated to elucidate unknown experimental plasma parameters. If we consider dimensional quantities of typical CPGs of the order of
 $B_{0} = 0.5$
T (Black, Mayo & Caress Reference Black, Mayo and Caress1997) and the average molecular weight of air
 $A = 28.97$
(the working gas), an Alfvén travel time of
 $v_{z, 0}=v_{A}=5$
at
 $\tau _{A} = 54$
 $\unicode{x03BC}$
s across a distance of
 $L=10$
cm occurs when the electron number density is
 $n_{e} = 3 \times 10^{21}$
m
 $^{-3}$
. This travel time is nearly identical to the empirical propagation extent of the plasma at the global shutter time frame of
 $52.5$
 $\unicode{x03BC}$
s in figures 5 and 8 (landscape, first column, fourth row). The
 $L=10$
propagation is demonstrated in the simulation run of the density propagation at
 $t=1.8$
in figure 8 (landscape, second column, fourth row). This dimensionless MHD time is computed to be
 $\tau _{A}=2$
with the
 $|\rho |=|\boldsymbol {B}|=1$
condition at
 $L=10$
and
 $v_{z, 0}=v_{A}=5$
, which is very close to the simulated time of
 $t=1.8$
.
5. Comparison with the snowplough model
Conclusions from the comparison between the plasma imaging and the resistive MHD modelling can be further extrapolated from the axial rundown acceleration in the 1-D snowplough model. We compare the empirical dynamics extracted from the imaging in figures 8 and 9 with the snowplough model of Stepanov et al. (Reference Stepanov, Shumlak, McLean, Nelson, Claveau, Forbes, Weber and Zhang2020). From the empirical current profile
 $I(t)$
in figure 6 (solid blue line), the total impulse can be calculated using the standard coaxial inductance per unit length
 $L = (\mu _{0}/2 \pi ) \, {\ln}(r_{o}/r_{i})$
via
 \begin{align} P(t) = \frac {L}{2} \int _{0}^{t} I(t^{\prime }) {\rm d}t^{\prime }, \end{align}
which is found by integrating the standard snowplough acceleration between coaxial electrodes (Mostov et al. Reference Mostov, Neuringer and Rigney1961; Stepanov et al. Reference Stepanov, Shumlak, McLean, Nelson, Claveau, Forbes, Weber and Zhang2020; Datta et al. Reference Datta, Meier and Shumlak2024). The snowplough axial position
 $z_{sp}$
and velocity
 $v_{sp}$
are then calculated as, respectively,
 \begin{align} z_{sp}^{2} (t) = \frac {2}{\lambda _{0}} \int _{0}^{t} P(t^{\prime }) {\rm d}t^{\prime }, \end{align}
and
 \begin{align} v_{sp} (t) = \frac {P(t)}{\lambda _{0} z_{sp}(t)}, \end{align}
where
 $\lambda _{0}$
is the assumed uniform linear mass density of the sheath. We solved equations (5.1), (5.2) and (5.3) using the empirical current trace
 $I(t)$
from figure 6 and the CPG geometry and assumed a best-fit linear mass density of
 $\lambda _{0}=3.4 \times 10^{-6}$
kg m
 $^{-1}$
. Empirical data points from plasma imaging and OpenMHD are found by automatically tracking the brightest pixel along the axial direction. The authors considered other metrics for measuring the snowplough front, but effects of deflagration along the leading edge and following the fundamental definition of the thin sheath snowplough led us to keep the brightest pixel metric as the centroid of the measurement (with errors). These are plotted as blue circles and cyan squares, respectively, in figure 10(a), along with their polynomial fits each of degree 4, and overlaid with the 1-D snowplough axial position
 $z_{sp}$
of (5.2). The axial velocities computed as the time derivatives of the polynomial fits
 $v_{z, sp, data}=d z_{sp, data}/{\rm d}t$
are plotted as blue diamonds for the imaging data and cyan triangles in figure 10(b) overlaid with the 1-D snowplough velocity
 $v_{sp}$
of (5.3).
One-dimensional snowplough modelling of the CPG discharge current
 $I(t)$
. (a) CPG sheath position
 $z_{sp}$
(red solid) overlaid by the camera data imaging peaks (blue circles), OpenMHD density peaks (cyan squares) and their polynomial fits (black dotted and magenta dash dotted, respectively). (b) The CPG sheath velocity
 $v_{sp}$
(green solid) overlaid by the numerical gradient (
 ${\rm d}z_{\textit{fit}}/{\rm d}t$
) of both the data (blue diamonds) and OpenMHD (cyan squares) polynomial fits.

6. Discussion
The comparison between experimental imaging, 2-D resistive MHD simulations and 1-D snowplough theory reveals the key physical mechanisms governing the evolution of the CPG sheath. By tracking the axial position and velocity of the plasma sheath, we find strong qualitative agreement between the experimental observations and the OpenMHD simulations, particularly during the early ionisation and rundown phases. Deviations from the ideal snowplough predictions emerge rapidly, driven by the initial radial mass distribution of the injected gas, which leads to velocity asymmetries and the onset of blow-by. These results highlight the importance of accurately specifying initial density profiles to reproduce and predict sheath behaviour in both experimental and theoretical contexts.
We have characterised the operation of a custom CPG using fast imaging and a newly applied resistive MHD modelling tool for experimental architectures. Enabled by a repeatable high-power solid-state switching array, monochrome global shutter imaging captured the initial ionisation, rundown, runover, disorganised pinching and dissipation phases that were successfully replicated in 2-D axisymmetric simulations. From this modelling, and without the use of more advanced plasma diagnostics, we were able to approximate the plasma density, vector magnetic field and initial velocity profiles of the gas puff initiated plasma bulk throughout its evolution. These were shown to understandably differentiate from the classic 1-D snowplough model of CPG operation with simplified asssumptions. Further testing will allow for the proper placement of plasma diagnostics to confirm these predictions and ensure the optimisation of the plasma morphologies for useful output.
A significant result of this study is the expansion of the OpenMHD architecture (e.g. Zenitani & Miyoshi Reference Zenitani and Miyoshi2011, https://sci.nao.ac.jp/MEMBER/zenitani/openmhd-e.html) to the realm of experimental plasma systems that feature material boundaries, i.e. electrodes. While there are far more sophisticated modelling tools available to plasma physics researchers, many are either custom (e.g. Subramaniam & Raja Reference Subramaniam and Raja2017) or have a steeper learning curve (e.g. Athena++ (Stone et al. Reference Stone, Tomida, White and Felker2020), FLASH (Tzeferacos et al. Reference Tzeferacos, Fatenejad, Flocke, Graziani, Gregori, Lamb, Lee, Meinecke, Scopatz and Weide2015)) compared with OpenMHD. The authors anticipate the current capabilities of OpenMHD to provide a significant start to parametrisation of the fundamental plasma profiles, including initial density, initial velocity, magnetic field structure and resistivity. The resistivity profile is a wide-ranging parameter in that alterations to resistivity can mimic effects from localised plasma instabilities, the Hall term, high
 $Z$
effects or electron kinetics (Zenitani & Miyoshi Reference Zenitani and Miyoshi2011). Since we normalised all physics profiles in (4.1) to (4.6), including resistivity, we argue that an exploration of alterations to the resistivity (e.g. Hall effects) would be a useful extension of this paper and validating certain assumptions of resistivity in OpenMHD. Overall, we anticipate that OpenMHD can become a more widespread tool for preliminary CPG design studies and other experimental architectures.
The authors interpret figure 10(a) as the most impactful result in this manuscript because it incorporates each data metric of imaging, 2-D MHD modelling and 1-D analytic modelling. A number of items are immediately clear from this 1-D snowplough comparison with our CPG operation and simulation:
-
(i) The polynomial fits of the CPG operation and resistive MHD simulations closely match when tracking peak density and azimuthal magnetic field.
-
(ii) The CPG operation and resistive MHD simulations match the beginning and the end of the snowplough model.
-
(iii) Both the CPG operation and resistive MHD models quickly deviate from the snowplough model during the rundown and runover phases during the first half of the CPG plasma sheath evolution.
-
(iv) The assumption of a linear mass density in the snowplough model is fundamentally different from the
 $\rho \propto r^{-1}$
IC in resistive MHD modelling.

These deviations from the 1-D snowplough axial position
 $z_{sp}$
immediately affect the velocity profiles, as demonstrated by the steeper axial position profiles of the fits. Figure 10(b) shows that the gradients of the polynomial fits give a much faster initial velocity during the blow-by portion of the rundown phases seen in imaging and matched by OpenMHD modelling. Very clearly, the 1-D analytical profile is only matched if it is shifted to the left by some initial velocity
 ${\approx}1.5$
km s
 $^{-1}$
where the imaging data and MHD modelling roughly match close to
 $t=0$
. The blow-by evolution of the sheath velocity profile that is imaged and then simulated by a seed plasma density profile proportional to
 $r^{-1}$
is likely the culprit for deviating from the pure snowplough acceleration rundown phase operation. If the gas puff of the CPG mass loaded closer to the inner electrode to more closely match an idealised
 ${\approx}r^{-2}$
density IC to match the radial magnetic pressure (Cassibry et al. Reference Cassibry, Thio and Wu2006), this blow-by could be mitigated and a more uniformly snowplough rundown and runover could be achieved. If the gas puff provided an initial density loading profile even closer to the
 ${\approx}r^{-2.5}$
dependence as suggested by more robust 2-D axisymmetric MHD models (Cassibry et al. Reference Cassibry, Thio and Wu2006) and this IC was simulated using the resistive MHD density IC as explored here in OpenMHD, the
 $z_{sp}$
and
 $v_{sp}$
axial evolutions in figure 10(a) may more closely match. Additionally, mass loading the gas puff inlets closer to the inner electrode would alleviate azimuthal asymmetries and likely lead to a more uniform discharge.
Elucidating this deviation from the snowplough model as a result of blow-by due to the asymmetry of the injected gas puff mass is the main result of this manuscript. The closely matched data imaging to the ICs of the resistive OpenMHD simulation show that the locations of the peak density and azimuthal magnetic field can be diagnosed visually. A more comprehensive diagnostic suite of probes can now be deployed in these known locations to quantify the fundamental plasma parameters, including electron temperature, electron density and embedded vector magnetic field strengths. For example, to diagnose the initial plasma conditions leading to the rundown dynamics, a radial array of B-dot probes toward the outlets of the gas puff would be able to capture the vector magnetic field profile of the ionised slug. Multi-chord interferometry also along the radial direction will decipher the initial ionisation profile to inform its
 $r^{-\gamma }$
dependence. Measurements of the plasma density and magnetic field along the same axial location within the CPG during the rundown phase can also decipher blow-by if the magnetic field peak occurs prior to the bulk density. These measurements will also decipher the blow-by of the magnetic field due to an enhanced radial component of the plasma velocity (Baker et al. Reference Baker, Horton, Hwang, Evans and Howard2002). Resistive MHD modelling that properly mitigates blow-by can then predict locations of the strongest magnetic field profiles during the rundown phase, where further B-dot measurements can be made of potential peak perturbation regions for future TMR applications. As long as blow-by is mitigated, the plasma and magnetic field will be coincident and be in the proper frozen-in flux condition for TMR. Another example could be an axially staged array of B-dot probes along the
 $Z$
axis and close to the inner electrode would diagnose the strong azimuthal component
 $B_{\theta }$
toward the leading edge of the plasma at
 $t=1.8$
in the simulations of figure 8, right column. The geometrical locations of such values will inform further experimental design to include external magnetic fields to maximise the useful output of this solid-state driven gas puff CPG.
7. Conclusion
We have repeatedly operated a custom-built gas puff CPG utilising a thyristor-based solid-state switch array for digital control. This digital control enabled fast imaging across multiple shots at 4 kV, 7.74 kA with enforced delays of 17.5
 $\unicode{x03BC}$
s between shots and at 8.7
 $\unicode{x03BC}$
s shutter speed per shot. Global shutter imaging elucidated the sheath rundown phase featuring significant blow-by (Cassibry et al. Reference Cassibry, Thio and Wu2006), where plasma closer to the inner electrode is accelerated to higher velocities compared with plasma located at larger radii. While this blow-by is not ideal and does not strongly follow the classic snowplough model of the rundown phase, possessing the ability to image the plasma morphology and gaining a fundamental understanding of the CPG operation are the critical takeaways.
To complement the fast global shutter imaging, we performed 2-D axisymmetric resistive MHD modelling using the open source OpenMHD architecture (Zenitani & Miyoshi Reference Zenitani and Miyoshi2011; Zenitani Reference Zenitani2015). To the authors’ knowledge, this is the first attempt to translate the OpenMHD architecture (https://sci.nao.ac.jp/MEMBER/zenitani/openmhd-e.html) to include physical boundaries to imitate a material apparatus. The ICs imposed upon the plasma sheath were chosen to mimic other well studied CPG models and match the plasma morphology and dynamics seen in our experiments. The rundown phase, including the emergence of blow-by, was well modelled using a radial density profile proportional to
 $r^{-1}$
. The authors attribute this blow-by to the central injection of the gas puff inlets rather than mass loading toward smaller radii closer to the central electrode (anode). The analyses of Cassibry et al. Reference Cassibry, Thio and Wu2006 suggest that this type of anode mass loading can mitigate blow-by during rundown and result in closer to a
 $r^{-2.5}$
profile. These resistive MHD simulations closely replicating the observed dynamics give us confidence that the imposed ICs in the model are the type achieved in the CPG operation.
Understanding these operational CPG characteristics allow us to use the results of both imaging and modelling to inform the placement of plasma diagnostics. Future tests will capture electron temperature, electron density and vector magnetic field strengths within the plasma to better understand the MHD state of the sheath as it evolves. It is critical to understand this fundamental CPG operation at the rundown and runover phase time cadences for us to optimally operate the CPG for its intended future use and maximise its useful output. Specifically, understanding the precise locations of the peak azimuthal magnetic field from image brightness and simulated density and magnetic field will fully qualify this CPG for use in future TMR experiments. This includes ensuring that 3-D magnetic null point fan-spine topologies (Chesny et al. Reference Chesny, Orange and Dempsey2021a
, Reference Chesny, Moffett, Cole, Baptiste and Orange2022a
) that surround the CPG will subject the correct parts of the plasma to the correct part of the external magnetic field (Chesny et al. Reference Chesny, Orange and Hatfield2021b
). As a final note for future experiments, the implementation of high-power solid-state switching enables the high repeatability factor of the CPG operation. The digital control of the system is critical to implement
 $\unicode{x03BC}$
s-level, and even ns-level, digital delays for fast imaging for comparison with simulations. The solid-state array provides confidence in system repeatability and discharge efficiency.
A comparison of the fast imaging and MHD modelling results with the snowplough model of axial sheath propagation and velocity (Mostov et al. Reference Mostov, Neuringer and Rigney1961; Price Reference Price1988; Stepanov et al. Reference Stepanov, Shumlak, McLean, Nelson, Claveau, Forbes, Weber and Zhang2020; Datta et al. Reference Datta, Meier and Shumlak2024) show a strong deviation immediately during the rundown phase. This is attributed to the simplified assumptions of those models, including a uniform linear mass density, plus the empirical emergence of blow-by in the CPG rundown plasma sheath due to an ionisation density profile proportional to
 $r^{-1}$
. Achieving the appearance of blow-by in the OpenMHD simulations accurately matched the imaging data when the peak density pixels were tracked along the axial location. Their polynomial fits shown in figure 10(a) show a strong correlation between the observed and modelled values, while they deviate from 1-D snowplough predictions. The velocity profiles are much more sped up in the axial rundown and runover phases in the experiment and simulation, with the general snowplough model shifted to a much faster initial sheath due to blow-by. The results found in this paper give a strong understanding of the operation of the CPG plasma morphology without deploying more advanced diagnostics.
These insights will inform the design of future diagnostics, plasma loading strategies and external magnetic field configurations, enabling more controlled plasma evolution for advanced propulsion and PJMIF experiments. Generating useful output from a CPG for industrial applications including in-space propulsion and commercial fusion can immediately benefit from high-power solid-state switching. Plasma jet magneto-inertial fusion is a fusion concept that relies on precision timing between separate CPG systems. Formation of the collapsing plasma liner may only effectively compress and heat its target if each CPG is fired within approximately 100 ns of one another (Cassibry et al. Reference Cassibry, Stanic and Hsu2013). The digital delays that we incorporated into our global shutter imaging technique (§ 3) is precisely equivalent to imposing digital delays at the limits of microcontrollers in a PJMIF system. Such improvements will enable adjustments of the arrival time of the plasma jets into the merging radius where the compression liner is formed. Thus, high-power solid-state switching can be implemented in future iterations of PJMIF experiments to greatly improve symmetric liner formation and ram pressure on a target (LaJoie et al. Reference LaJoie2024).
For both electric propulsion and fusion experiments, the efficiency increase solid-state switching provides over spark gaps and gas switches is an immediate upgrade to final operation metrics, typically referred to as electric to beam efficiency, wall plug efficiency or facility gain for fusion. The repeatability of high-power solid-state is another improvement over gas switches that use a pressurised working gas, typically SF
 $_{6}$
, as the interelectrode dielectric. These gas media are typically limited to hundreds of shots before replacement is required, or complex gas cycling systems are adopted, per switch. Critically for these deployed applications, the solid-state switch array as we have configured in this study is not a single point system failure. If there is an anomalous failure of any single thyristor, individual parallel branches of the solid-state array can be removed and operation can be restarted. Additionally, duty cycling parallel branches can further improve the lifetime of the switch array.
Finally, resistive MHD simulations can inform higher density scaling of CPGs for maximising thrust in space propulsion applications. Methods for blow-by mitigation can optimise the snowplough operation mode of a CPG for maximum plasma propagation and enforcing frozen-in flux plasma interactions with external magnetic fields. They can further inform optimal gas puff placement, plasma diagnostics and how ICs evolve prior to implementing experimental set-up alterations.
Acknowledgements
Editor Edward Thomas, Jr. thanks the referees for their advice in evaluating this article.
Funding
This study was supported by Department of Energy Office of Science program grants DE-SC0024657 and DE-SC0024680.
Declaration of interests
The authors declare no conflict of interest.
Data availability statement
Data available upon reasonable request to the corresponding author.


 ≈2ms

 μ

 t=0
 ≈7.74
 di/dt
 μ
 μ
 v
 B
 ρ
 P
 x
 z
 i
 y
 r
 j
 n
 x,y
 r,z

 t=0

 t′=0
 t′=1.8
 Bθ
 Δt′=0.6

 t′=2.4
 t′=4.2
 Bθ
 Δt′=0.6

 I(t)
 zsp
 vsp
 dzfit/dt

 Open access

