


Introduction
As concerns about farmland protection, small farm viability and the implications of an industrialized food system continue to mount1, sales of agricultural products directly from farmers to consumers have been increasing throughout the United States in the past decadeReference Feenstra2. According to the most recent US Agricultural Census, the value of direct sales of agricultural products in West Virginia increased from $2.9 million in 1997 to $4.6 million in 2002, and the number of farms selling directly to consumers increased from 1303 to 14343. As one of the most important venues for direct marketers, farmers' markets nationwide have increased twofold in number over the years, from 1755 in 1994 to 3706 in 20044. This growth in farmers' markets and direct marketing is driven both by consumer demand for fresh, local products and by the potential for increased farm income. Farmers' markets are considered by many to be an especially important direct marketing outlet for small farms, yet few studies have examined the contribution of farmers' markets to the income of agricultural direct marketers.
West Virginia is a rural state whose agriculture is largely comprised of small family farms. Ninety-five percent of West Virginia farms are family owned and operated, and farms with annual sales of less than $50,000 accounted for 95% of all farms in 20025. At an average of 69.6 hectares (172 acres), land base for the state's farms is small compared to the national average of 178.5 hectares (441 acres)5. While this density of small farms ‘perpetuates the traditional quality of rural landscapes’, it also means that few farming families can take advantage of the economies of scale that make extensive agriculture viableReference Steele6. Preserving the state's agricultural base requires an attention to enterprises that are feasible on a small scale, such as fruits, vegetables and other high-value alternative crops.
Higher return per acre is one method of preserving small farms, particularly in the vicinity of growing metro areas, where prices received for products sold directly to consumers tend to be ‘significantly higher than typical wholesale prices’Reference Gale7. Among the many benefits to farmers inherent in farmers' markets is the fostering of entrepreneurship, since the direct contact with consumers allows farmers to ‘experiment with new items to respond to shoppers’ demands'Reference Hamilton8,Reference Lyson, Gillespie and Hilchey9. Farmers' markets play a vital role in enabling small-scale farmers to gain direct access to customers. Without this direct access to consumers, the existence of many small- and medium-size growers would be threatened, since smaller farms are more likely to use such direct marketing methodsReference Gale7,Reference Payne10. In the 2004 season, there were more than 30 farmers' markets operating in West Virginia11.
The needs of small, diversified farm operations have gradually come to the attention of researchers and educators as they seek to identify the characteristics correlated with success in agricultural enterprises. The National Commission on Small Farms noted in their 1998 recommendations that small farmers are recognizing a need to add value to their products in order to boost economic returns12. If, as the Commission suggests, the fate of small farms and the businesses that rely on them will ultimately depend on ‘the ability of a new generation to enter into farming,’ then specific attention to the factors influencing financial viability is well warranted12. One of the largest limiting factors identified by direct marketers nationwide in a 2000 US Department of Agriculture (USDA)-sponsored focus group was a lack of business decision-making tools, including knowledge of the characteristics associated with success in various direct-marketing outlets13.
The purpose of this study was to examine the impact of farmers' market sales on farm family household income for farmers' market vendors in West Virginia, as well as to understand factors that influenced total farmers' market sales in 2004.
Background
An earlier West Virginia study surveyed farmers' market consumers but not farmers' market vendors; the information gathered is nevertheless relevant for understanding vendor success. This 1984 study revealed that West Virginia residents prioritized quality as the primary reason to shop at a farmers' market, and limited volume or variety as a reason for dislike of farmers' marketsReference Jack and Blackburn14. Similarly, researchers at Rutgers University found that nearly 90% of New Jersey consumers rated the quality of products at farmers' markets as ‘excellent or very good,’ though only half rated variety of products as ‘excellent or very good’Reference Govindasamy, Italia and Adelaja15. A diverse selection of products can help fulfill shoppers' needs and encourage them to spend more each weekReference Corum, Rosenzweig and Gibson16,Reference Planck17. Organic products add diversity to a market and often provide a price premium for producers. According to a New Jersey study, 64% of vendors surveyed said that customers were requesting organically grown productsReference Govindasamy, Zurbriggen, Italia, Adelaja, Nitzsche and VanVranken18. Addressing the diversity issue is important to market managers in Maryland, Washington, DC and Pennsylvania, who cited recruitment of vendors with certain value-added products as an urgent priorityReference Oberholtzer and Grow19. Yet only 33% of vendors in Oklahoma reported selling value-added products, and only 1.9% of all farmers in West Virginia are considered value-added processorsReference Henneberry and Agustini20,Reference Lewis21.
Along with product diversity, the number of weeks local products are available via farmers' markets may satisfy customers and increase revenue and income for farmers. A national survey of markets conducted in 2000 revealed that 25% of those in the Mid-Atlantic were open year-round, with an average season length of 20 weeksReference Payne10. Success may also depend on having repeat customers, receiving retail prices, personal interaction with customers, and high demand for high-quality produceReference Henneberry and Agustini20,Reference Govindasamy, Zurbriggen, Italia, Adelaja, Nitzsche and VanVranken22. Promotional methods are also likely to have an impact on farmers' market revenue and income. Posting signs indicating price and product information, providing samples and recipes, and offering bulk discounts were all methods used at many New Jersey and Oklahoma farmers' marketsReference Henneberry and Agustini20,Reference Govindasamy, Zurbriggen, Italia, Adelaja, Nitzsche and VanVranken22. A large majority of New Jersey vendors indicated that they promoted sales by offering information on how to prepare produce, with even more of them inviting customers to sample their productsReference Govindasamy, Zurbriggen, Italia, Adelaja, Nitzsche and VanVranken22. Seventy-five percent of Maryland producers responding to a Chesapeake Fields Institute survey used one or more value-added labels when marketing their products, such as ‘natural’, ‘free range’ or ‘fresh-picked’23.
While direct-marketing presents opportunities to capture a larger share of the food dollar, suitable pricing methods play an important role in maximizing profitability when selling at farmers' marketsReference Planck24. Among the most common pricing methods used by Oklahoma vendors were grocery store comparison, matching other vendors' prices, and cost of production plus mark-upReference Henneberry and Agustini20. Marketers in New Jersey relied more heavily on comparisons with chain stores and wholesale markets as pricing methods rather than cost-accounting or mark-up methodsReference Govindasamy, Zurbriggen, Italia, Adelaja, Nitzsche and VanVranken22.
Farmers' market sales may be an important source of income, especially for small farm households, as well as a way to develop business skills. Henneberry and AgustiniReference Henneberry and Agustini20 found that 49% of farmers' market vendors in Oklahoma had total annual household incomes of $39,999 or less. While 52% indicated that they did not work off-farm jobs during the market season, only 5% claimed that sales from farmers' markets constituted their full-time income. Among their survey respondents, 43% considered income from farmers' markets as part-time income, with another 27% considering it ‘hobby’ or ‘extra’ income. Feenstra et al. Reference Feenstra, Lewis, Hinrichs, Gillispie and Hilchey25 found that farmers' markets promoted entrepreneurial skills for farmers from operations of all sizes, even though income from the market was only a small part of household income for small farms. A West Virginia University (WVU) study of vegetable producers found that nearly three-quarters had annual vegetable income of $5000 or lessReference McConnell and Czemerda26. A majority of farmers' market vendors at metro and small-town markets in California were full-time farmers, with more part-time vendors selling at rural marketsReference Feenstra and Lewis27. Though income derived from New Jersey farmers' markets varied widely among respondents, with sales at markets comprising the entire income for some vendors, the overall mean was 37% of total gross incomeReference Govindasamy, Zurbriggen, Italia, Adelaja, Nitzsche and VanVranken22. Direct-marketers in New Jersey who sell their products through direct-retailing were found to be 14% more likely to be in a high-income category compared to those who are not primarily retailers, and even higher for those selling value-added products like breads, pies or jamsReference Govindasamy, Hossain and Adelaja28.
Our study builds on much of this previous work by examining the impact that promotional strategies, pricing methods, product diversity, length of market season and other market and vendor characteristics have on farmers' market sales. We also address the importance of farmers' market sales to farm households by analyzing the amount of income from farmers' markets as well as the percentage of household income accounted for by farmers' market sales.
Survey and Data
Vendors, identified by collecting contact information in person at West Virginia farmers' markets as well as from market managers, were surveyed regarding their 2004 seasonReference Miller29. An additional list of 150 vegetable growers available from the WVU Extension Service was also used. All 331 members of the vendor population were included, regardless of their state of residency, as long as they used at least one farmers' market in West Virginia as a marketing outlet. Of the 331 distributed questionnaires, 236 were returned, for a response rate of 71%. Those respondents indicating that they did not sell any products at a West Virginia farmers' market in the 2004 season were removed from subsequent analysis, leaving 194 (59%) usable questionnaires.
Content and face validity of the survey was established by WVU faculty in Agricultural and Environmental Education and Agricultural and Resource Economics as well as by a small volunteer pilot group of vendors. Reliability of the instrument was determined based on alpha scale analysis of the sample population's data. Cronbach's alpha was valued at 0.9223, and the instrument was deemed to have exemplary reliabilityReference Robinson, Shaver, Wrightsman, Robinson, Shaver and Wrightsman30. Each mailed survey was accompanied by a small gift, a hand-signed cover letter and a self-addressed stamped envelope. Following recommendations by DillmanReference Dillman31, a second mailing of the instrument was sent to non-respondents four weeks after the initial mailing, accompanied by a new cover letter.
A summary of the relevant survey responses is presented in Table 1. A majority of the respondents were over 50 years of age with almost 20% above 70. While level of education was roughly equivalent for males and females, females were more likely to have pursued education beyond a college degree. Farmers' markets were the most commonly used market outlet for vendors in 2004. Attendance at farmers' markets varied from one to ten different markets, with an average number of 1.6 markets. The average vendor attended a market at least 2 days of the week during the peak season of 2004. The most frequently reported distance traveled to sell at a farmers' market was 10–19 miles, although 6% traveled 50 miles or more, and 18% sold in states bordering West Virginia. The median range of farmers' market sales reported for 2004 was $1500 to $2999.
Descriptive statistics from survey.

1 The Women, Infants and Children (WIC) Farmers' Market Nutrition Program (FMNP) and the Senior Farmers' Market Nutrition Program are US Department of Agriculture programs which provide vouchers to WIC recipients and low-income seniors that can be exchanged for fresh, locally grown fruits and vegetables at farmers' markets. Vouchers from either program are included when referring to the FMNP.
Research Methods
To understand factors that impact the level of total farmers' market sales, the percentage of household income from farmers' markets and the amount of household income from farmers' markets, three linear regression equations were estimated using ordinary least squares (OLS) with the above three financial measures as dependent variables.
Initial examination of the data along with WVU Extension Service knowledge of market vendor demographics indicated that there may be several distinct groups of farmers' market vendors. To analyze this issue, vendors were divided into four categories using the defining characteristics presented in Table 2. Chi-squared tests were then used to determine whether these were significantly different groups with respect to total farmers' market sales and percentage of household income from farmers' markets (results in Table 2). The retired vendors and part-time producers were not significantly different from each other; neither were the two groups of full-time farmers. Part-time producers were distinct when compared to both groups of full-time farmers (statistically significant at the 0.01 level). Retired vendors were significantly different from full-time producers with no off-farm job when considering total farmers' market sales and percentage of household income from farmers' markets (at the 0.01 level). In addition, retired vendors were distinct from full-time producers with an off-farm job with respect to total farmers' market sales (at the 0.01 level) and percentage of household income from farmers' markets (at the 0.05 level). Consequently, for the OLS estimation, retired vendors and part-time producers were combined into one group, which was used as an explanatory variable, as were the full-time farmers both with and without off-farm jobs.
Farmers' market vendor groups.

There was some variation with respect to gender between these different vendor groups (Table 2). Chi-squared tests that examined differences between male and female farmers' market vendors with respect to total farmers' market sales and percentage of household income from farmers' market sales found no statistically significant difference between the genders, so gender was not used as an explanatory variable in the econometric equations.
Variables used in the three OLS models are listed in Tables 3 and 4 along with their definitions. Descriptive statistics for the variables are given in Tables 5 and 6. All models were estimated using LIMDEP software and were corrected for heteroskedasticityReference Greene32.
Variables used in models.

1 Twenty-one ranges of total sales from farmers' markets in 2004 were presented in the questionnaire. The midpoint of each of these ranges was used as the total farmers' market sales dependent variable.
2 Ten ranges were available for percentage of total household income from farmers' markets. The midpoint of each of these ranges was used as the dependent variable.
3 Total household income from farmers' markets in 2004 was calculated by multiplying the percentage of household income from farmers' markets with the midpoint of one of the 21 ranges chosen by the respondent when reporting total household income for 2004.
4 The 4-point Likert scale for this survey question went from 1 for very satisfied to 4 for very unsatisfied.
Promotional strategy, information method and type of product variables used.

1 Can be greater than one: LISTS includes two methods; PRINT and OTHERI each include three.
Descriptive statistics for variables used in models.

Descriptive statistics for variables used in models (continued).

Results and Discussion
Results of the econometric estimations are presented in Tables 7–9 for the total farmers' market sales, percentage of household income from farmers' market sales models and household income from farmers' market sales, respectively. Those variables which were not statistically significant are not presented in the tables due to space constraints. For all of the models, the number of farmers' markets attended was not statistically significant. Surprisingly, products labeled ‘organic’ did not increase total farmers' market sales, household income from farmers' markets or percentage of household income from farmers' markets, as this variable was not significant in any of the models. Three promotional strategies—bulk discounts, free samples and various others—were not significant in any of the models. For both the total farmers' market sales model and household income from farmers' markets model, none of the different types of products produced were significant. The number of different types of market outlets used was not significant in the household income from farmers' markets model or the percentage of household income from farmers' markets model.
Total farmers' market sales model results.
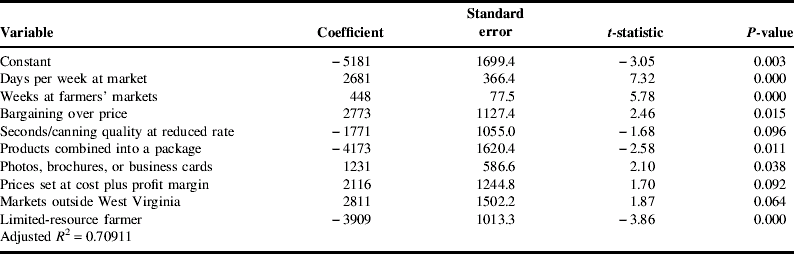
All significant at P⩽10% (115 d.f.).
Percentage of household income from farmers' market sales model results.

All significant at P⩽10% (138 d.f.).
Household income from farmers' market sales model results.

All significant at P⩽10% (110 d.f.).
It is not surprising that the number of days per week and the number of weeks throughout the season during which a vendor sells at farmers' markets are both statistically significant in all of the models. If a producer increased the average days per week he/she sold at a farmers' market by one, total farmers' market sales over the season would increase by $2681, annual household income from farmers' markets would increase by $2363 and the percentage of household income from farmers' markets would increase by 5.4 (for example, 10% of household income from farmers' markets would become 15.4%). This is in keeping with Payne's findings that, nationwide, markets which generated annual sales greater than $500,000 were open 3.1 days per week, as opposed to 1.8 days per week for markets that generated sales less than $500,000Reference Payne10. Increasing the number of weeks of the season by one has a smaller impact: $448 for total farmers' market sales and $378 for annual household income from farmers' markets, and the percentage of household income from farmers' markets would increase by only 0.7. Similarly, markets nationwide were much more likely to be in a higher sales category if they were open for 20 or more weeks of the yearReference Payne10.
Total farmers' market sales
Vendors who sold outside of West Virginia had higher average annual farmers' market sales by $2811. It is unclear to what degree this is due to differentials in population density, standard of living or education levels between metro areas outside West Virginia and lower-income rural areas within the state. Similar results were found in California where estimated gross sales in metro areas were higher than in small towns, where they were higher than in rural marketsReference Feenstra and Lewis27. Total farmers' market sales in 2004 for limited-resource farmers were lower by $3909. Further research into why these farms have lower sales is needed, especially if these farmers are using their limited off-farm income to support their farming operation, as one study of Virginia producers foundReference Groover33. Full-time farmer status did not significantly impact total farmers' market sales nor did the percentage of sales from the FMNP. Cost-plus pricing increases annual total farmers' market sales by $2116, meaning farmers are not only covering their costs of production but are also increasing sales by using this method. This evidence should encourage farmers to keep accurate records of their costs and then allow an adequate profit margin when setting prices.
Using print media to provide information to customers increases sales by $1231, while the other methods had no impact (coefficients were not statistically significant). Customers apparently still prefer a familiar method of information provision, which they can retain for reference. Bargaining, when used as a promotional strategy, increases annual farmers' market sales by $2773. Bargaining likely increases the volume sold and, in addition, should satisfy the producer and the consumer by allowing both to agree upon a mutually acceptable price. Two promotional strategies were found to decrease total yearly farmers' market sales: selling ‘seconds or canning quality at a reduced rate’, which decreases sales by $1771, and selling ‘combinations of products in a package’, which decreases sales by $4173. While the drop in total sales from selling seconds is not surprising due to the lower sales price, selling combination packages (which are essentially ‘value-added’ products) was expected to increase sales. This unexpected result may imply that ‘packages’ also applied to sales of one product by volume (quart, pint, peck, etc.) or by the bunch as opposed to sales by weight, and prices by volume were relatively lower than prices by weight.
Percentage of household income from farmers' markets
Retired or part-time producers receive a 6.1 lower percentage of their household income from farmers' markets. This is not surprising as these vendors are more likely to have other sources of income such as a pension or off-farm job. As a vendor's level of education increases, his/her percentage of household income from farmers' markets decreases. For example, if a vendor with only a college degree obtains a master's or doctoral degree, the percentage of household income from farmers' markets would be lower by 2.7. This is a reflection of the higher earning power in an off-farm job for those with higher education, resulting in a decrease in importance of farmers' market income.
The percentage of household income from farmers' markets decreases by 9.7 when using the combination package promotional strategy and by 6.4 when selling seconds or canning quality at a lower price. This is not surprising as both of these methods also reduced total farmers' market sales. Neither bargaining over price nor buy-one-get-one-free strategies affected the percentage of household income obtained from farmers' markets. None of the methods used to provide information to customers were significant. Using cost-plus pricing increases the percentage of household income from farmers' markets by 6.7, as it also increased total farmers' market sales. Adding one more product to the mix available for sale at the market increases by 0.5 the percentage of household income from farmers' markets. This is consistent with a previous study of West Virginia consumers which found that limited volume and variety were more significant issues than prices in deciding whether or not to patronize farmers' marketsReference Jack and Blackburn14. Product diversity may thus be a good indicator of the degree to which producers can rely on market sales for income. Although, as expected, when satisfaction with farmers' markets profits increased, so did the percentage of household income derived from farmers' markets, this variable was not statistically significant.
Amount of household income from farmers' markets
Household income from farmers' market sales was positively influenced by the distance the vendor traveled to market his/her products. A 1 mile increase in distance traveled would increase annual household income from farmers' markets by $107. This is most likely a reflection of the distance that some vendors travel to reach more urban markets, which typically have higher prices and more customers. Govindasamy et al. Reference Govindasamy, Hossain and Adelaja28 found that farmers selling in urban or suburban areas were more likely to have higher farm income.
Using print informational methods increases household income from farmers' markets by $1796, as it also increased total farmers' market sales. Selling combination packages decreases household income by $5712. In addition, using the ‘buy a certain number, get one free’ promotional strategy decreases annual household income from farmers' markets by $2984. This latter effect may be due to a decline in the number of customers who preferentially buy in bulk, making the promotional offer appealing to a limited number of shoppersReference Miller29. Bargaining over price and selling seconds at a reduced rate did not have a significant impact on household income, and neither did using cost-plus pricing.
In regard to employment status, vendors who were retired or only worked part time at their farmers' market operation had lower household income from farmers' markets by $2748. Not surprisingly, as education level increases, the amount of household income from farmers' markets decreases; this variable was not significant, however. A one point increase in the level of satisfaction with farmers' market profit margins increases the amount of household income generated from farmers' market sales by $1742. This is not surprising, as farmers who are satisfied with the profitability of their farmers' market outlets may be more likely to emphasize it in their marketing strategy and consequently rely on it as an important income source.
Limitations
This paper addresses farmers' market vendors, providing a limited look at factors impacting the supply side of the market while not including important aspects of the demand side. Future research plans include a survey of farmers' market customers in West Virginia, which should provide a more complete picture. In addition, characteristics of the markets themselves are not included. Factors such as market location, organizational structure, and age of the market might all influence vendors' total salesReference Feenstra and Lewis27. For farmers who sold at more than one market, we do not know which market was more important for sales or income. It would also be useful to have relevant information from farmers who directly market their products but do not use farmers' markets; however, this survey was only of farmers' market vendors. Due to reluctance of survey respondents to provide detailed data on farm sales and household income, dependent variables are not the exact amounts earned but instead had to be created from ranges. Although we do know whether farmers sold at farmers' markets outside of West Virginia, we do not know where those markets are or how important sales at those outside markets were to farm or household income. Future research into the spatial relationships between farm location, markets and customers could provide valuable insight. In addition, results from this study are for a relatively rural state and may not apply to urban areas.
Conclusion
A 2004–2005 survey of West Virginia farmers' market vendors found that retired and part-time vendors were significantly different from full-time producers, both with and without off-farm jobs. Full-time producers, not surprisingly, were more likely to have higher total farmers' market sales as well as earning a higher percentage of annual household income from farmers' markets. Econometric estimation was used to analyze the factors that impact total farmers' market sales in addition to the amount and percentage of household income from farmers' markets.
Given the results, vendors, market managers and Extension educators can target as priorities the specific practices that are shown to increase sales levels. With a better understanding of vendor demographics and the degree to which part-time, retired and full-time vendors rely on markets for income, markets and educators may more appropriately tailor tools for vendor recruitment and outreach. Limited-resource producers with a higher reliance on market sales for income may have unique educational needs relative to part-time or ‘hobby’ farmers. For vendors hoping to obtain a greater percentage of their household income from farmers' markets, selling more days of the week, more weeks of the year and more products overall may be a good start.
For many of West Virginia's diverse small farms, farmers' markets represent an essential outlet for the direct marketing of diverse agricultural products. Due to the seasonality and relative unpredictability inherent in farming, producers should benefit from research-based predictors of sales and market income. These results allow us to conclude that an extended farmers' market season as well as product diversity allow vendors to increase sales and the degree to which they can rely on markets for income. In addition, offering printed materials to customers is more effective than offering discounts for seconds/canning quality or combining products into a package. While bargaining may increase total market sales, it appears that strategic ‘cost-plus’ pricing is even more effective at increasing the amount and percentage of household income from farmers' markets. Such information should prove useful for vendors, market managers and educators, as communities nationwide seek to develop and improve upon viable direct-marketing alternatives to cultivate sustainable local food systems.
Acknowledgements
We would like to thank Alan Collins of WVU for his valuable suggestions, the USDA Northeast Sustainable Agriculture Research and Education Program (SARE) for its financial support of this project, and most importantly, the many vendors who generously shared their time and insight by completing the survey.


