


Cambridge University Austerdalsbre Expedition 1955, Paper No. 1
Introduction
One of the major outstanding problems of glacier flow concerns the waves which are frequently observed to form at the bottom of ice falls, and the relation of these waves to the dark and light regions of the Forbes bands lower down. Many hypotheses have been proposed to account both for the waves and the bands, but very few measurements have been made which can enable us to judge between the various theories. It is clearly fundamental to an understanding of the whole phenomenon to know how the waves arise. They could occur by differential ablation or by flow, and while their annual spacing might seem to favour the former explanation, their shape is so regular that flow is usually assumed to be responsible. How such waves, with a wavelength of one annual flow distance, can arise as a result of the flow of a glacier whose depth is probably quite as large as this wavelength has not been shown, but if it were certain that flow were responsible, then effort could be devoted to a detailed study of the flow in such a region with more certainty of success. If further experimental data were available on the nature of the flow in the region of wave formation then the analysis would be able to proceed with fewer unknown quantities.
The Cambridge Austerdalsbre Expedition 1955 set out primarily to study this problem. The glacier selected was Austerdalsbreen, one of the tributary glaciers from Jostedalsbreen, the southwest Norwegian ice cap. The location of this glacier, and measurements of velocity across the glacier in 1937, can be found in a paper in this Journal by FinsterwalderReference Finsterwalder 1 . The ice which forms Austerdalsbreen descends from Jostedalsbreen down two ice falls, known as Odinsbreen and Thorsbreen, each some 800 m. high, see Figs. 5 and 6 of Reference Bull and HardyRef. 2. Most of the ice appears to come down the southern of these falls, Odinsbreen, and it was this ice fall that was studied in the measurements reported here. Below the ice fall the waves are very clearly seen, and survey measurements were made on them, which will be reported separately. The main result which will be quoted here is that the wavelength between the crests was within the experimental error, equal to the distance the ice would flow in a year at all points, although both wavelength and velocity of flow changed by a factor two within the region where the waves were visible.
Above what could clearly be distinguished as the first wave, the ice is much steeper, and the ice fall is approached. The tunnel was constructed as far as could reasonably be reached up the ice fall by unroped parties of tunnellers (Fig. 1, p. 745). It was sited as closely as could be judged at the point of maximum velocity of the ice, and the tunnel axis was placed in a direction that was judged to be close to the horizontal component of the direction of flow. Stakes were drilled into the ice along the line of the tunnel from a point 30 m. below the tunnel entrance to a point 45 m. above it, measuring in both cases along the glacier surface, which was at 26° to the horizontal.
Odinsbre ice fall from the bottom; the tunnel can be seen on the left

The tunnel was constructed during July and August 1955 by voluntary labour of university undergraduates and members of the Brathay Exploration Group. The method of construction was similar to that used previously during the Cambridge Jotunheim Expedition 1951, described by McCallReference McCall 3 . The ice of Austerdalsbreen proved to be harder to dig than that of Vesl-Skautbreen, and the much higher ablation removed over 30 ft. (10 m.) of tunnel length during the two months. A further difficulty was experienced due to the high rate of rotation of the tunnel axis; the rear end of the tunnel was sinking relative to the front at about 14 minutes of arc per day, so that the tunnel was soon dipping downwards, and meltwater began to accumulate in it. As a result of this much effort had to be devoted to digging out the tunnel mouth, so that a sudden inrush of water would not trap workers in the tunnel. Despite all these difficulties, the tunnel reached a length of 150 ft. (46 m.) by the 21 August and it was then decided that, as bedrock was probably not within our reach, the survey of the tunnel should take priority over tunnelling activities for the remaining 11 days. A view from the far end of the tunnel is given in Fig. 2 (p. 745). This paper reports the results of the survey and the deductions that can be drawn from them in conjunction with the results of surveying the surface stakes on the line of the tunnel.
The tunnel under Odinsbre ice fall, Austerdalsbre, seen from the far end. Owing to rotation of the ice the tunnel collected water which can be seen in the foreground

Survey Method
The measurements of ice movement in the tunnel were made by surveying with a level and tape the displacements of small bamboo pegs inserted into the wall of the tunnel. The pegs were made by slicing bamboo rods lengthwise. They were about 12 cm. long, and 6 × 3 mm. in cross-section. A hole was bored into the ice by hammering in a metal meat skewer, whose maximum radius was somewhat less than the maximum width of the peg. The peg could then be hammered into the hole, and was firmly gripped. Two pegs were placed, one in each wall, at approximately the following distances into the tunnel from the entrance stake (owing to the fact that all the survey equipment was calibrated in feet, British units were used): 10 ft. (3 m.), 25 ft. (7.6 m.), 50 ft. (15 m.), 75 ft. (23 m.), 100 ft. (30 m.), 125 ft. (38 m.) and 145 ft. (4.4 m.). The entrance stake consisted of a bamboo rod drilled vertically into the tunnel floor. Owing to the fact that this stake was in the line along which ran the sled used by the tunnellers to remove debris, it was broken off at the top as ablation removed surface ice, and so it was of no use for vertical measurements. A further stake, some 7 ft. (2 m.) further out, was used to site the level.
In order to make a survey the level was established above the stake used for the purpose,Footnote * and the level staff was placed at one of the sites in the tunnel near to a pair of pegs. The level was read directly by the observer at the telescope if possible, but if not, due to the darkness in the tunnel (see Fig. 2), a small electric light bulb was moved vertically until the telescope observer signalled that it was on his horizontal cross-wire. The reading of the level staff was then taken. Without moving the staff, the level of each of the pegs was measured by setting a straight edge between the peg and the level staff, using a spirit level to keep the edge horizontal. The difference between these measurements and the reading on the staff from the telescope cross-wire gives the vertical distances of the pegs from the line of sight of the level. An attempt was made to measure the horizontal movement of the pegs in the cross-tunnel direction by measuring their distances from the line of sight, but inaccuracies in resetting the horizontal angle of the line of sight made these readings of little value.
The distance between the ends of each pair of pegs was also measured to give the rate of closing of the tunnel, and finally the distance between successive pegs on the same side of the tunnel was measured using a tape.
These measurements were made as frequently as possible between 22 August and 1 September 1955, as it was found that quite measurable differences in the readings were obtained in a few hours. The results are reported in the next section.
The surface stakes arranged along the surface above and below the tunnel were surveyed at about weekly intervals by means of theodolite observations onto fixed points on the rock walls. I am indebted to Mr. A. Young and Dr. C. A. M. King for these observations, and to Mr. J. E. Jackson for computing the results of this survey. The stakes were rebored in the usual way, and the results have been computed so as to give the coordinates at each survey time of the piece of ice which was at the surface of the glacier when the final survey was made on 1 September.
The shape of the glacier above the tunnel was surveyed in greater detail by Dr. King and Mr. G. de Boer using tacheometry. Contour lines were drawn for about a distance of 100 ft. (30 m.) either side of the line of the tunnel from the contour 20 ft. (6 m.) below the tunnel entrance to the contour 200 ft. (61 m.) above it, the vertical contour distance being 10 ft (3 m.). The vertical section through the tunnel constructed from it is shown in Fig. 3 (p. 739).
Vertical section through the ice fall above the tunnel

Results
This section presents the results of the survey operations, discussion of them being deferred to the next section. The measurements in the tunnel were much more accurate than those outside owing largely to the effect of ablation on the surface stakes. The splints in the walls suffered very little from ablation, and only those nearest to the tunnel mouth even became loose during the ten days of observation. The individual level readings are accurate to ±0.01 ft. (3 mm.), and so the relative heights of two splints are accurate to ±0.02 ft. (6 mm.). The taped distances are accurate to about

Relative vertical movements in the tunnel. The levelling procedure described in the last section determines the relative vertical heights of all the pegs in the tunnel walls. To get the absolute vertical movements the absolute vertical movement at the tunnel mouth must be deduced from the surface survey, but much interesting information can be obtained from the relative movements alone, especially as they are comparatively accurate.
During the ten days of observation surveys were made on most days and so it is possible to see whether the flow is regular by plotting the relative heights of two of the pegs against time. In Fig. 4 (p. 739) I have plotted the change in relative vertical distance between the 10 ft. peg and several other pegs against time, and it will be seen that the rate of change of relative heights was very regular. After 140 hours the level had to be sited at the far end of the tunnel for the reason stated above, and at that point the relative heights appeared to have changed much less than expected. If it is assumed that this is due to a slight inaccuracy in the horizontal line of sight, this can be compensated for, and this has been done in Fig. 4. However, as it was in this period that dynamite was tested as a method of tunnelling, it is possible that the explosions were responsible, though it seems most unlikely that they would produce a sizeable retardation of the flow. Between 193 and 214 hours three surveys were made, the first at nightfall, the second in the morning and the third in the afternoon (19.30, 07.30 and 14.30 hr. respectively) to see whether a change in flow rate between night and day could be detected. Unfortunately the day chosen turned out to be very rainy, whereas until then the weather had been very fine, but the flow rate showed no marked difference from the mean over any of these periods.
Fall of pegs in the wall of the tunnel relative to the peg at 10 ft. plotted against time

These measurements show that the back of the tunnel was falling relative to the front comparatively rapidly. This might be due to a rotation of the ice acting as a rigid body, or to a uniform shear throughout the region. In either of these cases, however, the relative fall should be proportional to the distance from the front, that is to say that a horizontal line drawn along the tunnel would cease to be horizontal, but would remain straight. To see whether this type of movement was occurring in the tunnel, we must plot the relative movements of the pegs against their horizontal distance along the tunnel. This has been done in Fig. 5 (p. 739), and it will be seen that as well as rotating, the axis of the tunnel was being bent—i.e. the tunnel was an active anticline. This bending appears to have been particularly active near the 75 ft. peg, whereas at the far end of the tunnel very little bending has occurred.
Fall of pegs in the wall of the tunnel relative to the peg at 10 ft. after 10 days, plotted against distance down the tunnel

In all these measurements the pegs on the two opposite walls of the tunnel behaved similarly, and served as a check on the accuracy of the measurements.
Relative horizontal movements in the tunnel along the direction of its axis. The taping procedure gives the rate at which any two pegs in the same wall of the tunnel were approaching each other, i.e. the relative horizontal movement. This is directly interpretable as a compressive strain (the relative vertical movements are not directly interpretable as a shear strain, as they could be due in part to rotation). It was found that the pegs were approaching each other, and that this rate of contraction was faster near the tunnel mouth. Thus for example in 8 days the distance between the 25 and 50 ft. pegs decreased continuously from 24 ft.


Change in the taped distance between the pegs at 25 ft. and those at 50 ft. plotted against time

Longitudinal strain rate in the tunnel plotted against distance along the tunnel

Rate of closure of the tunnel. Measurement of the rate of approach of the pegs in the opposite walls of the tunnel gives a measure of the horizontal rate of closure of the tunnel. As with both the previous sets of measurements, the closure appeared to be linear with time (Fig. 8, p. 739). The rate varied from 0.10 in./day (0.25 cm./day) at the 25 ft. pegs to 0.41 in./day (1.04 cm./day) at the 125 ft. pegs (Fig. 9, p. 739). The 10 ft. pegs could not be used to give this measurement, as ablation was too severe there, while the 145 ft. pegs were situated in an alcove at the far end of the tunnel, where the tunnel cross-section was rather different from elsewhere. They gave a rather smaller value of the closure than any neighbouring pegs and a further complication arose as one of the 145 ft. pegs was blown out during the dynamiting, so that complete records for this station are not available.
Decrease in distance between the ends of the two pegs at 125 ft. plotted against time

Rate of approach of pegs in the opposite walls of the tunnel plotted against distance along the tunnel

As the tunnel was only about 2 ft. (61 cm.) wide, these rates of closure are very high. At the 125 ft. pegs the width decreased from 2 ft.


Surface movements. The velocity of the stakes on the surface of the glacier could be determined absolutely from the difference between the coordinates of the stakes on separate occasions. The surveys which will be used in this work were made on 6 and 19 August and 1 September. They thus gave two values for the mean velocity over thirteen days, and the second interval includes the period during which the tunnel measurements were made (22 August to 1 September). The plan and elevation of the positions of the stakes are shown in Fig. 10 (p. 741). Unfortunately the exact movement of the tunnel zero stake was only determined during the first period. The reason for this was that, as has been described above, the top of this stake was frequently knocked off by the tunnelling sledge and so the vertical movements of this point were determined from a metal marker in the wall, which however ablated out and was lost during the second period. Thus while the horizontal movement of the tunnel mouth stake can be shown on the plan from measurements, the vertical movement in the elevation diagram has had to be interpolated.
Velocity vectors for the stakes on the surface of the glacier. Tite arrows join the positions in space occupied on 6 and 19 August and 1 September 1955 by ice which was at the surface of the glacier at the stakes on 1 September. The glacier profile drawn in the vertical section is the approximate position on 1 September

The figure shows that the line of the stakes and tunnel was about 9° from the direction of flow. The vertical section shows that the velocity vectors run parallel to the general trend of the surface slope rather than to the actual surface slope. The surface which has been drawn in is the final position and is taken from the levelling survey, which necessarily averages over the serac-covered surface of the ice fall. This explains why the ice at the base of Stake 4, which was at the surface at the time of the final survey, does not appear to be so in this figure. It must be remembered that the vectors represent the positions previously occupied by the particles of ice which end up on the surface. At the lower end the vectors overlap, and from the positions of Stakes 2 and 1 we can see that the position occupied by the reference ice of Stake 2 on 19 August was below that occupied by the reference ice of Stake 1 13 days earlier. If allowance is made for the fact that the reference ice of Stake 1 had 7.6 ft. (2.3 m.) more ice above it before the surface was reached (this being the ablation as measured at Stake 1 during the 26 days before the reference ice came to the surface) while on 19 August the reference ice of Stake 2 had 3 ft. (0.9 m.) of ice above it, then it will be seen that the surface of the ice at the point in space where Stake 1 was originally had fallen by about ft. (2 m.) in 13 days. This quantity is interesting, as it is a better measure of the reduction of ice in this part of the glacier than the measurement of ablation at a point moving with the glacier. Between Stakes 1 and 2 the velocity vectors are roughly parallel to the local surface; however, when a crest approaches a point in space the ice surface at that point actually rises. Thus at the point originally occupied by Stake Tu (the tunnel entrance on 6 August) the ice surface was originally about 6 ft. (2 m.) above the reference ice, whereas 26 days later the ice surface, as seen on the figure, was 11 ft. (

With the information from these various surveys, it is possible to construct a diagram (Fig. 11, p. 741) showing the velocity vectors all along the tunnel and the velocity of Stake 4 above, all relative to the tunnel entrance stake. In this diagram a rotation sufficient to keep the line joining the tunnel mouth stake to the pegs at 125 ft. in the same line, has been subtracted from all velocities. If this were not done, the rotations would obscure the other velocities. In this diagram also the position occupied by the reference ice of Stake 4 is above the mean glacier surface because of the serac-covered nature of the ice fall.
Velocity vectors for the pegs in the tunnel and surface stake 4, relative to the tunnel entrance stake. A rotation has been subtracted from all vectors to make the relative velocity of the 125 ft. peg horizontal. The stress system deduced in the text from these relative velocities is shown in the centre

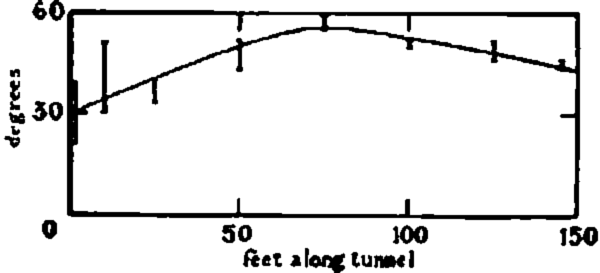
Ice banding. Inside the tunnel the banding of the ice could be clearly seen. Thick blue layers were commonly observed, and were probably due to filled-in crevasses. Their directions did not appear to be regular. A fine banding was observable, and appeared to be regular in direction. Fig. 12 (p. 745) gives a good impression of this structure. As this strongly resembles the banding seen from the surface lower down the glacier, and there associated with the Forbes bands, it is of interest to see whether these bands have any particular relation to the flow at the tunnel. Their dip and strike was measured with an Abney level and a compass, at various points along the tunnel length. They dipped up glacier at an angle which at first increased on entering the tunnel, but which Iater decreased again, as shown in Fig. 13 (p. 741). The strike of the bands at the tunnel mouth was 15° away from being perpendicular to the tunnel axis, in such a direction that it was only 9° from being perpendicular to the direction of flow. From about the 50 ft. peg, however, the strike changed to being 10° away from perpendicular to the tunnel axis on the other side, and thus at 16° to the direction of flow. Fig. 12 shows another interesting feature of the tunnel. Along its length several cracks developed in the wall approximately parallel to the glacier surface. At first only one, near the tunnel mouth, was noticed, then one about 50 ft. along opened up, and finally one appeared near the 100 ft. peg. Their significance will be discussed below.
Banding in the wall of the tunnel. Note also the crack which is roughly parallel ta the surface. Scale one-third full size Photograph: Miss J. Thomas

Dip of the fine hands plotted against distance along the tunnel. The vertical lines show the spread had angles found
Discussion
The velocity vectors shown in Fig. 11 suggest that the ice in the region of the tunnel is undergoing an anticlinal bending, and that a ridge is in process of being formed above the tunnel. The horizontal compression in the tunnel is largest near the mouth, as one would expect if it is here that the ridge is forming. The surface profile above the tunnel shows that there is a generally convex slope, so that this bending is tending to accentuate a ridge already present on the surface. Unfortunately the surface measurements are neither close enough together nor accurate enough for variations in strain rate on the surface to be deduced from them, but they are accurate enough to confirm that there is a compressive strain rate in the ice surface over the whole tunnel region. The rate of compressive strain between the top stake (4) and the bottom stake (1) was 0.77 per year for the first 13 days (6 to 19 August) and 0.70 for the second 13 days (19 August to 1 September). Using the interpolated value for the vertical velocity at the tunnel mouth the complete strain of the vertical triangle consisting of the tunnel mouth stake, the 125 ft. peg and the Stake 4 can be found, and, if it is further assumed that no shear strains take place except in the plane of this triangle, the complete strain rate tensor in this region can be deduced.
It so happens that the line from the tunnel mouth stake to the 125 ft. peg is very nearly horizontal, and the line from the 125 ft. peg to Stake 4 very nearly vertical. It is therefore convenient to take axes so that the x-axis is horizontal along the tunnel, the positive direction pointing down glacier, the y-axis vertical and positive downwards, and the z-axis perpendicular to these two. In this co-ordinate system we know the component velocities u and v parallel to the x- and y-axes for the three vertices of our triangle:

and the lengths of the sides of our triangle:

From these figures the average strain rates over the triangle can be deduced from the equations:

This gives

The values of the principal strain rates can be found from these components by the normal methods of tensor analysis. The result of this calculation is that the principal strain rates (i.e. the maximum and minimum tensile strain rates) are 0.92 per year and −0.96 per year at an angle of 36° to our coordinate system. The maximum compressive strain rate is thus 0.96 per year in a direction dipping down glacier at 36° to the horizontal. It is interesting to compare this with the observed dip of the fine banding (Fig. 13). For the greater length of the tunnel the bands dipped at about 50° up glacier, and were thus within 5° of being perpendicular to the direction of maximum compressive strain rate (and hence presumably maximum compressive stress).
We can actually estimate the magnitude of this stress if we assume that the law found in laboratory testsReference Glen 4 also applies in the glacier. First we note that, as the density of ice does not change appreciably in this part of the glacier, the sum of the three principal strain rates must be zero, and so we can deduce that the third principal strain rate is +0.04 per year. This means that the ice at the surface should be expanding laterally very slowly, though the accuracy of the other two principal stresses is probably not sufficient to make even the sign of this certain. The expansion in this direction could be measured on the surface, and it is hoped to do this in the summer of 1956. If we assume, as does NyeReference Nye 5 , that the octahedral shear stress is a function of the octahedral shear strain rate and that the principal stress deviators and strain rates are proportional and parallel, then we can deduce the stresses acting at this point in the ice from the laboratory results. Using the results found for the analysed creep curvesReference Glen 4 we deduce that the principal stress deviators are −1.59, 1.52 and 0.07 bars (1 bar ≡ 106 dyne cm.−2).
At the surface a compressive stress in the ice must act parallel to the surface, and so we may reasonably be surprised to find the principal stress acting at 36° to the horizontal when the surface slope is only about 29° to the horizontal. However, the stress we have calculated is some average over the whole of our vertical triangle, and below the surface there will be some stress due to the weight of the overlying ice as well as any longitudinal compressive stress. Half-way down to the 125 ft. peg, for example, the weight of ice gives a shear stress parallel to the surface of 0.4 bars, and this could account completely for the figure of 36°. If this interpretation is made, then we can say that at a point within the triangle where the second principal stress is about 0.7 bars (the actual figure taken depends only on the depth below surface of the point considered), the components of stress can be found by adding 1.52 + 0.7 = 2.22 bars hydrostatic pressure to the stress deviators found above, so that the principal stresses are 3.8 bars compressive dipping 36° down glacier, 0.7 bars compressive dipping 54° up glacier and 2.2 bars compressive across-glacier (perpendicular to the tunnel axis and the vertical), as shown in Fig. 11.
At the surface itself the stress perpendicular to the surface must be zero, and so, if we assume that the compressive stress parallel to the glacier surface varies only by the change in hydrostatic pressure due to the weight of ice, then the stresses at the surface can be deduced to be 3.0 bars compressive down glacier and 1.5 bars compressive across glacier. In Nye’s analysis of the ideally plastic glacierReference Nye 6 , Reference Nye 7 the longitudinal compressive stress acting in addition to the hydrostatic component decreases with depth, and so this value is likely to be a minimum value for the actual surface stress.
The result of this analysis is therefore that, in the top 60 ft. (20 m.) of the glacier there is a compressive stress acting parallel to the glacier surface of about 3 bars, as well as any hydrostatic pressure in the ice.
The tunnel closure also leads us to suspect that there is a compression in the ice other than the hydrostatic pressure. The rates of closure observed are very large, and if they are analysed as Nye has suggestedReference Nye 5 , they yield points that lie even further from the Z’Mutt and Vesl-Skautbre tunnel points than do those from the Arolla tunnel.
Fig. 14 (p. 741) shows the points obtained on a graph of rate of closing versus pressure of overlying ice derived in the same way as Fig. 1 in Nye’s paperReference Nye 5 using the width of the tunnel as “radius” of the hole. In order to compare these results with laboratory tests it is necessary to assume a value for the exponent in the power law relation between stress and strain rate. As will be seen from Fig. 14, the slope of the best straight line through the Austerdalsbre points is approximately unity, but this would not be the right slope to assume in the conversion, as we are sure of the presence of a compressive stress down glacier. Nye’s theory cannot deal with this case, as he assumes that the hole is in a region of essentially hydrostatic pressure, but to show how the points are related to those found in other investigations, I have transferred them to a plot of octahedral stress versus octahedral strain rate assuming the exponent in the power law found for the Z’Mutt and Vesl-Skautbre tunnels. The result is shown in Fig. 15 (p. 741).
Double logarithmic plot of contractions of tunnel width against the pressure p that would be caused by the overlying ice if the tunnel were not there. The line for the Vesl-Skautbre and Z’Muit tunnels and the point for the Arolla tunnel are from NyeReference Nye 5

Double logarithmic plot of octahedral shear strain rate y against octahedral shear stress r for various experiments. The Austerdalsbre points have been transferred assuming the power law found for the Vesl-Skautbre and Z’ Mutt tunnels. The other lines have been derived from NyeReference Nye 5 and GlenReference Glen 4

This analysis shows that the rate of tunnel closure is much faster than would be predicted from the pressure of overlying ice alone, and to this extent it confirms the existence of the longitudinal compressive stress, but, in order to account for the observed closure rates, a pressure of up to 10 bars would be needed, and this is far higher than any stresses present in this region of the glacier according to our analysis. The closure rates are thus anomalously high, even allowing for the existence of the longitudinal stress. This may be due to the effects of transient creepReference Glen 4 , as the tunnel had been dug within the month preceding the measurements, whereas all the results analysed by NyeReference Nye 5 were for the closure of tunnels during at least a year.
The cracks observed in the tunnel wall (cf. Fig. 12) parallel to the surface are therefore also approximately parallel to the line of action of the longitudinal stress, and their presence is further evidence for the longitudinal compressive stress. On the surface of the glacier near the tunnel large lumps of ice appeared to be flaking off, again suggesting longitudinal compression.
The observations in and near the tunnel thus all confirm in a most striking way the prediction made by NyeReference Nye 6 , Reference Nye 7 that in a region of concave surface and in the ablation area the glacier will be undergoing passive or compressive flow, characterized by a longitudinal compressive stress and a thickening of the ice. Crevassing in such a region should be parallel to this stress, i.e. either parallel to the surface, such as that observed in the tunnel, or, particularly if the glacier is widening, in a longitudinal direction ; longitudinal crevasses are in fact much in evidence below the tunnel on Austerdalsbreen.
The tunnel described here has many features in common with the tunnel under the Mont Collon ice fall above the Arolla Glacier described by HaefelisReference Haefeli 8 . In that case the tunnel axis seemed to be an active syncline, and, at any rate near the inner end of the tunnel, the tunnel length was extending. The latter phenomenon can easily be explained- from the peculiar shape of the bed rock found by Haefeli, as the glacier was expanding into a cleft in the bed bounded by an almost vertical rock face. The most striking similarity between the two tunnels is that both showed high closure rates, as can be seen in Figs. 14 and 15.
As well as the deductions that we have made about the state of strain rate and stress in the ice, there are many other interesting results which follow from the detailed knowledge of the flow we have obtained. Thus the velocity measured at each stake decreased from the first to the second period of measurement, but this may be due to the piece of ice in question having moved onto a part of the glacier with smaller slope and slower flow rate. In Fig. 10 it can be seen that Stake 2 in the second 13 days moved over very much the same path as Stake 1 followed in the first 13 days. The velocity of Stake 1 in the first period was 3.00 ft. per day (91 cm. per day); that of Stake 2 in the second period was 2.98 ft. per day (91 cm. per day)—the same to within experimental accuracy of the surface survey. Other interesting observations of this sort can be made, but space does not permit a full discussion of them here.
All these results will be of greater value if further data are available from the 1956 field season to supplement them. It is the intention of the Cambridge Austerdalsbre Expedition to provide as many data as possible on the at present mysterious problems of wave formation and Forbes bands; at the same time it is hoped that a full knowledge of the stresses and flow in ice falls will help to solve the problem of glacial erosion beneath ice falls.
Acknowledgments
In work such as that here described, the assistance of large numbers of people is essential if the project is to succeed. For this reason I cannot name personally all those who made the measurements possible, but I hope that they will understand that I am deeply grateful to them all. Mr. W. V. Lewis deserves special thanks for bringing the Cambridge Austerdalsbre Expedition into being and for his efficient leadership. I also thank the Royal Society, the Royal Geographical Society, the Mount Everest Foundation, the University of Cambridge and numerous Cambridge colleges for their financial support. To all those who dug I clearly owe special thanks, and to Mr. O. Sopp and Mr. G. de Boer who organized their efforts. The latter, together with Dr. C. A. M. King, Mr. J. Sharp and Mr. W. V. Lewis helped with the survey, and I am particularly grateful to them and also to those who helped with the booking &c. under miserable conditions in the tunnel. I am also greatly indebted to Mr. J. E. Jackson for the surface survey results, and to Dr. J. F. Nye for reading and criticizing the manuscript of this paper and for information about the behaviour of the waves lower down. Perhaps the last appropriate acknowledgment is to Odinsbre ice fall itself, which flowed so smoothly and so rapidly that these detailed results could be obtained in the course of 10 days in the glacier.
Dovrefjell. In the background Srdndtindan (2215 m.) and Snohetta (2286 m.) the highest and westernmost mountains showing no sign of extensive local glaciation during the jiniglacial stage. In the foreground lateral terraces built up against the tongue of dead ice in the Stroplsjodal.

Airphoto (taken 1937) from above the Hardangerjokul ice cap (summit 1876 m.), looking north-north-west. Kongsnut mountain crag (1576 m.) in left foreground between Kongsnuthre (glacier tongue left) and Bldis (glacier tongue right). Finsevatn (lake) in middle ground. The flat Onntsbre glacier (1600 m.) in right middle background, with the Storskavl glacier (1729 m.) of similar type in distant left background



