In the last several years consumers are increasingly more aware of the presence in foods of compounds with physiologically positive effects which appear to be correlated with better overall health. Minor components of the milk lipid fraction, such as conjugated linoleic acid (CLA) have been shown to have anticancer effects (Parodi, Reference Parodi2003), or provide an increased protection against cardiovascular diseases (Elwood et al. Reference Elwood, Givens, Beswick, Fehily, Pickering and Gallcher2008). Thus, research efforts have been directed to increase the concentration of certain FA by modifying feeding management (Jenkins & McGuire, Reference Jenkins and McGuire2006). Studies in sheep and goat milk reported in the scientific literature could be grouped into three major strategies: (1) grazing on cultivated or naturally occurring pastures, supplemented or not with concentrate (Atti et al. Reference Atti, Rouissi and Othmane2006; Cabiddu et al. Reference Cabiddu, Decandia, Addis, Piredda, Pirisi and Molle2005; Biondi et al. Reference Biondi, Valvo, Di Gloria, Tenghi, Galofaro and Priolo2008); (2) modifying the forage:concentrate ratio, and supplementing it in many cases with various amounts of vegetable oils (Sanz-Sampelayo et al. Reference Sanz Sampelayo, Chilliard, Schmidely and Boza2007; Martini et al. 2010); and (3) directly including in the concentrates vegetable or fish oil, or oil seeds, (Luna et al. Reference Luna, Fontecha, Juárez and de la Fuente2005; Toral et al. Reference Toral, Frutos, Hervás, Gómez-Cortés, Juárez and de la Fuente2010; Mele et al. Reference Mele, Contarini, Cercari, Serra, Buccioni, Povolo, Conte, Funaro, Banni, Lercker and Secchiari2011), or even cereal concentrates (Gómez-Cortés et al. Reference Gómez-Cortés, Frutos, Mantecón, Juárez, de la Fuente and Hervás2009). Of these three general approaches, pasture grazing allows the sheepherder to reduce production costs while playing an important role in maintaining the landscape (Hodgson et al. Reference Hodgson, Forbes, Armstrong, Beattie and Hunter1991).
Most grazing studies have been carried out with small experimental flocks during a few weeks or, at the most, during one season. Thus, the applicability of their results to modify milk fatty acid composition in commercial flocks is not well established because studies conducted with commercial flocks, under commercial milk production conditions, are scarce. To the best of our knowledge, the milk fatty acid composition of commercial grazing flocks was studied by Tsiplakou et al. (Reference Tsiplakou, Mountzouris and Zervas2006). Milk samples from six flocks of an unknown number of lactating ewes were taken monthly throughout lactation, with grazing as the only source of feed from April onwards. Luna et al. (Reference Luna, Fontecha, Juárez and de la Fuente2005) also studied five commercial flocks, each one consisting of a different breed of sheep. However, no information is provided regarding the feeding regimen of the animals and, although milk samples were taken monthly throughout lactation, milk fat samples from each flock were combined into only one sample, thus yielding an average milk fatty acid composition for each flock.
Grazing is a traditional management system to obtain traditional milk and meat products, strongly linked to the territory (Licitra, Reference Licitra2011), and increasingly favoured by consumers who perceive them as more natural than products obtained by indoor feeding based on concentrate and forages. In the Basque Country of Northern Spain sheep milk production by the latxa breed is almost entirely used for cheese making, particularly Protected Denomination of Origin Idiazabal Cheese. Part-time grazing is the most frequently used flock management system for much of the lactation period from late winter to early summer, depending on the agroclimatic conditions (Oregui & Falagan-Prieto, Reference Oregui and Falagan-Prieto2006). Our objective is to determine the suitability of part-time grazing under commercial milk production conditions to produce milk with increased concentrations of unsaturated FA and CLA. We report herein our studies during two consecutive years on the FA composition of milk of 10 commercial flocks with part-time grazing as common management feature, located in 2 geographically different regions, throughout lactation. The FA composition of cheeses made with these milks is also reported to assess the relationship between milk and cheese fat composition in a commercial setting.
Materials and Methods
Milk and cheese samples
Ten commercial flocks of latxa dairy breed were selected. All farmhouses were members of the Protected Denomination of Origin Idiazabal Cheese (Basque Country region in Northern Spain) and flocks had between 200 and 400 lactating ewes during the study period. The management feature common for all flocks was part-time grazing during spring and early summer. Lambing periods extended approximately for 45 d in winter, and lactation lasted 4 to 5 months, from late winter to early summer. Although all farms were at an altitude of between 600 and 700 m, five farms were located on a flatland and relatively dry region (zone 1) and the other 5 were more dispersed over a humid area (zone 2). The study reported herein was carried out in two consecutive years. Average day temperature (Basque Metereology Agency web page) in both zones was similar during the two years but rainfall was significantly higher in zone 2 than in zone 1, and the amount of rain of the 2nd year in early spring was double that of the 1st year (Table 1). As a reference for physiological changes not due to the feeding regimen, during the second year milk samples were collected from an experimental reference flock of 24 latxa dairy sheep kept indoors throughout lactation. It was necessary to use an experimental flock because no latxa commercial flocks are kept indoors all through lactation. This flock was kept at the NEIKER-Tecnalia Research Institute facilities (Arkaute, Alava, Spain).
Average values (means±sd) of day temperature (°C) and rainfall (mm/d) for the two geographical zones in which sheep were allowed to graze

† Indoor feeding: from the beginning of lactation (late January or early February) until the animals were taken out to pastures, usually at the end of March or in the first days of April
‡ Transition feeding: from the beginning of April until mid-May
§ Outdoor feeding: from mid-May until the end of lactation (early summer)
The feeding regimen and average concentrate composition are described in Table 2. Information on the quantity and composition of the feed was collected from a questionnaire filled by the sheepherders on each sampling day. During the indoor period flocks were fed concentrate pellets and forage. Farmhouses used different commercially available concentrate formulations and the nutritional label of each concentrate formulation was collected. Forages were mostly conserved hay from sheepherders’ pastures, and prepared forages were purchased from local suppliers if needed. From late March or early April onwards, a part-time grazing management system was used. Flocks were taken out to pastures daily for a variable time between the morning and afternoon milkings, and received concentrate supplementation in stall during milking. From mid-May until the end of lactation, sheep grazed ad libitum for 6–12 h/d, either on cultivated, privately-owned grasslands dominated by ryegrass (Lolium perenne) and white clover (Trifolium repens), or on other community-owned seminatural polyphite grasslands. Flocks in zone 2 grazed an average of 2·5 h (transition period) or 1·5 h (outdoor period) longer than those in zone 1, most likely due to higher amounts of grass available. In general, in the 2nd year sheep were allowed to graze an average of 0·8 h/d longer than in the 1st year. The reference flock was fed the same amount of concentrate (0·8 kg DM/sheep) daily all through lactation (forage/concentrate ratio 1·3–1·6) (Table 2).
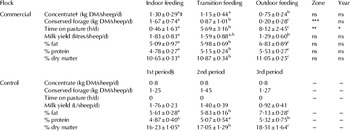
Average values (mean (sd)) of the feeding regimen, milk yield and gross composition of commercial and control flocks throughout lactation during two consecutive years

‡ a,b,c Different superscripts in the same row indicate statistically significant differences (P ⩽ 0·05)
§ The 1st, 2nd, and 3rd periods of the control flock corresponded to the indoor, transition, and outdoor feeding of the commercial flocks, respectively
† Average composition of the concentrate: dry matter 87·6%; crude protein: 19·5 g/100 g DM; crude fibre: 7·5 g/100 g DM; crude fat: 3·0 g/100 g DM; ashes 6·7 g/100 g DM
*P ⩽ 0·05; **P ⩽ 0·01; ***P ⩽ 0·001
ns: not significant (P > 0·05)
Sheep were fed significantly less concentrate as lactation progressed (Table 2). In each period there were no significant differences among farmhouses in the amount of concentrate given to the animals, either in the different geographical zones or from year to year. The amount of forage decreased also as lactation progressed with significantly smaller amounts of forage given to flocks in the wet zone (zone 2).
Samples of bulk milk (previous evening and morning milkings) from each flock (1·5 litres) were taken once a month throughout lactation (from February to early July). Milk samples were centrifuged at 2200 g for 30 min at 4 °C to separate the cream. Samples of whole and skimmed milk and cream were stored at −80 °C until analysis. During the second year, cheeses from each farmhouse were also collected at the beginning of the lactation period in winter (indoor period) and in late spring (outdoor period). These cheeses (∼1·5 kg) were made with the same milk collected at the corresponding times and were collected after 180 d of ripening. Two cheeses from the same vat were collected at each time of the year, with a total of 20 vats sampled (10 in winter and 10 in spring). Cheeses were cut in eight sections, vacuum-packed and frozen at −35 °C until analysis.
Milk and cheese composition analysis
Routine control analyses of milk of each flock were carried out in the Dairy Institute of Lekunberri (Lekunberri, Navarra, Spain) once a month. The following parameters were analysed for: percent protein (g/100 ml), percent fat (g/100 ml) and dry matter (DM; g/100 g) using the Method PE/ALVO/02 (2005) (Table 2). Cheese gross composition reported for ripened Idiazabal cheese throughout the manufacturing season was as follows: percentage dry matter (DM), 68·21 ± 1·87%, total fat percentage in DM, 52·06 ± 6·21%, and total protein percentage in DM, 34·81 ± 3·98% (Abilleira et al. Reference Abilleira, Collomb, Schlichtherle-Cerny, Virto, De Renobales and Barron2009).
Fatty acid analysis
A modified Folch method (Folch et al. Reference Folch, Lees and Stanley1957) was used to extract fat from cream and cheese samples. Briefly, 1 g of cream or ground cheese was dispersed in 40 ml chloroform: methanol: water (2 : 1 : 1) after adding internal standards (C5:0, C9:0, C17:1cis-9, C19:0 methyl esters, 5 mg each/ml in n-hexane). The chloroform phase was separated by centrifugation (2200 g, 15 min, 4 °C) and washed twice with 25 ml deionised water. The chloroform was removed under vacuum and the extracted fat was weighed. Extracted fat was then dissolved in toluene and glycerides were trans-esterified to the corresponding Fatty Acids Methyl Esters (FAME) by a solution of sodium methoxide in methanol as described by Christie (Reference Christie1982).
FAME were analysed by gas chromatography (Agilent 7890A, Palo Alto, CA) equipped with a flame ionisation detector, as described by de Renobales et al. (Reference De Renobales, Amores, Arranz, Virto, Barron, Bustamante, Ruiz de Gordoa, Nájera, Valdivielso, Abilleira, Beltrán de Heredia, Pérez-Elortondo, Ruiz, Albisu and Mandaluniz2012). FAME were identified by comparing the retention time of each individual compound with that of the corresponding reference substance: C4:0, C5:0, C6:0, C8:0, C9:0, C10:0, C12:0, C14:0, C16:0, C16:1cis-9, C17:1cis-10, C18:0, C18:1cis-9, C18:1cis-11, C18:1trans-9, C18:1trans-11, C18:2trans-9,trans-12, C18:2cis-9,cis-12, C18:2cis-9,trans-11, C18:2trans-10,cis-12, C18:3cis-9,cis-12,cis-15, and C19:0 acids. Quantification was done by the internal standard method (internal standards listed above). Results were expressed as μmol fatty acid/100 g fat because biochemical reactions and physiological effects are on a molar rather than on a gram basis.
Oxidative stability
Oxidative stability of the milk samples was determined as described by de Renobales et al. (Reference De Renobales, Amores, Arranz, Virto, Barron, Bustamante, Ruiz de Gordoa, Nájera, Valdivielso, Abilleira, Beltrán de Heredia, Pérez-Elortondo, Ruiz, Albisu and Mandaluniz2012). The capacity of the milk samples to scavenge the radical cation ABTS·+ (2,2′-azinobis[3-ethylenbenzothiazoline-6-sulphonic acid]) was compared with that of Trolox®, used as water-soluble model antioxidant. The milk fractions studied were whole milk, skimmed milk and whey. The Trolox® equivalent antioxidant capacity (TEAC) of milk is given as the equivalent amount of Trolox® in μmol/ml milk.
Statistical analysis
SSPS statistical package (version 19.0; SPSS Inc., Michigan, USA) was used for the statistical analysis of the data. General linear model of analysis of variance was used to establish the presence or absence of statistically significant (P ⩽ 0·05) differences in the analytical parameters of foods, milk and cheese samples considering feeding regimen, year, and geographical zone as main factors. In order to simplify the model, binary inter-factors interactions involving feeding regimen were only included. When the interaction term was significant (P ⩽ 0·05) the feeding regimen factor was F-tested against the interaction term. Principal Component Analysis (PCA) was performed on a matrix of the fatty acid parameters of the milk samples using the Kaiser criterion (eigenvalue >1) to select the principal components. Factors were rotated using the Varimax method for ease of interpretation.
Results and Discussion
Both milk yield and gross composition were very similar in both years and in both geographical zones for each period, although the percent fat, protein and DM increased significantly as lactation progressed (Table 2).
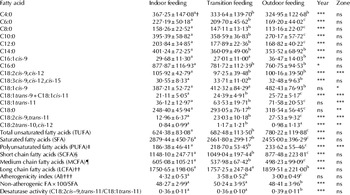
Average concentrations (μmol/g fat) in milk of individual FA and FA groups for both years, with different feeding regimens at different times of the year, are summarised in Table 3. The large sds observed for all FA and FA groups are mostly due to the fact that each datum is the average of 10 flocks under commercial conditions, from different geographical locations, with varied management systems although grazing is the common denominator of all flocks, and during two consecutive years. Although the factor ‘year’ was significant for most FA, several exceptions are worth mentioning: the concentrations of C18:1cis-9, C18:1trans-11 and C18:0 acids did not change significantly from one year to the next, whereas that of C4:0 acid almost doubled in the 2nd year with respect to the values obtained during the 1st year. Because the origin of C4:0 acid is varied, the difference in concentrations could be influenced by multiple factors, other than mammary gland synthesis and/or diet (Ferlay et al. 2008). The sum of the concentrations of unsaturated FA increased 15% during the 2nd year and the sum of C18:2cis-9,cis12 and C18:3cis-9,cis-12,cis-15 acids was double in the milk of the second year (180·66 ± 19·12 μmol/g fat, as compared with 86·61 ± 17·24 μmol/g fat). This was most likely due to the higher rainfall during the 2nd year (Table 1) which resulted in the availability of more abundant and fresher pasture and an average of 0·8 h/d longer grazing time.
Fatty acid concentration (μmol/g fat) in milk from commercial flocks. Data are the means±sd of data of two consecutive years

† a,b,c Different superscripts in the same row indicate statistically significant differences (P ⩽ 0·05)
‡ Sum of C18:2cis-9,cis-12, C18:3cis-9,cis-12,cis-15, and hydrogenation products
§ Sum of C4:0, C6:0, C8:0 and C10:0
¶ Sum of C12:0 and C14:0
†† Sum of fatty acids ⩾C16
††† (C12:0 + (4 × C14:0) + C16:0)/TUFA
*P ⩽ 0·05; **P ⩽ 0·01; ***P ⩽ 0·001
ns: not significant (P > 0·05)
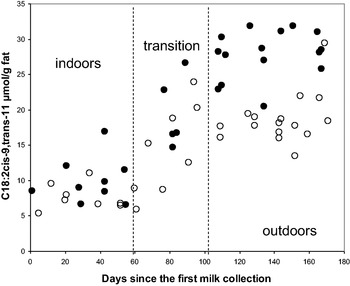
The different amount of rainfall between the two geographical zones did affect flock feeding management, especially to decide the moment when sheep were taken out to pasture and the amount of hours animals were allowed to graze. Thus, the concentrations of C18:2cis-9,cis12, C18:1trans-11 and C18:2cis-9,trans-11 acids were 18, 26 and 22% higher in the wet zone (zone 2), respectively, than in the dry zone (zone 1). As depicted in Fig. 1, the concentration of the C18:2cis-9,trans-11 isomer was significantly higher during the outdoor period in the wet zone than in the dry zone during the same year.
Concentration of the C18:2cis-9,trans-11 isomer (μmol/g fat) in milk samples from farms in the wet zone (zone 2; solid symbols) or from farms in the dry zone (zone 1; empty symbols) during the 1st year

The average amount of almost all FA changed significantly as lactation progressed and feeding regimens changed from indoors to outdoors (Table 3). The interaction between feeding regimen and year or geographical zone was statistically significant for a very few FA (C8:0, C18:1trans-11 and C18:2cis-9,cis-12 acids), and the feeding regimen factor was, in all cases, statistically significant against the interaction term. Both mono- and polyunsaturated fatty acids increased about 25% when the sheep were taken outdoors to graze, whereas other investigators reported increases of 5–6% in total unsaturated FA (TUFA), both in experimental flocks (Atti et al. Reference Atti, Rouissi and Othmane2006; Biondi et al. Reference Biondi, Valvo, Di Gloria, Tenghi, Galofaro and Priolo2008; Ostrovský et al. Reference Ostrovský, Pavlíková, Blaško, Górová, Kubinec, Margetín and Soják2009) and in commercial flocks (Tsiplakou et al. Reference Tsiplakou, Mountzouris and Zervas2006). The average concentration of C18:1trans-11 acid practically doubled, and that of C18:2cis-9,trans-11 isomer increased 2·6-fold when sheep were allowed to graze outdoors, reaching concentrations of 71·58 ± 20·53 and 27·53 ± 9·32 μmol/g fat, respectively (Table 3). Reported increases in the concentration of the C18:2cis-9,trans-11 isomer during the transition from indoor feeding to outdoor grazing are variable, from 18% in organic compared with non-organic flocks (Tsiplakou et al. Reference Tsiplakou, Kotrotsios, Hadjigeorgiou and Zervas2010), to 2·5-fold in commercial flocks (Tsiplakou et al. Reference Tsiplakou, Mountzouris and Zervas2006), or 3·2-fold in experimental flocks (Ostrovský et al. Reference Ostrovský, Pavlíková, Blaško, Górová, Kubinec, Margetín and Soják2009), probably due to differences in the type of flock, and/or pasture composition.
The amount of the C18:2cis-9,trans-11 isomer increased during the transition period to part-time grazing, remaining constant after approximately one month of grazing (Fig. 1). According to Biondi et al. (Reference Biondi, Valvo, Di Gloria, Tenghi, Galofaro and Priolo2008), the stabilisation of the concentration of the C18:2cis-9,trans-11 isomer can be due to the gradual adaptation of the rumen microbiota to the new diet. C18:1trans-11 acid showed the same behaviour as that of the C18:2cis-9,trans-11 isomer depicted in Fig. 1 (data not shown). The capacity to desaturate C18:1trans-11 acid to C18:2cis-9,trans-11 acid (desaturase activity) also increased with the lactation period and was observed in dairy sheep by De la Fuente et al. (Reference De la Fuente, Barbosa, Carriedo, Gonzalo, Arenas, Fresno and San Primitivo2009) and in dairy cattle by Kelsey et al. (Reference Kelsey, Corl, Collier and Bauman2003) and Lock & Garnsworthy (Reference Lock and Garnsworthy2003). The biohydrogenation process in the rumen can also give C18:0 acid as end product. This could account, in part, for the C18:0 increase observed throughout lactation (Table 3).
The amounts of short-chain FA (SCFA) and medium-chain FA (MCFA) dropped progressively as the lactation period advanced whereas those of long-chain FA (LCFA) and TUFA increased (Table 3). A higher proportion of LCFA in milk might reflect a higher mobilisation of FA from adipose tissue because of the negative energy balance (Chilliard et al. 2003) at the end of the lactation period. The higher amount of LCFA can also inhibit the de novo FA synthesis in the mammary gland (Couvreur et al. Reference Couvreur, Hurtaud, Lopez, Delaby and Peyraud2006). As a consequence, the concentration of C18:0 acid increased but that of C16:0 acid and SCFA and MCFA decreased (Table 3).
Among all saturated fatty acids (SFA), those with 12 to 16 fatty acids are considered to raise serum cholesterol levels, but not the shorter-chain FA or C18:0 acid (Parodi, Reference Parodi2009). Thus, those SFA with 4, 6, 8, 10 and 18 carbons, which comprise 50% of the SFA in milk samples, are non-atherogenic. The atherogenicity index (AI) is a ratio of the weighted sum of the atherogenic FA to the total unsaturated fatty acids, and it is calculated as (C12:0 + (4 × C14:0) + C16:0)/TUFA (Ulbricht & Southgate, Reference Ulbricht and Southgate1991). Considering all the changes in the concentrations of the individual fatty acids as lactation progressed, the AI of the milk produced during the outdoor period was significantly lower than that of the transition and indoor periods (Table 3).
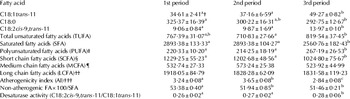
In studies like the one herein, it is often difficult to separate the effect of physiological changes in lactating animals from the effect of feeding regimen which also changes during lactation. In an attempt to separate these effects, and because no commercial latxa flocks are kept indoors during the entire lactation, an experimental latxa flock was used during the second year as ‘physiological reference’ (see Materials and Methods). When the general tendencies in the concentrations of various FA were compared between the commercial and reference flocks (Table 4), the following observations are worth mentioning. In the milk of the reference flock, the amounts of both C18:1trans-11 and C18:2cis-9,trans-11 acids increased as lactation progressed (Table 4), although the concentrations of these acids during the 3rd period were 1·45-fold and 1·97-fold (respectively) lower than those in the milk of the commercial flocks during the corresponding outdoor period (Table 3). In contrast, Tsiplakou et al. (Reference Tsiplakou, Mountzouris and Zervas2006) in the indoor-kept control flock observed a small increase in the concentration of the C18:2cis-9,trans-11 isomer at approximately mid-lactation, with values returning to the initial one by the end of lactation. The concentration of C18:0 acid in the reference milk (Table 4) decreased instead of increasing as observed in the milk of the commercial flocks. The concentration of SCFA and MCFA did not change in the reference milk whereas both of them decreased significantly in the milk of commercial flocks. The AI of the milk of the reference flock changed little during lactation, whereas it did decrease significantly in the milks of the commercial flocks with outdoor feeding (Tables 3 and 4). These observations clearly underline the importance of fresh pasture intake to increase the concentrations of fatty acids with positive physiological effects.
Concentration (μmol/g fat) of selected FA in milk from the control flock in the 2nd year. Data are the means±sd

† a,b,cDifferent superscripts in the same row indicate statistically significant differences (P ⩽ 0·05)
‡ Sum of C18:2cis-9,cis-12, C18:3cis-9,cis-12,cis-15, and hydrogenation products
§ Sum of C4:0, C6:0, C8:0 and C10:0
¶ Sum of C12:0 and C14:0
†† Sum of fatty acids ⩾C16
††† (C12:0 + (4 × C14:0) + C16:0)/TUFA
To the best of our knowledge there are no reports in the literature on the water-soluble antioxidant capacity of milk from commercial flocks or herds. The capacity of milk to scavenge the water-soluble radical cation ABTS·+ compared with that of the model antioxidant Trolox® (TEAC) was studied during the 2nd year in milk samples of commercial flocks and those of the reference flock (Table 5). During the outdoor feeding period, TEAC values for skimmed milk and whey samples were significantly higher than those of samples taken during the indoor feeding period, both for commercial flocks and the indoor kept reference flock. TEAC values for skimmed milk or whey in each of the feeding periods were essentially the same for the commercial and the reference flocks, indicating that pasture intake did not appear to contribute water-soluble compounds with TEAC antioxidant activity. No differences were observed among milk samples from the two geographical zones. The low, but measurable, TEAC value of whey samples is most likely due to the presence of other soluble whey proteins and low molecular weight compounds. These results indicate that the majority of the water-soluble antioxidant capacity of milk is due to the caseins and other low-molecular weight compounds (Clausen et al. Reference Clausen, Skibsted and Stagsted2009; Zulueta et al. Reference Zulueta, Maurizi, Frigola, Esteve, Coli and Burini2009; Bianchi et al. Reference Bianchi, Nunzi, Pauselli, Moscati, Cestola, Duranti and Casoli2011).
Trolox equivalent antioxidant capacity (TEAC) values (μmol Trolox® equivalents/ml milk) of whole milk, skimmed milk and whey. Data are the mean±sd. Milk samples correspond to the 2nd year

† a,bDifferent superscripts in the same row indicate statistically significant differences (P ⩽ 0·05)
ns: not significant (P > 0·05)
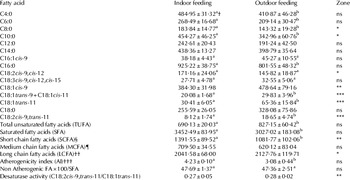
In the second year of sampling, cheeses ripened for 180 d were also collected from each farmhouse. These commercial cheeses were made with the same milks collected at the beginning of the lactation period (indoor cheeses) and in late spring (outdoor cheeses). The concentration of the individual FA in cheeses (Table 6) was quite similar to those of the milks from which they were made (Table 3), both in the indoor and outdoor periods. Thus, the ratio of outdoor/indoor concentrations of the C18:2cis-9,trans-11 isomer, TUFA, C18:1trans-11 acid and the AI for milk samples were rather similar to those ratios found in cheese samples. Cheeses made with milk from grazing animals (outdoor feeding period) had significantly higher concentrations of TUFA, C18:2cis-9,trans-11 isomer, and C18:1trans-11 acid than cheeses made with milk from indoor-fed animals. Consequently, the AI of outdoor cheeses was significantly lower than that of cheeses from the indoor feeding period (Table 6). As observed in milk samples, non-atherogenic FA in cheese samples comprised 47% of all SFA, regardless of the feeding regimen. Most FA of cheese samples showed non-significant interactions between feeding regimen and geographical zone, and when the interaction term was significant the feeding regimen was statistically significant against the interaction term.
Fatty acid concentration (μmol/g fat) in cheeses from commercial flocks sampled during the 2nd year. Data are the means±sd

† a,bDifferent superscripts in the same row indicate statistically significant differences (P ⩽ 0·05)
§ Sum of C4:0, C6:0, C8:0 and C10:0
¶ Sum of C12:0 and C14:0
†† Sum of fatty acids ⩾C16
††† (C12:0 + (4 × C14:0) + C16:0)/TUFA
*P ⩽ 0·05; **P ⩽ 0·01; ***P ⩽ 0·001
ns: not significant (P > 0·05)
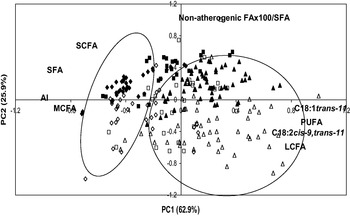
Both the year and the different feeding regimen had a significant influence on the FA amounts in milk samples from commercial flocks (Table 3). In order to assess simultaneously the effects of these factors, a principal component analysis (PCA) was applied to the parameters of the main FA groups as percent of the total FA (SCFA, MCFA, LCFA, SFA, PUFA, non-atherogenic FA × 100/SFA), AI and the content of C18:1trans-11 and C18:2cis-9,trans-11 acids of the commercial milk samples of both years and periods of different feeding regimens. Figure 2 depicts variable loadings and milk sample scores in the two-dimensional coordinate system defined by the two principal components PC1 and PC2 which accounted for 88·8% of the total variance. The main principal component, PC1 (‘feeding regimen factor’), allowed milk samples to be separated according to the different feeding management regimens, milk samples from the outdoor and transition feeding being mostly separated from those of the indoor feeding. Annual variability mostly due to climatic factors was also observed along PC2 (‘annual variability factor’). However, milk samples from the two different geographical zones were not distributed in separated groups (data not shown). SFA, MCFA, and SCFA and AI showed high negative loadings with PC1, whereas C18:1trans-11 acid, C18:2cis-9,trans-11 isomer and PUFA showed high positive loadings. In contrast, non-atherogenic FA/SFA and SCFA showed high positive loadings with PC2. Taking all these results into consideration, we conclude that the nutritional quality of the milk from these commercial flocks is reproducible interannually and it depends on the different indoor and outdoor feeding regimens.
Principal component analysis showing variable loadings and milk sample distribution in the two-dimensional coordinate system defined by PC1 and PC2. △, ▲: outoor feeding period; □, ■: transition feeding period; ◇, ◆: indoor feeding period. Empty symbols: 1st year samples; solid symbols: 2nd year samples. AI: atherogenicity index; LCFA: long-chain FA; MCFA: medium-chain FA; SCFA: short chain FA; SFA: saturated FA

Conclusions
The FA profile of the milks of the 10 different commercial flocks studied herein evolved in a similar manner throughout the lactation period during both years, as the feeding regime changed from indoor feeding to outdoor grazing. Although individual flock management was not identical and climate conditions were also different, milks of the outdoor and transition feeding regimens were clearly different from those of the indoor feeding regimen, indicating that the milk FA profile is reproducible under commercial milk production conditions. The concentrations of C18:2cis-9,trans-11 isomer and C18:1trans-11 acid in the outdoor feeding were double those of the indoor feeding, both in milk and in the commercial cheeses. At any moment, about 50% of the SFA were non-atherogenic, either in milk or in cheese. The AI of the milks and cheeses from the outdoor and transition feeding were significantly lower than those of the indoor feeding period due to the significant increase in TUFA. The principal component ‘feeding regimen factor’ separated outdoor and transition milks from indoor milks in both years of the study.
The authors thank Dr L.M. Oregui for his contribution during the design and planning stages of this study. PN Fernández-Caballero acknowledges a predoctoral fellowship from the Department of Education, Universities and Research of the Basque Country. Financial support was provided by the Instituto Nacional de Investigación y Tecnología Agraria y Alimentaria (INIA; RTA2006-00100-C02-01 and RTA2006-00100-C02-02), the Department of Education, Universities and Research of the Basque Government (IT-389-10), and the UNESCO Cathedra (UNESCO 09/07).