I. INTRODUCTION
Advances in materials science and technology have also had significant impact in the medical field, such that a variety of metallic materials found utility as implant materials owing to their biocompatibility, formability, and high strength. Reference Duerig, Pelton and Stöckel1–Reference Imam, Yilmaz, Özçelik and McGlumphy4 However, despite the utility of metallic materials of high strength in many implants, cases of implant failure due to metal fatigue and fracture have been reported. Reference Imam, Yilmaz, Özçelik and McGlumphy4–Reference Li and Chou6 In such an incident, not only the treatment is unsuccessful, but also infection and other severe consequences may prevail, making an urgent surgical intervention inevitable. Since the severity of all the aforementioned consequences depends on how the fracture of the implant takes place, understanding the fracture – and in particular, impact – behavior of implant materials emerges as an important aspect of implant design, especially when designing implants using new materials.
Niobium–zirconium (NbZr) alloys constitute a good example to this case, such that they have recently been forwarded as candidate materials to be utilized in implants. Reference Hallab, Anderson, Caicedo and Jacobs7–Reference Kim, Park, Lee, Jeong and Kim9 Both constituents of these alloys have been separately proven to be biocompatible, and they have received considerable attention from researchers working in the biomaterials field due to the superior corrosion resistance they exhibit. Reference Hallab, Anderson, Caicedo and Jacobs7–Reference Kim, Park, Lee, Jeong and Kim9 Recent works on this material have demonstrated that an excellent combination of mechanical properties, high strength, and good fatigue resistance can be obtained in NbZr alloys upon introduction of an ultrafine-grained (UFG) microstructure. Reference Rubitschek, Niendorf, Karaman and Maier10–Reference Toker, Rubitschek, Niendorf, Canadinc and Maier13
For implant materials, in addition to resistance against corrosion induced by the chemically aggressive human body environment, mechanical performance related parameters, such as high strength, improved fatigue resistance, and fracture toughness, are also important, especially considering loading conditions that can sometimes become intense. Reference Cehreli, Sahin and Akca14–Reference Moazen, Jones, Jin, Wilcox and Tsiridis17 For instance, sudden impact loads prompted by falling, jumping, or other causes may lead to serious injuries and bone fractures in various body parts, such as hip or knee joints, Reference Kannus, Parkkar and Poutala18–Reference Pinilla, Boardman, Bouxsein, Myers and Hayes22 or dental implants. Reference Imam, Yilmaz, Özçelik and McGlumphy4–Reference Li and Chou6 Thus, understanding the impact response is crucial for a potential implant material for guaranteeing the safety and satisfactory mechanical performance of the implant during service.
The impact performance of a material is mainly dictated by its microstructural parameters, such as grain boundaries, grain size, precipitates and delaminations, and its ductile-to-brittle transition temperature (DBTT). Reference Morris23–Reference Kimura, Inoue, Yin and Tsuzaki25 Another important parameter influencing the impact response is the texture of the material, and in particular, the distribution of grain boundary misorientation angles (GBMAs), which becomes of significant importance in UFG materials: High-angle grain boundaries hinder or slow down crack propagation by constituting even more effective barriers against dislocation motion, leading to improved fracture toughness and lower DBTT values. Reference Song, Ponge and Raabe24–Reference Niendorf, Canadinc, Maier, Karaman and Sutter28 In addition to significantly influencing the crack propagation behavior under impact loading, texture of an alloy also defines its degree of anisotropy, which dictates the relative slip activity in each grain, Reference Viatkina, Brekelmans and Geers29 and thereby the overall deformation response of a material. Reference Beyerlein and Tóth30,Reference Bache and Evans31 Anisotropy attains even higher priority in the design of implants to replace bone tissue as the bone itself possesses a high degree of anisotropy. Reference Martin, Burr and Sharkey32,Reference Rho, Kuhn-Spearing and Zioupos33 Thus, to mimic bone tissue as closely as possible, and thereby ensure a mechanical behavior similar to that of the bone under all possible loading conditions, and especially impact loading, Reference Kannus, Parkkar and Poutala18–Reference Pinilla, Boardman, Bouxsein, Myers and Hayes22 an implant material with a similar anisotropy to that of the bone should be targeted.
The current study was motivated by the need to incorporate the anisotropy effects into the design process of implants, such that the undesired mechanical failure of implants can be prevented, or at least, in the case of failure, the severity of consequences can be minimized by proper design. Specifically, the current study forwards a combined experimental and numerical approach that can be utilized to predict the impact response of an implant in a realistic manner. For this purpose, uniaxial tensile deformation and impact responses of both coarse-grained (CG) and UFG NbZr were experimentally monitored to emphasize the role of anisotropy further by comparing the CG and UFG microstructures. Finite element (FE) simulations of the impact experiments were carried out, where the roles of both anisotropy and geometry-based distribution of stresses and strains upon loading were successfully taken into account by incorporating the proper multiaxial material flow rule obtained from crystal plasticity simulations into the FE analysis. The current findings demonstrate that proper coupling of crystal plasticity and FE analysis is of utmost importance for the sake of reliable predictions of the impact response. Overall, the approach presented herein constitutes an important guideline for the design process of dental and orthopedic implants.
II. EXPERIMENTAL PROCEDURES
The material investigated in this study is a NbZr alloy with a chemical composition of 2.33 wt% zirconium (Zr), 0.29 wt% tantalum (Ta), 76 ppm H2, 44 ppm O2, 63 ppm C, 5 ppm Fe, and balance niobium (Nb). The NbZr alloy was originally obtained in the form of a 30-mm thick hot-rolled plate with a CG microstructure, and then processed by equal-channel angular pressing (ECAP) along route 8E (detailed information about the ECAP procedure can be found in Ref. Reference Beyerlein and Tóth30 and Reference Bache and Evans31) to obtain an UFG microstructure. Reference Rubitschek, Niendorf, Karaman and Maier10–Reference Niendorf, Maier, Canadinc, Yapici and Karaman12 Dog-bone-shaped miniature specimens with a nominal gauge section of 8 mm × 3 mm × 1.5 mm were extracted from both the CG and UFG materials by electrodischarge machining, where attention was paid to carefully extract the samples from the uniformly strained volumes of the extruded billets in the case of UFG NbZr. Reference Rubitschek, Niendorf, Karaman and Maier10–Reference Niendorf, Maier, Canadinc, Yapici and Karaman12,Reference Beyerlein and Tóth30,Reference Bache and Evans31 Room temperature uniaxial tensile experiments were carried out under monotonic loading on a servo-hydraulic loading frame, and a medium strain rate of 5 × 10⁻⁴ s−1 was used to avoid any rate effect. The impact samples were extracted from both the CG and UFG alloys with dimensions of 2.8 mm × 25 mm × 4 mm, featuring a 60° notch with a radius of 0.1 mm and a depth of 1 mm. Reference Martin, Burr and Sharkey32 The specimens were mechanically polished down to a 4000 grit size to minimize the detrimental effects of machined surfaces on the impact response. The impact experiments were conducted at five different temperatures: 50 °C, 0 °C, −50 °C, −100 °C, and −150 °C. The specimens were subjected to deformation with an impact energy of 50 J and at a velocity of 3.8 m/s, where 8000 data points were collected during each experiment with a data acquisition frequency of 2 MHz. A scanning electron microscope (SEM) operated at a nominal voltage of 20 kV was used to observe the fracture surfaces of both CG and UFG NbZr upon impact.
III. RESULTS
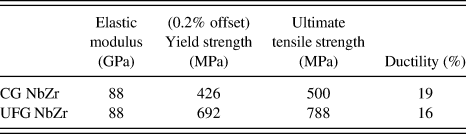
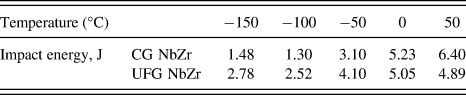
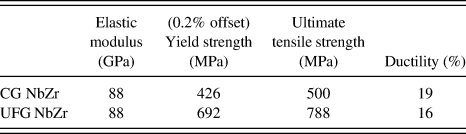
The fundamental mechanical characteristics corresponding to the room temperature deformation responses of the CG and UFG NbZr samples are presented in Table I (the data were recompiled from Ref. Reference Niendorf, Maier, Canadinc, Yapici and Karaman12. The readers are referred to Ref. Reference Niendorf, Maier, Canadinc, Yapici and Karaman12 for the graphical representation). Accordingly, the current UFG NbZr alloy exhibits almost a 2-fold increase in strength as compared with its CG counterpart. This agrees well with the general trend in other UFG materials obtained through ECAP processing, which leads to intense grain refinement facilitated by severe plastic deformation during processing. Reference Rubitschek, Niendorf, Karaman and Maier10–Reference Niendorf, Maier, Canadinc, Yapici and Karaman12 Moreover, despite this significant increase in strength, the ductility remains nearly the same, which provides a desirable strength–ductility combination for many applications. The impact experiments, on the other hand, revealed that both the CG and UFG samples underwent a ductile-to-brittle transition as the temperature decreases from 50 °C to −100 °C, and exhibited a typical impact behavior Reference Toker, Rubitschek, Niendorf, Canadinc and Maier13 (Table II; the data were recompiled from Ref. Reference Toker, Rubitschek, Niendorf, Canadinc and Maier13. The readers are referred to Ref. Reference Toker, Rubitschek, Niendorf, Canadinc and Maier13 for the graphical representation). In the case of UFG NbZr, the transition from the ductile-to-brittle region is more obvious, and higher energy absorption is noted (Table II), implying that this UFG variant is more susceptible to temperature changes and exhibits ductile failure.
Uniaxial tensile deformation response of CG and UFG NbZr alloys at room temperature. The data were recompiled from Ref. Reference Niendorf, Maier, Canadinc, Yapici and Karaman12.
Impact energy – temperature trends for CG and UFG NbZr. The data were recompiled from Ref. Reference Toker, Rubitschek, Niendorf, Canadinc and Maier13.
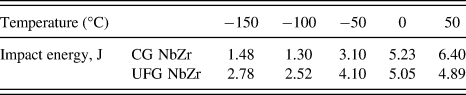
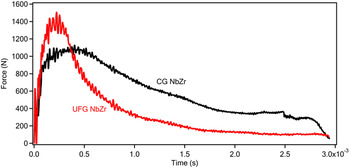
The current work focuses on the impact response of the NbZr alloys at 50 °C, since this temperature best represents the storage, utility (human body) and sterilization temperatures of implants all at once. The corresponding force–time data recorded throughout the impact experiment at 50 °C are provided in Fig. 1. Accordingly, more energy is absorbed by the UFG NbZr until crack propagation starts, which stems from the improved strength as compared with the CG variant (Table I). Nevertheless, despite the difference being relatively small, the CG NbZr exhibits better ductility (Table I), and absorbs more energy throughout the whole impact process as also evidenced by the data presented in Fig. 1.
Representative impact response of CG and UFG NbZr alloys at 50 °C.

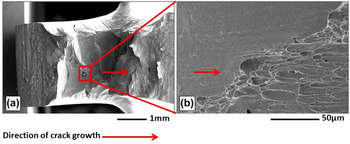
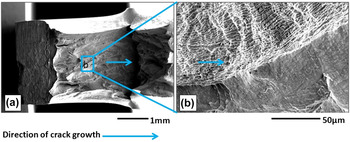
The SEM results have demonstrated that larger plastic strains are attained prior to failure in the UFG NbZr, further promoting slip activity, and thus, a more distorted fracture surface is present upon impact loading (Figs. 2 and 3). Furthermore, the elongated grains imposed by severe plastic deformation are aligned with the initial crack growth direction, and the cracks propagate along the grain boundaries for both materials Reference Toker, Rubitschek, Niendorf, Canadinc and Maier13 (Figs. 2 and 3).
(a) SEM image of the fracture surface of the CG NbZr alloy upon impact testing at 50 °C, and (b) higher magnification SEM image indicating intergranular fracture.

(a) SEM image of the fracture surface of the UFG NbZr alloy upon impact testing at 50 °C, and (b) higher magnification SEM image indicating intergranular fracture.

IV. MODELING THE IMPACT RESPONSE OF NbZr
The current material is an ideal candidate for dental and orthopedic implant applications based on its corrosion resistance and excellent fundamental mechanical properties, especially with an UFG microstructure. Given its potential utility and the importance of impact response for these conditions of use, the current modeling effort focuses on the FE modeling of the impact response. A two-step approach was followed, such that in the first step, the FE simulations of experimental impact response of both CG and UFG NbZr were carried out within the limits of the ANSYS® 14.5 commercial software (ANSYS, Inc., Canonsburg, PA) and LS-DYNA® solver (Livermore Software Technology Corporation, Livermore, CA). In the next step, the impact experiments of CG and UFG NbZr were simulated by incorporating the experimentally evidenced distinct role of microstructure into the FE analysis through a crystal plasticity algorithm. This two-step approach is presented in detail in the following subsections.
A. FE simulations of experimental impact response
Application of forces to objects within a very short period of time constitutes the major difficulty of FE simulations of impact response. Reference Kormi, Webb and Johnson34,Reference Raykhere, Kumar, Singh and Parameswaran35 Specifically, accurate prediction of very large deformations taking place within very short time periods is much more difficult and complicated in comparison to computing similar deformations over longer time periods. This stems from the fact that the available time period is insufficient for the stabilization of the computed displacements in the case of impact loading, such that the material's behavior significantly deviates under this dynamic type of loading from that under normal conditions. Reference Goldsmith36 For instance, it is well known that, despite being a ductile material at medium strain rates, steel can exhibit a quite brittle deformation response at high rates of deformation. Thus, it is expected that impact loading leads to nonlinearities within the material, which are mostly associated with the boundary conditions, contact surfaces, and friction, potentially resulting in various convergence problems in the FE simulations. Reference Feng, Vallee, Fortune and Peyraut37
FE simulations of the impact behavior were carried out utilizing the ANSYS® 14.5 commercial software. The FE analysis was based on an explicit dynamics system, where the LS-DYNA® solver was used in computations for the sake of a reliable nonlinear dynamic analysis. The Lagrangian formulation was utilized to describe the nonlinearity and multilinear isotropic hardening was chosen to represent the plastic flow. A fine “MultiZone” mesh was constructed with 8667 nodes and 6760 quadrilateral elements, where the geometry is automatically decomposed into a hex mesh, increasing both the accuracy and computational efficiency of the simulations. The notch region was meshed with an element size of 0.1 mm, and the orthogonal quality of the mesh was calculated as 0.98 out of 1.0. All contact regions of the impact sample were assumed to be frictional, and the corresponding static and dynamic friction coefficients were set to 0.2 and 0.09, respectively. Reference Feng, Vallee, Fortune and Peyraut37 As for the boundary conditions, a nodal displacement was imposed on the top notch surface and fixed supports were placed at the right/left sides and on the bottom surface. All dimensions and constraints were designated in the Cartesian coordinate system.
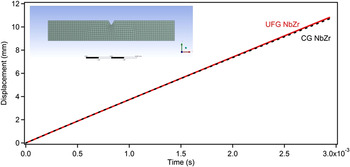
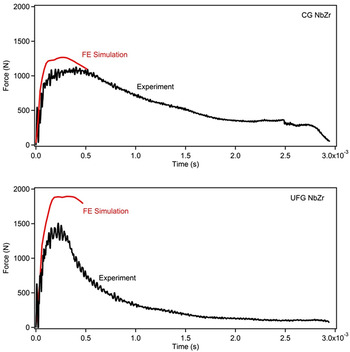
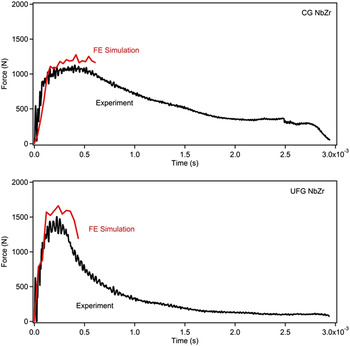
The experimentally obtained uniaxial tensile deformation Reference Niendorf, Maier, Canadinc, Yapici and Karaman12 (Table I) and displacement–time data (Fig. 4) were incorporated into the FE simulations of the impact response of both CG and UFG NbZr to define the flow rule and impact deformation, respectively. Among the FE simulation outputs, the force–time data for both CG and UFG NbZr were compared with the corresponding experimental data (Fig. 5). It should be noted that the FE simulations were carried out only until the fracture point of the specimens. Since the displacement–time read-out data are associated with the motion of the impact hammer, the specimen was considered not to displace following fracture. To account for the further displacement of the sample upon termination of contact with the hammer, a proper fracture criterion has to be specified, which is beyond the scope of the current article and left for future work.
Displacement versus time data utilized as input in the FE simulations of impact experiments of CG and UFG NbZr. The inset shows the mesh utilized in the FE simulations.

Comparison of FE simulation results and experimental impact response for CG and UFG NbZr in terms of force versus time data.

The comparison of experimental and simulated impact responses expressed in terms of force–time data (Fig. 5) indicates a noticeable deviation of the FE results from the experiments for both CG and UFG NbZr. This difference is more significant in the case of UFG NbZr, implying that the provided hardening response based on the experimental uniaxial tensile deformation data Reference Niendorf, Maier, Canadinc, Yapici and Karaman12 (Table I) was not sufficiently representative of the material's mechanical behavior under impact loading. Further simulations featuring a finer mesh were carried out for questioning the numerical procedure, however; the results were not different, supporting the previous argument.
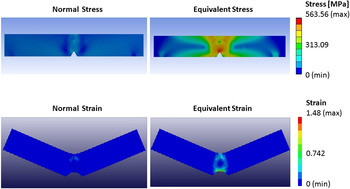
An examination of the stress and strain fields in a material-independent impact simulation gives further clues (Fig. 6). Specifically, a multiaxial stress–strain state is present in the critical region of the sample, and a comparison of normal and equivalent (von Mises) stress distributions reveals significant differences. This analysis questions the validity of choosing the uniaxial tensile deformation data as the input defining the material's mechanical behavior in the presence of significant multiaxial stress–strain distribution. Even though this approach might be appropriate for an isotropic material, it falls far from being realistic for a material which exhibits a significant degree of anisotropy, such as UFG NbZr. Reference Niendorf, Canadinc, Maier, Karaman and Yapici11–Reference Toker, Rubitschek, Niendorf, Canadinc and Maier13 Accordingly, a proper representation of microstructure and degree of anisotropy is crucial for reliable predictions of material behavior under complicated loading scenarios, such as impact loading. Thus, the current article presents a new approach to incorporate the role of microstructure into FE simulations: A viscoplastic self-consistent (VPSC) crystal plasticity model was implemented into FE simulations, such that equivalent stress–strain deformation responses of CG and UFG NbZr computed by the VPSC algorithm could be used as input data defining the plastic flow characteristics of both materials. The details of this approach are presented in the following section.
Demonstration of differences in normal and equivalent stress and strain fields upon a typical impact simulation.

B. VPSC modeling of the experimental deformation response
To account for the role of texture and the corresponding anisotropy in the current FE simulations, a VPSC crystal plasticity approach was adopted. Specifically, based on the aforementioned analysis of stress–strain distributions upon impact loading, the need for utilizing a flow rule based on equivalent stress–strain response rather than uniaxial behavior has become evident. While one way of establishing such a flow rule is experimental, a more efficient alternative can be based on crystal plasticity modeling. In particular, an accurate crystal plasticity model not only predicts the macroscopic deformation of a material, but more importantly, it also captures the deformation characteristics at the slip system level. Reference Canadinc, Biyikli, Niendorf and Maier38 Once correctly formulated and verified with experimental data, such a model should predict the deformation response under any type of loading. Reference Canadinc, Sehitoglu, Maier and Kurath39 This gives way to an alternative approach, such that the deformation of NbZr can be modeled at the microscopic level based on the experimentally obtained uniaxial deformation response, followed by the prediction of equivalent stress–strain response, which can be utilized as a proper flow rule for the impact simulations, as discussed before.
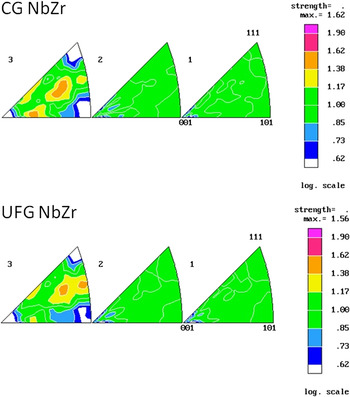
With this objective, the deformation responses of both the CG and UFG NbZr were modeled utilizing a VPSC approach, based on initial textures (Fig. 7) and experimentally obtained deformation response under uniaxial tensile loading. The VPSC algorithm used in the current study considers the deformation within the plastic zone only, such that plastic deformation occurs when one or more slip or twinning systems become active. For a system (s), the corresponding resolved shear stress (
 ${\rm{\tau }}_{{\rm{RSS}}}^{\rm{s}}$
) driving plastic deformation is defined in terms of the vector forms of the Schmid tensor (
 $m_i^{\rm{s}}$
) and the applied stress (σ
i
) as:
 $${\rm{\tau }}_{{\rm{RSS}}}^{\rm{s}} = m_i^{\rm{s}}{{\rm{\sigma }}_i\quad,}$$
Initial textures of the CG and UFG NbZr demonstrating the corresponding degrees of anisotropy based on (equal-area projection) inverse pole figures. 1, 2, and 3 correspond to normal, transverse, and extrusion directions, respectively. Reference Niendorf, Canadinc, Maier, Karaman and Yapici11

The nonlinear shear strain rate in the system s can be described as a function of
 ${\rm{\tau }}_{{\rm{RSS}}}^{\rm{s}}$
:
 $${{{\dot \gamma }}^{\rm{s}}} = {{{\dot \gamma }}_0}{\left( {{{{\rm{\tau }}_{{\rm{RSS}}}^{\rm{s}}} \over {{\rm{\tau }}_0^{\rm{s}}}}} \right)^n} = {{{\dot \gamma }}_0}{\left( {{{m_i^{\rm{s}}{{\rm{\sigma }}_i}} \over {{\rm{\tau }}_0^{\rm{s}}}}} \right)^n\quad,}$$
where
 ${{{\dot \gamma }}_0}$
is a reference rate,
 ${\rm{\tau }}_0^{\rm{s}}$
is the threshold stress corresponding to this reference rate, and n is the inverse of the rate sensitivity index. The superposition of the contributions from all active systems gives the total strain rate in a crystal, which can be presented in its pseudolinearized form as in the following expression
Reference Lebensohn and Tomé40
:
 $${{{\hskip-3pt\dot \varepsilon }}_i} = \left[ {{{{{\dot \gamma }}}_0}\mathop\sum\limits_1^{\rm{s}} {{{m_i^{\rm{s}}m_j^{\rm{s}}} \over {{\rm{\tau }}_0^{\rm{s}}}}{{\left( {{{m_k^{\rm{s}}{{\rm{\sigma }}_k}} \over {{\rm{\tau }}_0^{\rm{s}}}}} \right)}^{n - 1}}} } \right]{{\rm{\sigma }}_j} = M_{ij}^{{\rm{c}}(\sec )}\left( {{{\tilde \sigma }}} \right){{\rm{\sigma }}_j\quad,}$$
where
 $M_{ij}^{{\rm{c}}(\sec )}$
is the secant viscoplastic compliance of the crystal which gives the instantaneous relation between stress and strain rate. At the polycrystal level, this relationship assumes the following form
Reference Lebensohn and Tomé40
:
 $${\dot E_i} = M_{ij}^{(\sec )}\left( {\tilde \Sigma } \right){\Sigma _j} + {\dot \Sigma ^0\quad,}$$
where
 ${\dot E_i}$
and Σ represent the polycrystal strain rate and applied stress, respectively.
In a continuum that consists of a matrix and inclusions, the deviations in strain rate and stress between the inclusion and their overall magnitudes are defined as
 $${{{\dot \tilde \varepsilon }}_k} = {{{\dot \varepsilon }}_k} - {\dot E_k\quad,}$$
 $${{{\tilde \sigma }}_j} = {{\rm{\sigma }}_j} - {\Sigma _j\quad,}$$
where
 ${{{\dot \varepsilon }}_k}$
and
 ${{\rm{\sigma }}_j}$
stand for the local (single crystal or grain level) strain rate and stress. Utilizing Eshelby's inhomogeneous inclusion formulation one can solve the stress equilibrium equation to derive
Reference Kocks, Tomé and Wenk41
:
 $${{\tilde \dot \varepsilon }} = - {\tilde M:{\rm\,\,\vskip0.5pt\tilde \vskip-8pt\hskip-3.7pt\sigma \quad,}}$$
The interaction tensor
 $\tilde M$
is defined as
 $$\tilde M = n\prime {(I - S)^{ - 1}}:S:{M^{(\sec )\quad,}}$$
where
 ${M^{(\sec )}}$
is the secant compliance tensor for the polycrystal aggregate and S is the viscoplastic Eshelby tensor.
Reference Kocks, Tomé and Wenk41
Substitution of Eqs. (3) and (4) into Eq. (7) yields the macroscopic secant compliance,
 ${M^{(\sec )}}$
, and the macroscopic strain rate is evaluated by taking the weighted average of crystal strain rates over all the grains as in Eq. (9):
 $${M^{(\sec )}} = \vskip2pt\left\langle{{M^{{\rm{c}}(\sec )}}:{{\left( {{M^{{\rm{c}}(\sec )}} + \tilde M} \right)}^{ - 1}}:\left( {{M^{(\sec )}} + \tilde M} \right)} \right\vskip2pt\rangle\quad,$$
Iterative solution of Eqs. (3), (7), and (9) gives the stress in each grain, the crystal's compliance tensor, and the polycrystal compliance consistent with the applied strain rate
 ${\dot E_i}$
. In this work, the term n in Eq. (2) was chosen as 20, which makes the formulation rate insensitive.
Reference Lebensohn and Tomé40
As for the interaction Eq. (8), an effective value of
 $n\prime = 1$
was used, which ensures a rigid interaction.
Reference Lebensohn and Tomé40
The rate of overall dislocation density can be expressed as:
 $${{\dot \rho }} = \mathop\sum\limits_n {\left\{ {{k_1}\sqrt {\rm{\rho }} - {k_2}{\rm{\rho }}} \right\}\left| {{{{{\dot \gamma }}}^n}} \right|\quad,}$$
where k 1 and k 2 are geometric constants that define the athermal (statistical) storage of the moving dislocations. Reference Kocks, Tomé and Wenk41 The flow stress τ is defined in the traditional Taylor hardening format as:
 $${\rm{\tau }} - {{\rm{\tau }}_0} = {\rm{\alpha \mu }}b\sqrt {\rm{\rho }}\quad,$$
where α is the dislocation interaction parameter and τ0 is a reference strength, which is related to deformation at the grain level. From Eq. (11), with τ0 constant, the rate of the flow stress is obtained by taking the time derivative as,
 $${{\dot \tau }} = {{{{\alpha \mu }}b{{\dot \rho }}} \over {2\sqrt {\rm{\rho }} }}\quad,$$
Substituting Eq. (10) into Eq. (12) results in:
 $${{\dot \tau }} = \mathop\sum\limits_n {\left\{ {{k_1}{{{\rm{\alpha \mu }}b} \over 2} - {k_2}{{{\rm{\alpha \mu }}b} \over 2}\sqrt {\rm{\rho }} } \right\}\left| {{{{{\dot \gamma }}}^n}} \right|}\quad,$$
From Eq. (11), the following identity is obtained for the square root of the density of dislocations:
 $$\sqrt {\rm{\rho }} = {{{\rm{\tau }} - {{\rm{\tau }}_0}} \over {{\rm{\alpha \mu }}b}}\quad,$$
Once Eq. (14) is substituted into Eq. (13), the rate of flow stress evolution is given by:
 $${{\dot \tau }} = \sum\limits_n {\left\{ {{k_1}{{{\rm{\alpha \mu }}b} \over 2} - {k_2}{{\left( {{\rm{\tau }} - {{\rm{\tau }}_0}} \right)} \over 2}} \right\}\left| {{{{{\dot \gamma }}}^n}} \right|}\quad,$$
One should note that the term
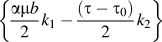 $\left\{ {{{{\rm{\alpha \mu }}b} \over 2}{k_1} - {{\left( {{\rm{\tau }} - {{\rm{\tau }}_0}} \right)} \over 2}{k_2}} \right\}$
in Eq. (15) is the linear Voce hardening term (Eq. (17)). Having noted this, Eq. (15) can also be expressed as
Reference Kocks, Tomé and Wenk41
:
 $${{\dot \tau }} = \mathop\sum\limits_n {\left\{ {{{\rm{\theta }}_0}\left( {{{{{\rm{\tau }}_{\rm{s}}} - {\rm{\tau }}} \over {{{\rm{\tau }}_{\rm{s}}} - {{\rm{\tau }}_0}}}} \right)} \right\}\left| {{{{{\dot \gamma }}}^n}} \right|}\quad,$$
where θ0 is the constant strain hardening rate, and τs represents the saturation stress in the absence of geometric effects, or the threshold stress. The hardening is defined by an extended Voce law, Reference Kocks, Tomé and Wenk41 which is characterized by the evolution of the threshold stress (τs) with accumulated shear strain (Г) in each grain of the form
 $${{\rm{\tau }}^{\rm{s}}} = {{\rm{\tau }}_0} + \left( {{{\rm{\tau }}_1} + {{\rm{\theta }}_1}\Gamma } \right)\left( {1 - \exp \left( { - {{{{\rm{\theta }}_0}\Gamma } \over {{{\rm{\tau }}_1}}}} \right)} \right)\quad,$$
where τ0 is the reference strength, and τ1, θ0, and θ1 are the parameters that define the hardening behavior. Reference Kocks, Tomé and Wenk41 The hardening law defined by Eq. (17) characterizes the onset of plasticity and the saturation of threshold stress at larger strains.
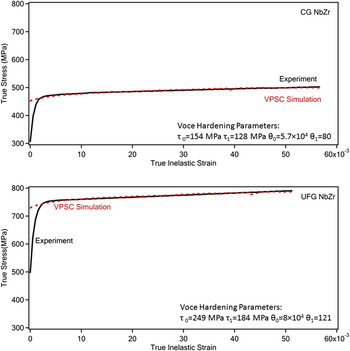
The current VPSC model followed the algorithm outlined in Eqs. (1)–(17) and solved for the stresses corresponding to the given strains throughout the deformation. The experimentally determined initial textures of both CG and UFG NbZr (Fig. 7) were utilized as input, and the macroscopic deformation responses were predicted as presented in Fig. 8. It is important to note that the experimental data utilized for modeling the microdeformation in CG and UFG NbZr are the same as in Table I, however; the true stress – true inelastic strain curves were taken as basis of comparison between simulations and experiments since VPSC models only the deformation in the plastic regime (as discussed earlier). Furthermore, for both materials only a 5–6% plastic strain span was considered for modeling the deformation response: This is simply due to the fact that necking and failure set in beyond these strain spans, which is not properly accounted for by VPSC. The simulation results obtained under the light of these considerations agree well with the experimental data. An exception is the onset of initial plastic deformation, where dislocation – grain boundary interactions and GBMA distribution significantly dictate the stress level. These effects are not considered in the current work as a detailed treatment is needed for their proper incorporation into VPSC. Reference Canadinc, Biyikli, Niendorf and Maier38 More importantly, the stresses and strains attained in the current loading scenario, i.e., impact, are far greater than this relatively narrow zone, and thus, this difference can be disregarded in the current work.
Crystal plasticity modeling of the deformation based on experimentally obtained uniaxial deformation response. The corresponding Voce hardening parameters are also provided.

C. Incorporating the role of microstructure into the FE model utilizing crystal plasticity
To define a proper hardening rule for the FE simulations of the impact deformation, the VPSC model described in detail in the preceding section was used to predict the equivalent stress–strain response of both CG and UFG materials based on the uniaxial deformation response. Specifically, the successful prediction of the experimental data (Fig. 8) is a strong indication that the materials' deformation was successfully modeled at the most basic (microstructural) level. Thus, the same VPSC model was utilized to predict the equivalent stress–strain response of both materials in the plastic deformation zone utilizing the same hardening parameters. However, the material-independent consideration of the stress–strain distribution in an impact sample had demonstrated that two important factors needed to be taken into account for proper modeling of the impact response (Fig. 6): (i) The flow rule should be based on the equivalent stress–strain response of the material, and (ii) the distribution of stresses and strains throughout the sample is significantly heterogeneous. While the first concern can be eliminated by VPSC modeling of the von Mises stress–strain state, the latter is a rather geometry-related issue.
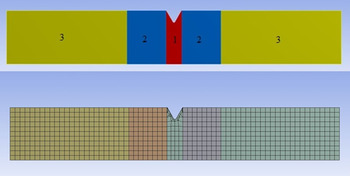
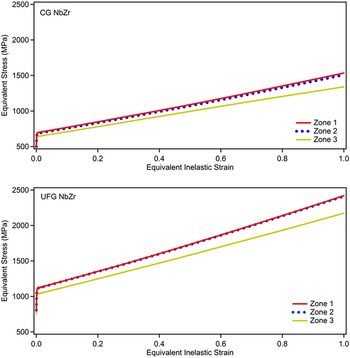
For the purpose of not overlooking the heterogeneous stress–strain distribution within the impact samples (Fig. 6), the FE mesh for each sample was divided into three different zones with three different flow rules (Fig. 9), such that a more homogeneous stress–strain distribution can be obtained within each zone upon impact loading. Consequently, for each zone, the VPSC model was utilized to predict the corresponding equivalent stress–strain state in the plastic deformation regime (Fig. 10) for both CG and UFG NbZr. Specifically, the same hardening parameters as in the VPSC model predicting the experimental uniaxial deformation response were used in all three simulations for each material. The difference between the flow rules stemmed from incorporation of the corresponding velocity gradient tensors of each zone based on the material-independent strain distributions in an impact sample (Fig. 6) when defining the deformation of the polycrystalline aggregate to the VPSC model. The velocity gradient tensors for each zone were computed as:
 $$\dot U_1 = \left[ {\matrix{ {4.2} & {1.0} & 0 \cr {1.0} & { - 2.1} & 0 \cr 0 & 0 & { - 2.1} \cr } } \right],\;\dot U_2 = \left[ {\matrix{ {3.0} & {1.0} & 0 \cr {1.0} & { - 1.5} & 0 \cr 0 & 0 & { - 1.5} \cr } } \right],\;{\rm{and}}\;\dot U_3 = \left[ {\matrix{ {0.3} & 1 & 0 \cr 1 & { - 0.15} & 0 \cr 0 & 0 & { - 0.15} \cr } } \right]\quad.$$
for zones 1, 2, and 3, respectively.
A schematic showing the division of sample geometry based on average stress concentrations, and the corresponding mesh utilized in the FE simulations incorporating VPSC results.

Predicted equivalent stress–strain response of CG and UFG NbZr for each zone of the mesh divided according to stress concentrations (Fig. 9).

The corresponding VPSC simulation results demonstrating the equivalent (von Mises) stress–strain responses for three zones are presented in Fig. 10 for both CG and UFG NbZr. Considering the higher strength of the UFG variant, the results are consistent when compared with each other. Moreover, for each material, higher stresses were obtained for zone 1 as compared with zones 2 and 3, and zone 3 exhibited the lowest stress levels (Fig. 10). This stands in good agreement with the stress intensities demonstrated in Fig. 6, such that the highest stresses are present in zone 1 where the notch is located, and the stress intensity decreases toward zone 3 where the geometry-based stress concentration factor is the smallest. At this point, it should be noted that relatively large strains were considered for simulating the equivalent stress–strain states (Fig. 10), while the strains were significantly smaller in the simulations of the experimental uniaxial deformation response. Specifically, the onset of necking and damage restrict the strain range considered for modeling the experimental uniaxial deformation response, such that only plastic strains up to that corresponding to the ultimate strength of the material were considered in the VPSC simulations. However, the impact samples have a different geometry and much larger strains are attained especially within zones 1 and 2 (Fig. 6). Thus, the flow rule based on the equivalent stress–strain response was defined for relatively large strains (Fig. 10).
The results of the FE simulations incorporating the role of texture with the aid of flow rules based on equivalent stress–strain behavior obtained by the VPSC model are presented in Fig. 11 for CG and UFG NbZr. The comparison of experimental and simulation results revealed that the force–time response upon impact loading can be closely predicted for both CG and UFG NbZr utilizing the approach presented herein. A comparison between the results of the new simulations (Fig. 11) and those that did not consider the role of texture (Fig. 5) indeed emphasizes the necessity of the current approach: The improvement in the prediction of the impact response of UFG NbZr was more significant than in the case of CG NbZr. Considering the fact that the UFG texture has a more dominant role on the deformation response, Reference Niendorf, Canadinc, Maier, Karaman and Yapici11–Reference Toker, Rubitschek, Niendorf, Canadinc and Maier13 it was expected that incorporation of the initial textures would yield a more significant improvement in the case of UFG NbZr, which also constitutes an indication of the success of the current multiscale modeling approach.
Comparison of results of the FE simulations incorporating VPSC and experimental impact response for CG and UFG NbZr in terms of force versus time data.

V. DISCUSSION
The experiment-based modeling approach presented herein has demonstrated that the proper treatment of microstructure is critical for an accurate prediction of the impact response. Even though the current work should be considered an initial approach yet to be further improved, the corresponding findings have clearly demonstrated the fact that accounting for the microstructure through a multiscale modeling approach yields more reliable predictions (Fig. 11) as compared with standard FE analysis (Fig. 5). Furthermore, the current modeling results also emphasize the necessity for considering a multiaxial stress–strain state when defining the hardening of the material, which addresses the geometry-based differences in stress–strain fields.
An important point of discussion arises from the rate of deformation preferred in the uniaxial deformation experiments utilized as an input for crystal plasticity simulations: In a typical impact experiment, the notch area undergoes deformation at equivalent strain rates in the order of 103 s−1, which significantly differs from the strain rate utilized in the current experiments (5 × 10⁻⁴ s−1). However, one should note that the primary reason for utilizing the experimental uniaxial tensile deformation response is to provide the FE solver with an experimental hardening response of the material under loading. While for highly strain rate sensitive materials, the experiments carried out at the current strain rate of 5 × 10⁻⁴ s−1 would be irrelevant, for the current NbZr alloy, no evidence has been forwarded demonstrating that this material is strain-rate sensitive. Especially for the UFG NbZr, since an already high density of dislocations is prevalent owing to the initial severe plastic deformation, the rate effects are negligible when testing for the hardening response of the material. Furthermore, the experimental data obtained for defining the plastic flow at the microscopic level through crystal plasticity modeling should ideally be obtained under conditions where stability, and thus, the precision of the data can be ensured. Reference Canadinc, Biyikli, Niendorf and Maier38,Reference Canadinc, Sehitoglu, Maier and Kurath39,Reference Biyikli, Canadinc, Maier, Niendorf and Top42 Intermediate strain rates, such as the one utilized in this work, satisfy this requirement, and therefore, the uniaxial deformation experiments featured a strain rate of 5 × 10⁻⁴ s−1. Even though this choice of strain rate can be argued to be initially acceptable for the new approach presented herein, experimental data obtained at higher strain rates should eventually be utilized in future work to work with more representative data.
Despite the clear success of the current modeling approach in predicting the impact response of the biomedical NbZr alloy with two different microstructures, the authors admit that the current methodology could be further improved. Specifically, the utility of VPSC to predict the equivalent stress–strain state of both CG and UFG NbZr based on the experimentally measured initial textures and uniaxial deformation responses made it possible to account for the microstructural differences between the two materials in impact simulations. However, a close examination of the initial textures reveals that the difference between the two materials is not very significant prior to deformation (Fig. 7). It is certain that the strength difference in the equivalent stress–strain states provided by VPSC (Fig. 10) based on the experimentally measured deformation responses Reference Niendorf, Maier, Canadinc, Yapici and Karaman12 (Table I) correctly reflects the different characteristics of the CG and UFG microstructures. However, considering the true meaning of texture and the way VPSC incorporates texture, the scope for further improvement becomes clear.
Specifically, the VPSC algorithm considered herein uses the experimentally measured texture to define each grain's orientation in space, such that the stress–strain fields applied onto a polycrystalline aggregate can be distributed properly onto all grains, and the corresponding microdeformation mechanisms can be activated. Reference Canadinc, Biyikli, Niendorf and Maier38,Reference Lebensohn and Tomé40 However, it has been previously demonstrated that the GBMA distribution is also an important element of texture that strongly influences the deformation response especially in the case of UFG materials. Reference Niendorf, Canadinc, Maier, Karaman and Yapici11–Reference Toker, Rubitschek, Niendorf, Canadinc and Maier13,Reference Gabor, Canadinc, Maier, Hellmig, Zuberova and Estrin26–Reference Niendorf, Canadinc, Maier, Karaman and Sutter28,Reference Canadinc, Biyikli, Niendorf and Maier38,Reference Biyikli, Canadinc, Maier, Niendorf and Top42 With this objective, the authors had previously developed an algorithm that constructs a three-dimensional grain neighborhood based on the two-dimensional experimental texture measurements Reference Biyikli, Canadinc, Maier, Niendorf and Top42 to incorporate the role of GBMA distribution into crystal plasticity. Reference Canadinc, Biyikli, Niendorf and Maier38 The corresponding results had demonstrated that the incorporation of the GBMA distribution provided more accurate predictions not only for UFG microstructures, but also for CG materials, when predicting the deformation response. Admittedly, this approach was not considered in the current work as the emphasis was placed on establishing an initial multiscale modeling approach to the problem of accurately predicting the impact response of the biomedical NbZr alloy. However, the success of the current approach has been encouraging, and further improvement of the multiscale modeling approach presented herein by the incorporation of the GBMA distribution into crystal plasticity has been planned as the follow-up of the current work.
VI. CONCLUSIONS
The current study was undertaken to establish a modeling approach that incorporates both microstructural and geometric effects into the design process of implants, such that the undesired mechanical failure of implants can be prevented or predicted at the design stage. The roles of microstructure and anisotropy on the impact response of the biomedical niobium–zirconium (NbZr) alloy were experimentally studied utilizing samples featuring both CG and UFG microstructures. FE simulations of the impact experiments were carried out, where the roles of both anisotropy and geometry-based distribution of stresses and strains upon loading were successfully taken into account by incorporating a proper multiaxial material flow rule obtained from crystal plasticity simulations into the FE analysis. Specifically, equivalent stress–strain states of both CG and UFG NbZr obtained from a VPSC model based on the experimental uniaxial deformation responses and initial textures were utilized to define the material flow during FE impact simulations, such that both microstructure and geometric effects were accounted for. The current findings have evidenced the success of the combined experimental – computational approach presented herein, such that incorporation of the microdeformation mechanisms, texture and anisotropy, and the flow rule based on the equivalent stress–strain state resulted in very close predictions of the experimental impact response of both CG and UFG NbZr. These predictions stand in much better agreement with the actual experimental data as compared with the case of defining the hardening rule solely based on the experimental uniaxial deformation response of the material. Overall, the approach presented herein constitutes a step forward and important guideline for the design process of dental and orthopedic implants made from metallic biomedical materials, such as the NbZr, where texture plays a significant role on the deformation response of the material.
ACKNOWLEDGMENT
Financial support by the Turkish Academy of Sciences (TÜBA) within the Outstanding Young Scientist Award Program (GEBİP) is gratefully acknowledged.