I. INTRODUCTION
Carbon dioxide (CO2) is the primary greenhouse gas causing global warming. From 1960 to 2010, CO2 concentration in the atmosphere has increased from 310 to 390 ppm.Reference Li, Ma, McCarthy, Sculley, Yu, Jeong, Balbuena and Zhou1,Reference Kenarsari, Yang, Jiang, Zhang, Wang, Russell, Weif and Fan2 Addressing the challenge of climate change, most of the research now focuses on CO2 capture. In the past decade, various types of adsorbents including zeolites,Reference Su and Lu3,Reference Bonenfant, Kharoune, Niquette, Mimeault and Hausler4 metal organic frameworks (MOFs),Reference Li, Sullivan and Rosi5,Reference Jian, Thallapally, McGrail, Brown and Liu6 porous polymers,Reference Zhu, Do-Thanh, Murdock, Nelson, Tian, Brown, Mahurin, Jenkins, Hu, Zhao, Liu and Dai7,Reference Lu, Sculley, Yuan, Krishna, Wei and Zhou8 solid amine-based sorbent systems,Reference Hong, Kim and Lee9,Reference Sayari, Belmabkhout and Da’na10 and carbonaceous materialsReference Jimenez, Lucas, Díaz, Sanchez and Romero11–Reference Narasimman, Sujith and Prabhakaran13 have been examined for CO2 capture. In addition, absorption in liquid media such as methanol, aqueous amine, chilled ammonia, etc. is widely used for CO2 capture.Reference Zhao, Su, Tao, Li and Peng14 Absorption in ionic liquids is another established method for the removal of CO2 from flue gases.Reference Ramdin, de Loos and Vlugt15 Solid chemisorbents such as Na2O, K2O, CaO, and MgO are also used for CO2 capture.Reference Grasa, González, Alonso and Abanades16 However, the solid chemisorbents are facing problems such as high-temperature regeneration and decrease in absorption capacity with increase in number of absorption cycles. Solid physisorbents are preferred to liquid and solid chemisorbents because of easy handling, energy efficient regeneration, and low-cost operation.Reference Kenarsari, Yang, Jiang, Zhang, Wang, Russell, Weif and Fan2,Reference Sevilla and Fuertes17
Porous carbonaceous structures are well-known adsorbent materials, studied in CO2 separation applications due to their high surface area, excellent thermal and chemical stability, low-energy requirements for regeneration, hydrophobic surface properties, and viable CO2-friendly adsorption sites on the pore surface and other physical properties. The carbonaceous materials prepared from various precursors show CO2 adsorption capacity in the range of 0.6–5 mmol/g at ambient temperature and pressure.Reference Deanna, Smit and Jeffrey18,Reference Wei, Zhou, Sun, Deng, Xia and Zhao19 These materials also have an advantage over other adsorbents, namely zeolites, MOF, amine on solid support, etc., in terms of the low cost and wide availability of raw materials. The lower heat of adsorption on activated carbons indicates that CO2 is weakly adsorbed on the carbons, requiring less energy for desorption.Reference Balsamo, Budinova, Erto, Lancia, Petrova, Petrov and Tsyntsarski20 Carbons are less affected by the presence of moisture in the feed gas compared to the zeolites due to the hydrophobic nature of most microporous carbons.Reference Bezerra, Oliveira, Vieira, Cavalcante and Azevedo21 Also, they show excellent reversibility even after several regeneration cycles compared to the zeolites. Earlier studies emphasized on the synthesis of high surface area carbon material for maximum CO2 capture efficiency. Recent studies revealed that carbon with micropores, especially pore size less than 1 nm are required to maximize the CO2 adsorption capacity.Reference Wickramaratnea and Jaroniec12,Reference Zhang, Zhou, Xing, Xue, Yan, Zhuo and Qiao22
Numerous carbon materials, including activated carbons, biowaste derived carbons,Reference Plaza, Gonzalez, Pevida, Pis and Rubiera23 biomass derived carbons,Reference Hu, Yu, Wang, Liu and Xu24 and nitrogen-doped carbonsReference Xing, Liu, Zhou, Zhang, Zhou, Zhuo, Yan, Gao, Wang and Qiao25,Reference Xiaoyu, Minhua and Changwen26 have been thoroughly investigated for CO2 adsorption. Nowadays, the leading interest among the carbon researchers is the production of carbonaceous materials from biomass. Biomass, because of its low cost, abundance, easy access, and environmental friendly nature, is accepted as a promising starting material for the synthesis of functional carbonaceous materials.Reference Titirici, Thomas and Antonietti27
Cyclodextrin (CD), belonging to the category of biomass, is a cyclic oligosaccharide consisting of six to eight α-(1,4)-linked D-glucopyranose units with a torus-shaped structure having a hydrophobic cavity. β-CD contains seven glucose units and has a hydrophobic cavity of 0.7 nm diameter.Reference Bender and Komiyama28 Novel CD-based carbon materials had been prepared by Shin et al. in 2008 from β-CD solutions under the hydrothermal conditions at 160 °C.Reference Shin, Li-Qiong, In-Tae, Bruce and Gregory29 Shin et al. described the mechanism of carbon formation from CD under hydrothermal conditions as the hydrolysis of CD to glucose, and an intramolecular dehydration reaction resulting in the formation of 5-hydroxymethyl-2-furaldehyde followed by continued dehydration/polymerization and aromatization reactions. Recently, Zhao et al. reported a novel approach to prepare CD-based carbon materials with high specific surface area through a solvothermal carbonization process using o-dichlorobenzene as the solvent and p-toluene sulfonic acid (PTSA) as the catalyst to accelerate the carbonization process of carbohydrates.Reference Zhao, Zhao, Li-Juan and Han30 The amount of PTSA used in the study was mentioned as catalytic amount. Our preliminary investigations with the system showed that the amount of PTSA is very critical in developing micro/mesoporosity in the solvothermal char (STC). Moreover, a detailed study on the CO2 adsorption using the STC is lacking. In this contest, we have prepared a series of solvothermal carbon materials from β-CD with varying amount of PTSA and optimized the PTSA concentration for maximum CO2 absorption capacity. We have also studied the contribution of PTSA toward the STC yield. The effect of high-temperature activation on further improvement in microporosity and CO2 adsorption capacity was evaluated. The role of two step carbonization, namely solvothermal carbonization followed by high-temperature activation toward the formation of microporous carbon with better CO2 adsorption capacity was confirmed by comparing with carbon material prepared by direct carbonization of β-CD.
II. EXPERIMENTAL
β-CD (≥97%), p-toluene sulfonic acid monohydrate (PTSA), and o-dichlorobenzene were purchased from Aldrich, India and used as received. All solvothermal carbonizations were done using a Teflon-lined stainless-steel autoclave of 25 mL capacity. Mixtures of β-CD (250 mg) and PTSA with PTSA to β-CD weight ratios in the range of 0–10 suspended in o-dichlorobenzene (10 mL) were ultrasonicated for 30 min. The reaction mixture was then transferred to the autoclave, sealed and kept at 180 °C for 24 h. After the reaction, the autoclave was cooled down to room temperature. The black solid residue, denoted as STC, was filtrated and washed successively with acetone, distilled water, and ethanol. The product was dried in vacuum at 120 °C for 24 h.
High-temperature activation of the STC was conducted in an ultra-high pure argon atmosphere in tubular furnace at different temperatures, namely 400, 500, 700, 800, 900, and 1000 °C for 2 h. The heating rate used for carbonization was 2 °C/min. The same atmosphere was maintained during the cooling of the furnace.
Thermogravimetric analysis of the STC was carried out using TG-MS model Perkin Elmer Pyris 1 thermogravimetric analyzer (Shelton, CT). The evolved gas analysis was carried out using a Clarus SQ 8T mass spectrometer (Waltham, MA) connected to the thermogravimetric analyzer.
Elemental analysis was carried out using Perkin Elmer 2400 Series II CHNS analyzer (Waltham, MA). The morphology of the STC before and after high-temperature activation was obtained through field emission scanning electron microscopy (JEOL microscope JSM 6060, Tokyo, Japan). Microstructure of the carbon samples was evaluated using transmission electron microscope model FEI (TEM, Tecnai G2 30 S-TWIN, Hillsboro, OR) with an accelerating voltage of 300 kV. For TEM measurements, the sample dispersed in acetone was drop-casted on the carbon-coated copper grid and dried in vacuum at room temperature before observation.
The porous textural properties of the STC before and after high-temperature activation were analyzed using the volumetric N2 adsorption–desorption at −196 °C using a surface area analyzer (Micromeritics Tristar II, Norcross, GA). The STC before and after high-temperature activation was degassed at 120 and 300 °C, respectively, for 16 h prior to the analysis. The specific surface area was measured from the isotherm in the relative pressure range between 0.05 and 0.2 according to the Brunauer–Emmett–Teller (BET) method. The pore size distribution was obtained from density functional theory (DFT). The Barrett-Joyner-Halenda (BJH) method was used to find out the mesopores from the adsorption curve of the isotherm. The micropore volume was calculated from the t-plot. The total pore volume was estimated from the amount of N2 adsorbed at a relative pressure of 0.99.
The CO2 adsorption capacity of the STC before and after the activation was evaluated at 0 and 25 °C by volumetric gas adsorption studies using the surface area analyzer. The samples were degassed overnight. The degassing temperature was 120 and 300 °C for STC before and after the activation, respectively. The volumetric CO2 absorption measurements were carried out using 200 mg of STC and the sample is equilibrated at each pressure for 20 s before collecting the data. The heat of adsorption of CO2 on the STC before and after activation was determined using differential scanning calorimetry (DSC). The samples were heated at 100 °C in nitrogen atmosphere to remove preadsorbed moisture and CO2 molecules.
The adsorption of CO2 from air was studied by gravimetric method using a Perkin Elmer Pyris 1 thermogravimetric analyzer with the following temperature protocol. About 5 mg of the adsorbent was loaded in a platinum pan of the thermogravimetric analyzer and heated at 110 °C for 10 min under argon flow at a rate of 100 mL/min for desorption of adsorbed molecules. The gas flow was shifted from argon to dry air (air dried over silica trap) containing 400 ppm CO2 once the sample temperature reached 25 °C. The weight gain of the sample for a period of 12 h was taken as direct adsorption capacity.
III. RESULTS AND DISCUSSIONS
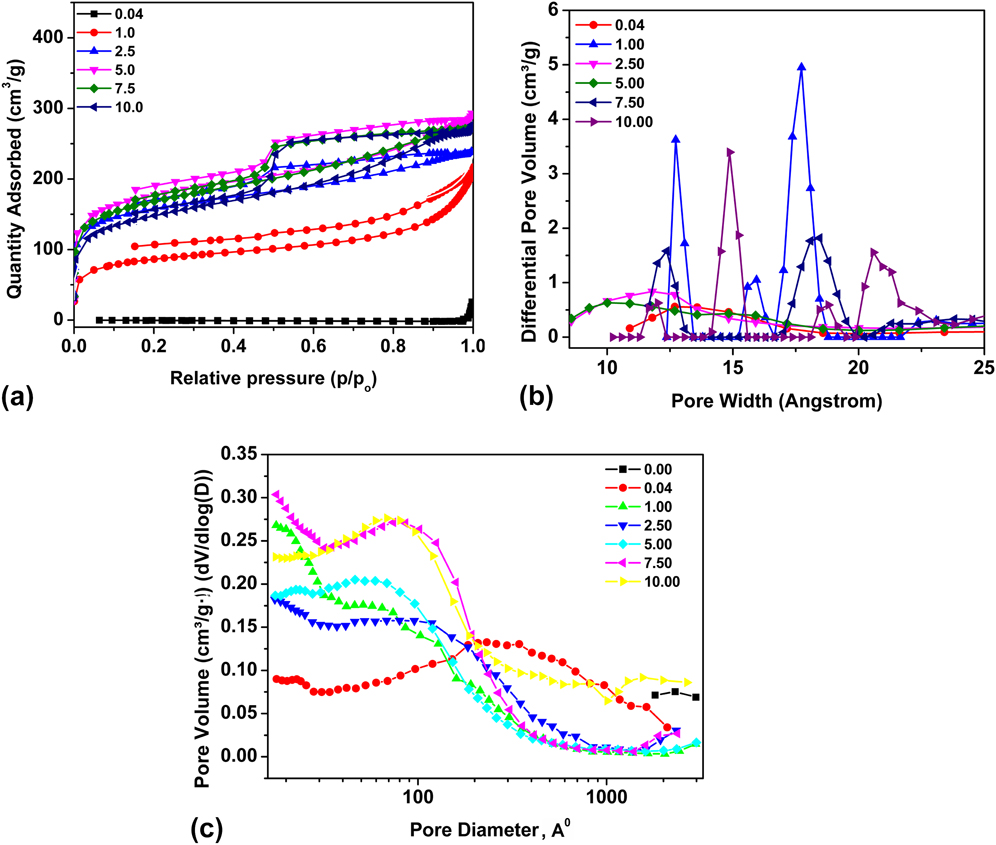
It has been reported by Zhao et al. that the solvothermal carbonization of β-CD in o-dichlorobenzene using catalytic amount of PTSA produces microporous carbon with surface area of 699 m2/g and total pore volume of 0.4 cm3/g.Reference Zhao, Zhao, Li-Juan and Han30 Our investigations with the system for CO2 capture showed that the surface area and microporosity of STC increased with an increase in the PTSA concentration and the surface area values close to that reported by Zhao et al. could be achieved at a PTSA to β-CD weight ratio of 2.50. Moreover, elemental analysis showed the presence of 30–40 wt% oxygen in STC. We have also observed that the STC yield increased with an increase in the PTSA concentration indicating that PTSA contributes to the char yield. The N2 adsorption–desorption isotherm and pore size distribution, obtained from the adsorption data using DFT and BJH, of the STC at various PTSA concentrations are shown in Fig. 1. Contrary to Zhao et al., we observed a strong hysteresis between adsorption and desorption branches, indicating major mesoporosity. Peaks at pore size nearly 100 Å are observed in the pore size distribution obtained from BJH calculations in addition to the micropores revealed by the DFT calculations. The yield, oxygen content, and textural properties of STC obtained at various PTSA to β-CD weight ratios are given in Table I. The decrease in the oxygen content in the STC with an increase in the PTSA concentration indicates an increase in the condensation of oxygen containing functional groups at higher catalyst concentrations.
(a) N2 adsorption–desorption isotherms, (b) DFT pore size distribution, and (c) BJH pore size distribution of STC at various PTSA to β-CD weight ratios.

Yield and textural properties of STC prepared at various PTSA to β-CD weight ratios.

V p is the single point pore volume calculated from adsorption isotherm at p/p 0 = 0.99; S BET is the BET specific surface area obtained from the adsorption data in the p/p 0 range from 0.05 to 0.2, S tm is the micropore surface area, and V m is the total micropore volume.
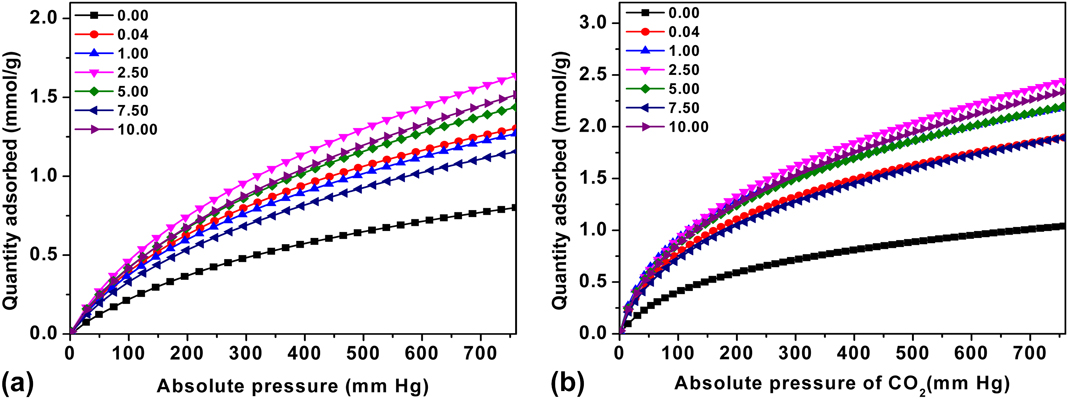
Figure 2 shows the CO2 adsorption on the STC prepared at various PTSA to β-CD weight ratios. The CO2 adsorption capacity of the STC increased with an increase in the PTSA concentration and reached a maximum at a PTSA to β-CD weight ratio of 2.5 and then showed decreasing trend with further increase in the PTSA concentration. The variation of CO2 adsorption capacity with the PTSA concentration is in accordance with the variation of surface area and pore volume. In addition, the polar hydroxyl functional groups present in the STC have a positive impact on the CO2 adsorption as reported by Zhao et al.Reference Zhao, Zhao, Li-Juan and Han30 That is, the CO2 quadrupole likely to interact with the polar hydroxyl groups on the walls of the micropores. The maximum CO2 adsorption capacity obtained at 1 bar pressure was 1.64 and 2.44 mmol/g at 25 and 0 °C, respectively.
CO2 adsorption of STC at various PTSA to STC weight ratios at (a) 25 °C and (b) 0 °C.

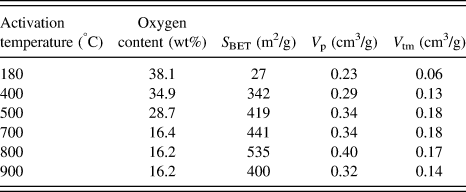
The requirement of exorbitantly high concentration of PTSA makes this route a costlier one for the preparation of microporous carbon for CO2 adsorption. Moreover, the CO2 adsorption capacity of the STC is relatively low in spite of the high surface area. It is well known that the CO2 adsorption capacity depends more on the microporosity in the adsorbent than the total surface area. These factors prompted us to study the effect of high-temperature activation of STC prepared at various PTSA concentrations to increase their microporosity and CO2 adsorption capacity. The surface area and microporosity of the STC increased with an increase in activation temperature and reached a maximum at 800 °C. There is a corresponding decrease in the oxygen content in the STC. The effect of activation temperature on the surface area, pore volume, and oxygen concentration of STC prepared at a PTSA to β-CD weight ratio of 0.04 is shown in Table II. It is clear that the increase in surface area and microporosity during heat treatment is due to an in situ activation by the removal of carbon by the reaction with oxygen present in the STC.
The variation of surface area, pore volume, and oxygen concentration of STC with activation temperature (PTSA to β-CD weight ratio 0.04).

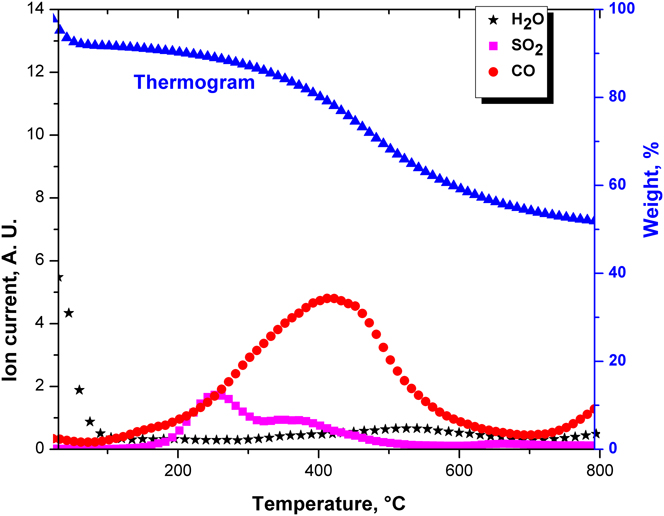
Thermogravimetric analysis of the STC is shown in Fig. 3. The gases evolved at each weight loss were evaluated using mass spectrometer attached to TG analyzer. The initial weight loss of nearly 17% observed at temperature below 150 °C corresponds to the loss of adsorbed moisture and CO2. Nearly 2.5% weight loss observed at temperature in the range of 150–300 °C is attributed to the evolution of SO2. The weight loss of ∼30% observed in the temperature range of 300–800 °C is due to the removal of carbon as CO by the reaction with oxygen present in the STC. This removal of carbon as CO would create additional micropores in the STC. The char residue retained at 800 °C is approximately 50%.
TG-MS of STC at a PTSA to β-CD ratio of 0.04.

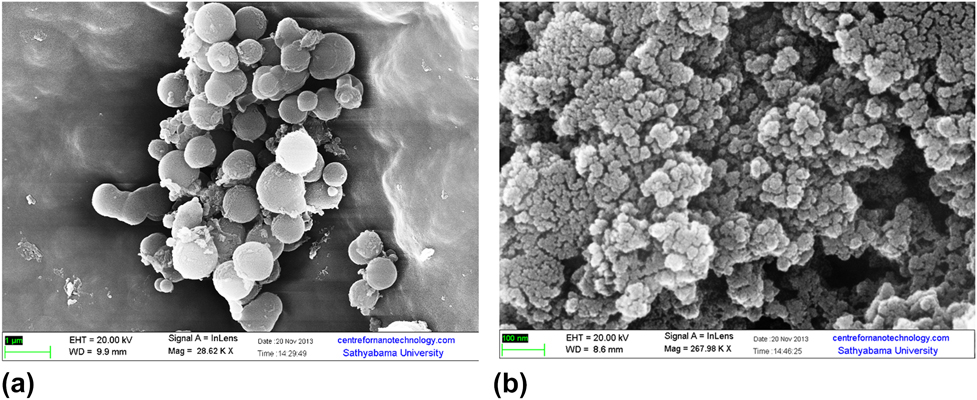
Figure 4 shows the SEM micrographs of STC and activated STC prepared at a PTSA to β-CD weight ratio of 0.04. The STC produced from β-CD at all the studied PTSA concentrations contains spheres of size less than 500 nm. These spheres are agglomerates of smaller particles. The majority of the agglomerates lose their spherical morphology during high-temperature activation.
SEM images of STC obtained at a PTSA to β-CD weight ratio of 0.04 (a) before and (b) after activation.

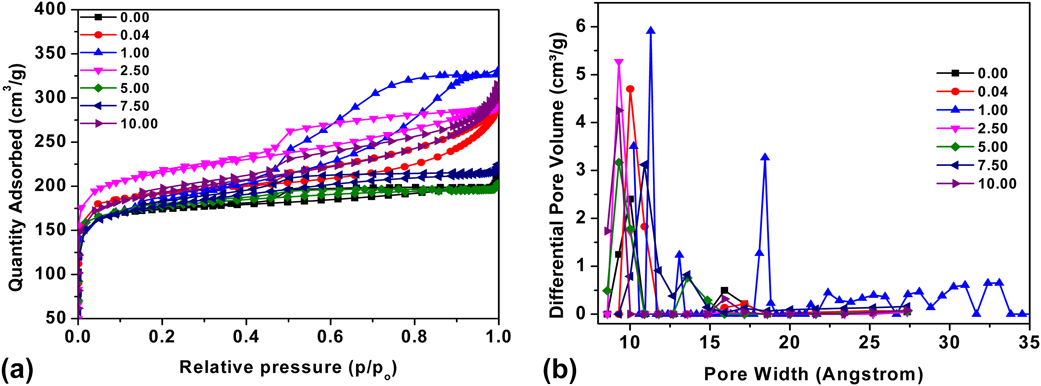
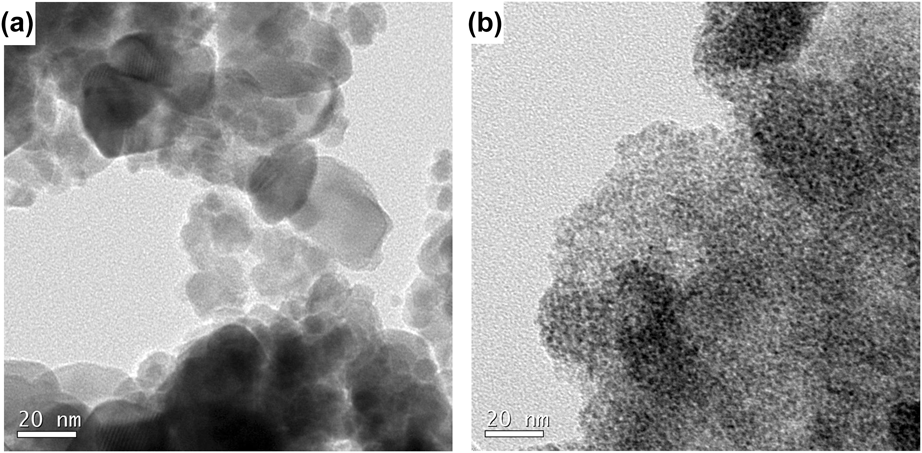
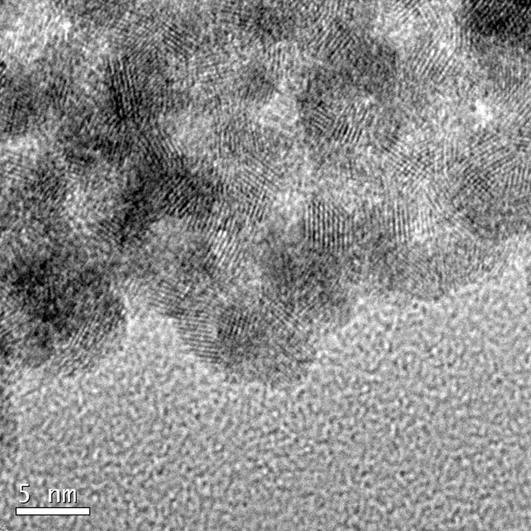
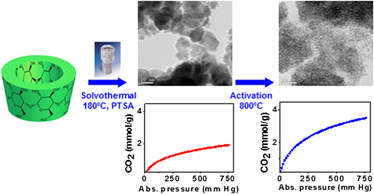
Figure 5 shows the N2 adsorption–desorption isotherm and pore size distribution, calculated from the adsorption data using DFT, of STC activated at 800 °C. The textural properties of the activated STC are given in Table III. The surface area and total pore volume of the activated STC also showed increasing trend with the PTSA concentration up to a PTSA to β-CD weight ratio of 2.5 and then showed decreasing trend with further increase in the PTSA concentration. Moreover, the contribution of micropore to the total pore volume increased due to the activation. This shows that majority of the pores created due to the removal of carbon by the in situ activation at higher temperature is micropores. However, the increase in surface area and pore volume with the PTSA concentration in the activated STC was not as significant as before the activation. That is, the STC prepared at low PTSA concentration showed a tremendous increase in surface area and pore volume upon high-temperature activation. This is further evidenced from the TEM study as the dense particles in the STC prepared at a PTSA to β-CD weight ratio of 0.04 showed worm-like microporous structure after activation at 800 °C. The TEM micrograph of STC and activated STC at a PTSA to β-CD weight ratio of 0.04 is shown in Fig. 6. The STC prepared at PTSA to β-CD weight ratios in the range of 0.04–2.5 showed more or less the same microstructure after the activation. The TEM micrographs of STC and activated STC at a PTSA to β-CD weight ratio of 2.5 showing the increase in microporosity during activation are shown in Figure S1 of supporting information.
(a) N2 adsorption–desorption isotherm and (b) pore size distribution of STC prepared at various PTSA to β-CD weight ratios after activation at 800 °C.

Textural properties of STC prepared at various PTSA to β-CD weight ratios after activation at 800 °C.

TEM images of (a) STC and (b) activated STC at a PTSA to β-CD weight ratio of 0.04.

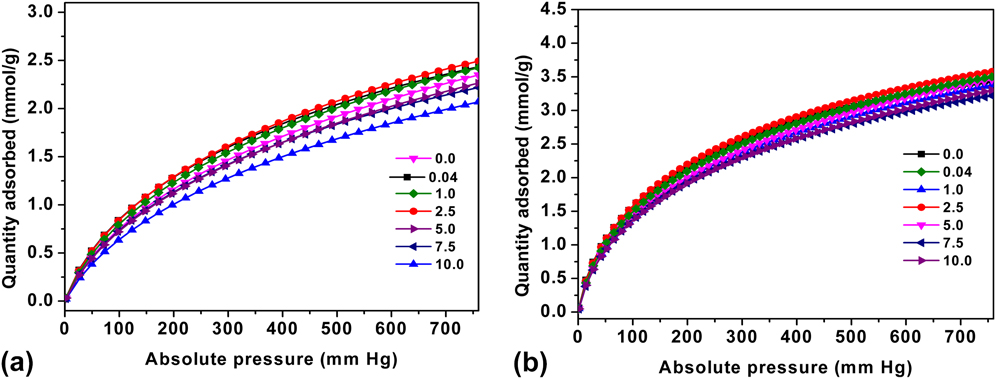
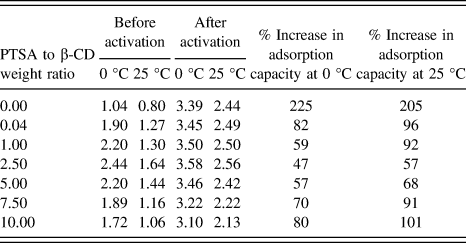
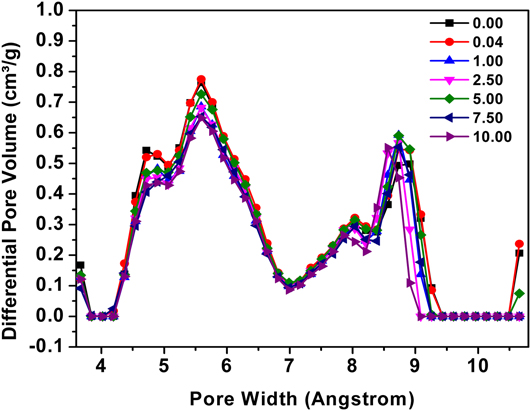
The CO2 adsorption on the activated STC prepared at various PTSA concentrations is shown in Fig. 7. The activated STC showed higher CO2 adsorption capacity compared to the corresponding one before activation. The maximum CO2 absorption capacity of the obtained activated STC is 3.58 and 2.56 mmol/g at 0 and 25 °C, respectively. Unlike the STC, the activated STC showed an increase in CO2 adsorption capacity at 25 °C from 2.44 to 2.56 mmol/g when the PTSA to β-CD weight ratio increased from 0 to 2.5. Further increase in the PTSA concentration showed a decrease in CO2 adsorption capacity. The activated STC prepared at PTSA to β-CD weight ratios in the range of 0–2.5 showed CO2 adsorption capacity of 3.39–3.58 mmol/g at 0 °C. The effect of activation on CO2 adsorption capacity of STC prepared at various PTSA concentrations is summarized in Table IV. The DFT calculation on CO2 adsorption at 0 °C showed the presence of ultramicropores in the activated STC. The pore size distribution obtained by DFT calculation on CO2 adsorption at 0 °C is shown in Fig. 8. The increase in CO2 adsorption capacity observed is mainly due to this ultramicropores, as the ultramicropores highly favor the adsorption of CO2 molecules.
CO2 adsorption isotherm of activated STC prepared at various PTSA to β-CD weight ratios at (a) 25 °C and (b) 0 °C.

Effect of activation on CO2 adsorption capacity of STC at various PTSA to β-CD weight ratios.

Micropore size distribution of activated STC at various PTSA to β-CD weight ratios obtained from CO2 adsorption at 0 °C.

It has been reported that the formation of a rigid prepolymer with a high degree of polymerization is required to preorganize the molecules to produce the microporosity and to preserve the microporosity during subsequent carbonization. The increase in surface area, pore volume, and CO2 adsorption capacity of STC with an increase in the PTSA concentration upto 2.5 times the weight of β-CD indicates that a high concentration of catalyst is required to form the prepolymer with the high degree of polymerization. On the other hand, a decrease in surface area, pore volume, and CO2 adsorption capacity at PTSA to β-CD weight ratio above 2.5 is due to the contribution of PTSA to the STC yield.
The contribution of PTSA to STC yield is confirmed by the fact that the solvothermal experiment conducted with PTSA in o-dichlorobenzene without the β-CD produced a brown char having the elemental composition 59.5 wt% carbon, 2.2 wt% hydrogen, 4.8 wt% sulfur, and 33.5 wt% oxygen. The STC obtained from the PTSA has flakes like morphology as evidenced from the SEM image as shown in Figure S2. This STC is amorphous and gave 50 wt% residue when carbonized at 800 °C in argon atmosphere for 2 h. The residue obtained contains graphite-like carbon as evidenced from the TEM image and x-ray diffraction (XRD) spectra as shown in Figure S3. The STC produced from PTSA and the carbon produced by pyrolysis of the same at 800 °C has the surface area of 0.8 and 1.8 m2/g and the total pore volume of 0.008 and 0.12 cm3/g, respectively. These observations indicate that the PTSA in o-dichlorobenzene produces some polymeric structure which produces graphite-like carbon on pyrolysis at 800 °C. This is confirmed by the fact that the high-temperature activation of STC produced at higher PTSA to β-CD ratios showed microporous amorphous region due to the carbon from β-CD and dense graphite-like regions due to the carbon from PTSA in the TEM image. Figure 9 shows the TEM image of the activated STC at a PTSA to β-CD weight ratio of 10 showing the amorphous and graphite-like region. The decrease in pore volume and CO2 adsorption capacity at PTSA to β-CD weight ratios higher than 2.5 is due to this nonporous graphite-like carbon produced from the PTSA. The information of PTSA contribution to the STC yield is vital as PTSA is a commonly used catalyst in solvothermal carbonization of biomass for the production of functional carbon materials. The TEM micrograph of STC at a PTSA to β-CD weight ratio of 10 is shown in Figure S4 of supporting information.
TEM image of activated STC at PTSA to β-CD weight ratio of 10.

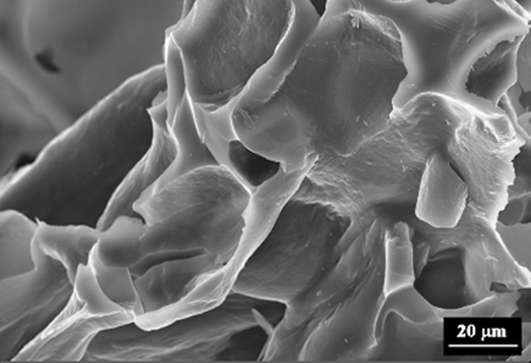
The importance of the two step carbonization process, namely solvothermal carbonization and activation toward the formation of microporous carbon with better CO2 absorption capacity was confirmed by the synthesis of carbon material by direct carbonization of β-CD at 800 °C. Thus, the prepared foam-like carbon material showed low surface area (39 m2/g), low total pore volume (0.044 cm³/g), and low CO2 adsorption capacity (1.82 mmol/g at 25 °C) compared to the activated STC. This emphasizes the importance of intermediate solvothermal reaction for the development in microporosity. The morphology of the carbon material obtained by the direct carbonization at 800 °C of β-CD is shown in Fig. 10.
Morphology of carbon obtained by direct carbonization of β-CD at 800 °C.

To understand the CO2 adsorption mechanism, the isotherms are simulated by Dubinin–Radushkevich (D–R) equation. D–R equation is written as
 $$\ln V = \ln {V_0} - {\left( {{{{\rm{RT}}} \mathord{\left/ {\vphantom {{{\rm{RT}}} {\beta {E_0}}}} \right. \kern-\nulldelimiterspace} {\beta {E_0}}}} \right)^2}{\left[ {{{{p_0}} \mathord{\left/ {\vphantom {{{p_0}} p}} \right. \kern-\nulldelimiterspace} p}} \right]^2}\quad ,$$
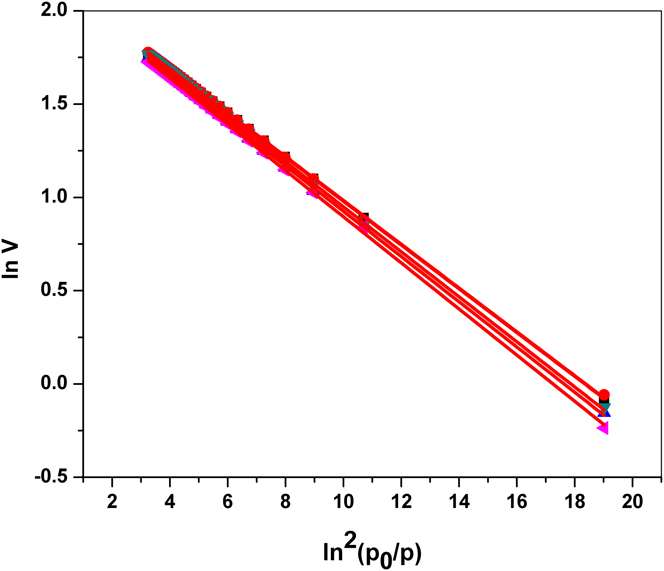
where V is the gas uptake when the adsorption potential is A = RT ln(p 0/p), V 0 is the limiting micropore uptake, E 0 is the characteristic adsorption potential for a standard adsorbate, and β is the affinity constant. As shown in Fig. 11, a plot of ln(V) against ln2(p/p 0), the adsorption data fit well with D–R equation indicating that the CO2 adsorption on the porous carbons could be well depicted by a micropore filling mechanism.
CO2 adsorption isotherm model of activated STC fit with D–R equation.

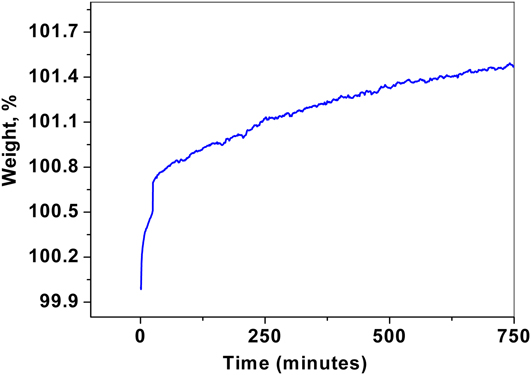
Capturing CO2 directly from ambient air is commonly referred to as the direct air capture (DAC). Physisorbents such as activated carbons and zeolites are expected to have low CO2 adsorption capacities in DAC because of their low heat of adsorption leading to shallow adsorption isotherms at very low partial pressures.Reference Choi, Drese and Jones31,Reference Chue, Kim, Yoo and Cho32 The CO2 adsorption characteristics of activated STC from dry air containing ∼400 ppm CO2 were evaluated using TGA experiments. Figure 12 shows the weight gain of the activated STC in dry air at 25 °C as a function of time. The weight gain due to CO2 adsorption was fast in the initial few minutes and thereafter sluggish. The sample showed a weight gain of 0.8 wt% in 30 min and 1.56% in 12 h. This corresponds to a total CO2 adsorption capacity of 0.35 mmol/g. The kinetics of CO2 adsorption depends on pore size, size distribution, and presence of basic surface functional groups. In addition, adsorbent with a hierarchical pore structure containing macro, meso, and micropores facilitates adsorption as the CO2 molecules can easily diffuse through the hierarchical pores and access the micropores. In the present case, the faster adsorption observed in the initial period is due to the filling of CO2 molecules in the ultramicropores because of high surface potential. On the other hand, the sluggish kinetics observed after 30 min is attributed to the adsorption of CO2 in the mesopores. Lu et al. summarized the direct adsorption capacity from air of various adsorbent materials.Reference Lu, Sculley, Yuan, Krishna and Zhou33–Reference Mason, Sumida, Herm, Krishna and Long36 The CO2 adsorption capacity in DAC using the activated STC is higher than for zeolites and some of the metal organic framework reported in the literature.
TG showing direct adsorption of CO2 from air at 25 °C.

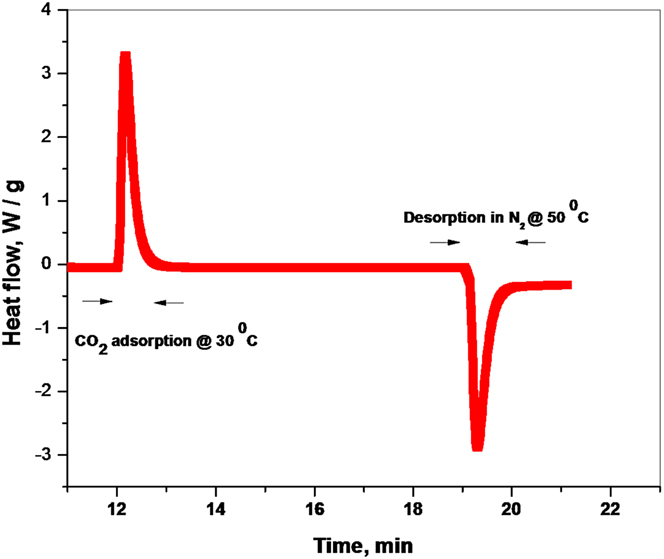
The adsorbent once used for CO2 capture needs to be regenerated either by increasing the temperature or by decreasing the pressure. Energy requirement for regeneration is one of the decisive factors for practical applications as the zeolite-based systems currently in practice face problem due to the requirement of high temperature for regeneration. Figure 13 is a DSC curve showing the CO2 adsorption at 25 °C (exothermic peak) and desorption at 50 °C (endothermic peak). That is, the activated STC once used for CO2 adsorption could be regenerated by heating at a low temperature of 50 °C. The heat of adsorption calculated from the DSC showed values nearly 32 kJ/mol implying physical adsorption.Reference Choi, Drese and Jones31
DSC graph showing CO2 adsorption at 30 °C and desorption at 50 °C.

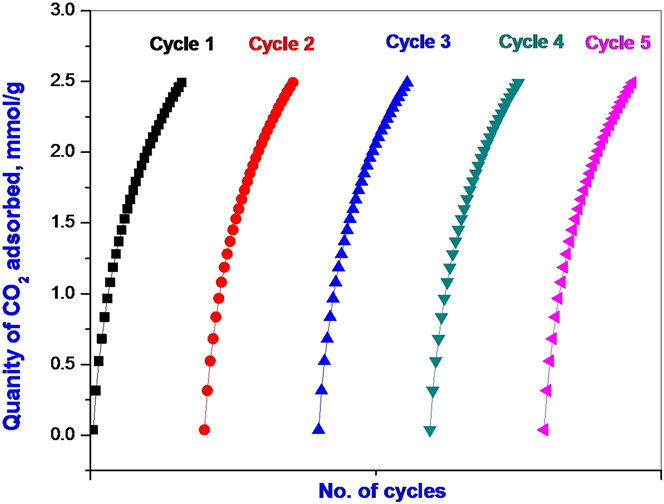
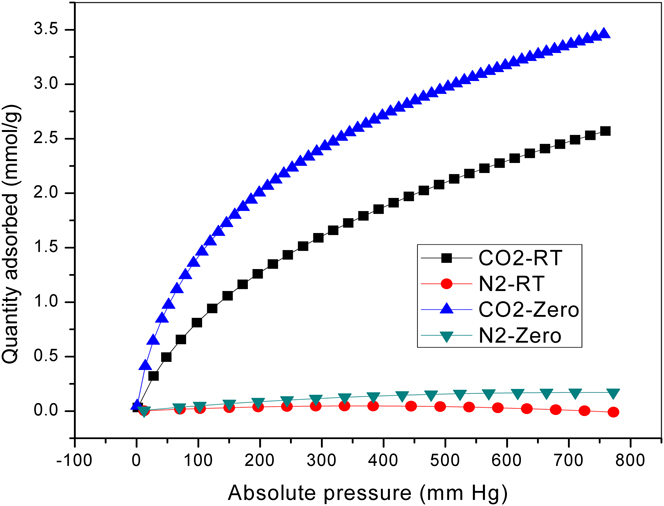
Recyclability and selectivity are the other two important factors for an acceptable adsorbent material. A good adsorbent should retain its adsorption capacity without any change after several adsorption–desorption cycle. In addition, the adsorbent should preferentially adsorb the adsorbate of interest in the presence of other molecules. Figure 14 shows the CO2 adsorption isotherms showing the recyclability of the activated STC. The activated STC showed the same adsorption capacity when tested with pure CO2 gas at 25 °C for several adsorptions–desorption cycles. Figure 15 shows the adsorption isotherms showing the selectivity of CO2 adsorption over N2. The activated STC adsorbs negligible amount of N2 gas compared to the 3.5 mmol/g CO2 at 0 °C and 1 bar pressure.
The CO2 adsorption isotherms at 25 °C showing the recyclability of activated STC.

The adsorption isotherms of activated STC showing selectivity of CO2 adsorption over N2 at 25 °C and 0 °C.

IV. SUMMARY
The effect of PTSA concentration and high-temperature activation on the textural properties and CO2 adsorption capacity of STC obtained from β-CD has been studied. The contribution of nonporous graphite-like carbon from the PTSA catalyst to the STC yield was established. The surface area, pore volume, and CO2 adsorption capacity of the STC obtained from β-CD increased with the PTSA concentration and reached a maximum at a PTSA to β-CD weight ratio of 2.5. The activation at 800 °C increased the surface area and micropore volume due to the oxidation of carbon by 30–40 wt% oxygen present in the STC, which resulted in an increased CO2 adsorption capacity. The high-temperature activation reduces the significance of the PTSA concentration as the CO2 adsorption capacity of STC prepared at PTSA to β-CD weight ratios in the range of 0–2.5 shifted from a wide range of 1.04–2.44 mmol/g to a narrow range of 3.39–3.58 mmol/g after the activation. The significance of solvothermal step before high-temperature activation for the formation of highly porous nanocarbon spheres was proved. The activated STC showed significant adsorption (0.35 mmol/g) of CO2 from air containing 400 ppm CO2. The CO2 adsorption on the activated STC showed low-temperature regeneration, excellent recyclability, and selectivity over nitrogen.
Supplementary Material
To view supplementary material for this article, please visit http://dx.doi.org/jmr.2015.116.
ACKNOWLEDGMENTS
We gratefully acknowledge Director, VSSC and Director, IIST for financial support.