I. INTRODUCTION
In 2001, Gong and coworkers reported on anodization of Ti and synthesized highly ordered nanotube arrays.Reference Gong, Grimes, Varghese, Chen, Hu and Dickey1 The precisely oriented structures were suitable for many applications such as photocatalytic applications,Reference Adachi, Murata, Harada and Yoshikawa2–Reference Macak, Zlamal, Krysa and Schmuki6 sensing,Reference Mor, Carvalho, Varghese, Pishko and Grimes7–Reference Varghese, Mor, Grimes, Paulose and Mukherjee10 photoelectrolysis,Reference Varghese, Paulose, Shankar, Mor and Grimes11–Reference Xie, Zhou and Huang15 polymer-based bulk heterojunction photovoltaics,Reference Mor, Shankar, Paulose, Varghese and Grimes16–Reference Yu, Tsai, Tsai, Wong, Yang, Chu and Shyue18 dye-sensitized solar cells,Reference Adachi, Murata, Okada and Yoshikawa19–Reference Zhu, Neale, Miedaner and Frank25 biofluid filtration, drug delivery, and other biomedical applications.Reference Park, Bauer, von der Mark and Schmuki26–Reference Roy, Paulose and Grimes29 These promising prospects require a thorough understanding of the nanotube formation mechanism and controllable preparation of the arrays. Many reports briefly mentioned the growth mechanism of TiO2 nanotube arrays,Reference Mor, Varghese, Paulose, Mukherjee and Grimes30–Reference Mor, Varghese, Paulose, Shankar and Grimes34 in which the key processes of the nanotube growth were described as follows: (i) Oxide growth at the surface of the metal due to interaction of the metal with O2– or OH–. (ii) Metal ion (Ti4+) migration from metal foil at the metal–oxide interface; Ti4+ cations ejected from the metal–oxide interface under the application of an electric field move toward the oxide–electrolyte interface. (iii) Field-assisted dissolution of the oxide at the oxide–electrolyte interface. (iv) Chemical dissolution of the metal, or oxide, by the electrolyte during anodization.Reference Tao, Zhao, Tang, Kang and Li35
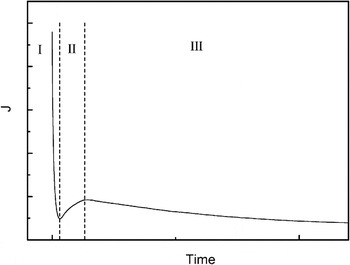
Normally, the current curve recorded during anodization is a convenient way to characterize the electrochemical behavior and the tube growth process.Reference Mor, Carvalho, Varghese, Pishko and Grimes7, Reference Xie, Zhou and Huang15, Reference Shankar, Mor, Prakasam, Varghese and Grimes17, Reference Yu, Tsai, Tsai, Wong, Yang, Chu and Shyue18, Reference Paulose, Shankar, Varghese, Mor, Hardin and Grimes21, Reference Kang, Kim, Kim and Sung31, Reference Beranek, Hildebrand and Schmuki36, Reference Jaroenworaluck, Regonini, Bowen and Stevens37Figure 1 shows a typical current–time transient for the anodization of Ti foil, in which three stages can be easily classified. After an initial exponential decay (stage I), the current increases for a short time (stage II), then the current reaches a quasi-steady state (stage III). In stage III, the current curve is usually found to exhibit oscillation. Typically, this behavior can be ascribed to different stages in the tube-formation process. Quantitative analysis on the current curves, such as the initial current slope, the subsequent oscillation amplitude, and period has not been reported yet. Herein, the current data are quantitatively analyzed and a new growth mechanism, a layer-by-layer model, of TiO2 nanotube arrays is presented to explain the growth process of nanotube arrays.
Typical current curve consisting of three stages.

II. EXPERIMENTAL
The Ti foils (0.1 mm in thickness, 99.6% purity) were degreased prior to anodization by sonicating in acetone, rinsed with deionized (DI) water, and dried in a nitrogen stream. The electrochemical setup consists of a high-voltage potentiostat Jaissle IMP 88 and a classical two-electrode cell with 1 cm between the two electrodes and 1 cm2 Ti surface open to the electrolyte. The samples A1, A2, and A3 were anodized in solutions containing 0.175 M NH4F composed of mixtures of DI water and glycerol (volume ratio 3:97%) at 30 V for 3, 6, and 12 h, respectively. The samples B1, B2, B3, B4, and B5 were prepared in mixed electrolyte containing DI water and glycerol (volume ratio 50:50%) and 0.175 M NH4F at 30 V for 1/12, 1/6, 1/3, 2/3, and 2 h, respectively. Samples C1 and C2 were anodized in glycerol: 0.175 M NH4F at 20 and 15 V for 2 h, respectively. The current data, with an accuracy of 0.001 mA, were collected and ported to a computer. After the experiments, the samples were rinsed with DI water and dried in a nitrogen stream. A scanning electron microscope Hitachi FE-SEM S4800 (Japan) was used for the structural and morphological characterization of the TiO2 nanotubular arrays. From SEM cross-sectional images of mechanically bent samples, the thickness of the layers was directly detected.
III. RESULTS AND DISCUSSION
A. Current characterization
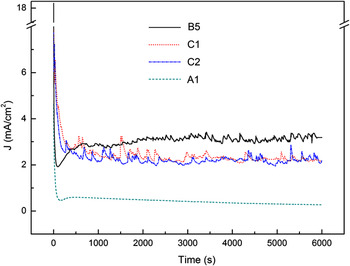
Figure 2 shows the typical current transients recorded for the samples anodized under different anodic conditions. From the current curves of samples B5 and A1 (the current curves of A2 and A3 are similar to that of A1), the three stages can be clearly seen. The currents of B5, C1, and C2, prepared in water-rich electrolyte, show a notable fluctuation in stage III. But for C1 and C2, it seems that there is no stage II in the current curves. Interestingly, the oscillation amplitude and period remain almost constant in stage III. This result is contrary to that reported by Parkhutik and Beranek.Reference Beranek, Hildebrand and Schmuki36, Reference Parkhutik38
Current curves recorded during potentiostatic anodization for samples B5, C1, C2, and A1 under different anodic conditions.

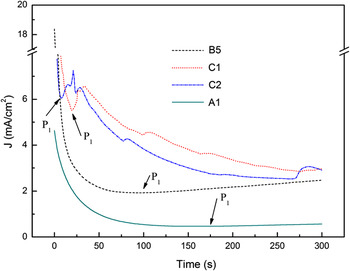
In order to further investigate stages I and II, the current curves for the initial 300 s anodic duration were replotted, as shown in Fig. 3, in which stage II of samples C1 and C2 can be clearly seen. The current curves were found to reach a minimum value at 9, 20, and 97 s for C2, C1, and B5, respectively, as indicated by P1s in Fig. 3. This fact indicates that the higher the anodic voltage, the longer time needed for the initial oxide layer formation. For A1, the stage I duration is 171 s, whereas in B5, a shorter initial oxide layer formation time due to the solution containing more water can be found. Tao and coworkers studied the first current–time stage and concluded that the first stage current decreased exponentially.Reference Tao, Zhao, Tang, Kang and Li35 In our work, nonlinear fitting results reveal that the ln (I)–t response (before P1) of C1 and C2 is in agreement with that reported in Tao et al.,Reference Tao, Zhao, Tang, Kang and Li35 but for A1 and B5, the curve does not obey the behavior of exponential decrease. Further study of this abnormal behavior will be the issue of our next work.
Current curves for the samples in the initial 300 s onset of anodization.

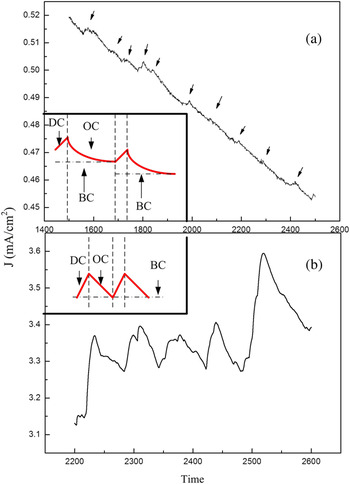
Figures 4(a) and 4(b) show the multiplied curves taken from the current data of samples A1 and B5 in stage III. As the arrows identified in Fig. 4(a) indicate, the periodical current fluctuation can be observed (similar current curves were observed in A2 and A3), indicating the alternative creation of and dissolution of the oxide layers. The insets illustrate the schematic periodical current curves of the samples prepared in different electrolytes. In one period, the oxidation current (OC) and dissolution current (DC) correspond to the formation and dissolution of a layer, respectively. Where the electrolyte is more concentrated, the DC amplitude is smaller (10−3 mA) and the corresponding time is relatively shorter than the OC duration within a period. But where the electrolyte is more dilute, the DC amplitude is remarkably stronger (10−1 mA). The base current (BC) of the sample A1 decreases with the time while that of sample B5 almost keeps steady.
Current curve sections of samples (a) A1 and (b) B5. Insets show the corresponding schematic periodical current curves including the dissolution current (DC), oxidation current (OC), and base current (BC) in a period.

B. Morphology
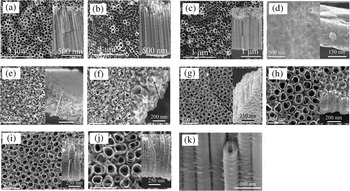
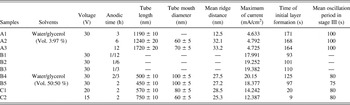
Figure 5 shows the SEM top and side views of all samples. Tube morphological parameters (length, diameter, and mean ridge space) detected from SEM images and some critical current data are listed in Table I. In Fig. 5(a), the initial oxide layers of A1 remain. Protected by the initial oxide layer, sample A1 shows a high tube growth rate of 397 nm/h. The tube growth rate of A2 and A3 is less than that of A1. In Figs. 5(d) and 5(e), samples B1 and B2, anodized for 5 and 10 min, respectively, are in the tube growth stages of pit and pore formation. Sample B3, anodized for 20 min, shows tube formation but the tubes are not separated completely, as can be seen in Fig. 5(f). Compared with B4, B5, C1, and C2, samples A2 and A3, prepared in a more concentrated electrolyte solution, show the rougher surface (rugged tube mouths) and straighter nanotubes. This may be ascribed to the fact that the slower chemical dissolution rate of the anodic reaction leads to the predominant formation of straight-line nanotubes in the more stable sites, resulting in a rough surface morphology, as compared with that of the nanotubes produced by the fast chemical dissolution process which brings about the formation of a uniform surface morphology because there is insufficient time for the nanotubes to search for more stable sites.Reference Abdesselem, Aida, Attaf and Ouahab39 The ridges, as reported by Parkhutik and Beranek,Reference Beranek, Hildebrand and Schmuki36, Reference Parkhutik38 were caused by the periodic current oscillation; and the distance between the ridges on the side wall can be estimated based on the amount of time from the current–time curves. As can be seen in Table I, the mean ridge number along a side wall of sample A1 whose initial oxide layer is still extant is in agreement with the current oscillation period. But in other samples, the mean ridge number is less than the current oscillation period number and this may be due to the chemical dissolution of the ridges by the electrolyte which flowed into the interstices among the tubes after the disappearance of the initial oxide layer. More information can be detected from the SEM images, for example, Fig. 5(k) shows almost the same size of the inner tube diameter as the tube wall thickness in the middle of a tube, indicating that the tube diameter is decreasing and tube wall thickness is increasing from the tube mouth to the bottom (sample A3). This reduction in pore size could also be due to accumulation of anodization debris. From Table I, it can also be seen that the maximum of current, the time of initial layer formation, and the mean oscillation period in stage III exhibit a close relationship with the voltage and the water content in the electrolyte.
(a)–(j) SEM top views (insets show cross-sectional views) of samples A1, A2, A3, B1, B2, B3, B4, B5, C1, and C2, respectively; (k) multiplied image of a tube section of A3.

Tube morphological parameters, some critical current data and corresponding anodic conditions.

C. Growth mechanism
In the first stage of current curve which shows the sharp slope (the first oxidation current), the initial oxide layer is formed (stage I). The reaction is described by Eq. (1).

The compact initial oxide layer hinders ion movement, thus only a few O2– ions can penetrate the oxide layer from electrolyte to the oxide/metal interface; and also few Ti4+ ions move through the oxide layer in the reverse direction. At this moment, as shown in Fig. 4, the current is called the base current (BC). This rough layer maintains a high potential due to its high resistance, thus some randomly distributed breakdown takes place. The enrichment of F– ions at the breakdown points leads to the fast chemical dissolution of TiO2 at these locations, as described by Eq. (2).

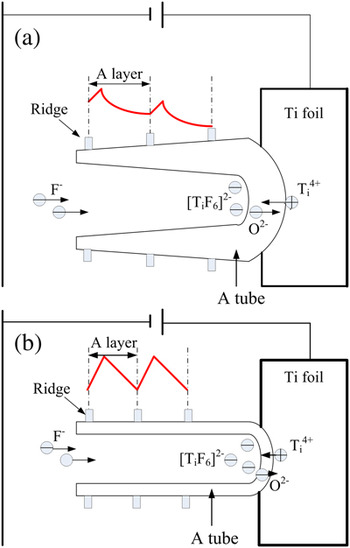
The current (dissolution current DC) increases for the first time (stage II). The expansion of the breakdown points results in the formation of pits that act as pore forming centers, as shown in Fig. 5(d). As the pit size increases, the electrolyte has a chance to infiltrate into the interface of the oxide layer/metal and a second oxide layer is formed and then broken down again by the electric field. The current displays a decrease stage (OC) and an increase stage (DC) for the second time. Thereafter, the oxide is formed and broken down layer by layer and the current curve exhibits oscillation correspondingly. Figure 6 shows a schematic diagram of the tube growth and the species movement in stage III. Within a current oscillation period, OC is responsible for the formation of a layer and DC for the breakdown of the layer. The longitudinal continuous breakdown sites of the layers are connected to form a pore. As the pores become deeper, the electric field in the protruded un-anodized metallic portions between the pores increases, enhancing the field-assisted oxide growth and oxide dissolution. Therefore, well-defined inter-pore voids start forming simultaneously with the pores themselves.Reference Mor, Varghese, Paulose, Shankar and Grimes34 Pore separation subsequently takes place layer by layer. Therefore, some oxide between adjacent layers would remain, and this explains the formation of the ridges.
Schematic diagrams of the tube growth and ions moving for the samples prepared in (a) mixed electrolyte containing DI water and glycerol (volume ratio 3:97%) and 0.175 M NH4F, and (b) mixed electrolyte containing DI water and glycerol (volume ratio 50:50%) and 0.175 M NH4F.

Further analysis of the current curves can also be conducted from Fig. 6. Directional movement of anions and cations under electric field leads to the formation and dissolution of the oxide layer which, in turn, influences ion diffusion. BC relies on the O2– and Ti4+ ion migration through the barrier layer. In the more concentrated electrolyte, BC in stage III is smaller due to the lower carrier concentration. Furthermore, the inner tube diameter decreases with tube growth (as shown in the SEM images of sample A3), leading to more difficult ion diffusion and a decrease of BC, as can be seen in Fig. 6(a). But for the samples prepared in more water containing electrolytes, in Fig. 6(b), there is a higher carrier concentration and no decrease in tube inner diameter (which can also be seen in the SEM image for sample C1), a high and steady BC is obtained in stage III.
IV. CONCLUSIONS
In this study, several samples were anodized in solutions containing 0.175 M NH4F composed of mixtures with different volume ratios of DI water and glycerol (50:50%; 3:97%). By analyzing the current curves and SEM images, nanotube growth processes were discussed and the influence of water content and voltage on the tube morphology and current transient were also investigated. It has been found the more water in electrolyte or the lower anodic voltage, the shorter time of the first current sharp duration (stage I). In stage III, the current oscillation amplitude, period, and BC show a close relationship with water content in the electrolytes. Based on the results of the current data and the SEM images, a growth mechanism of the nanotubes was put forward. It is assumed that the oxide moves inward on the Ti substrate layer by layer and the pore is formed due to the longitudinal connection of continuous breakdown sites. In this layer-by-layer model, the presence of the ridges is also explained explicitly. This study may shed light on the precise modification of the nanotube morphology under different anodic conditions, which is helpful for the design of nanoarchitectures in related material systems.
ACKNOWLEDGMENTS
This project was supported by the National Natural Science Foundation of China (50872001), the Research Fund for the Doctoral Program of Higher Education of China (20060357003), the Higher Educational Natural Science Foundation of Anhui Province, China (KJ2008B015, KJ2010A123), the Open Foundation of Anhui Key Laboratory of Information Materials and Devices, China, Key Project of Anhui Province, China (05021028), the Talent Foundation of Anhui Province, China (2004Z029), and the Talent Development Foundation of Anhui University, Anhui Province, China.