I. INTRODUCTION
Fluorides doped with rare-earth (RE) ions have garnered extensive research attention due to their potential applications in optical telecommunication, lasers, optoelectronic devices, diagnostics, and biological labels.Reference Johnson and Guggenheim1–Reference Wang, Peng and Li12 In comparison with oxygen-based systems, fluorides have an advantage as a fluorescent host matrix owing to their low phonon energies and the resulting minimization of the quenching of the excited state of the RE ions.Reference Wang, Qin, Xu, Wang, Wei, Zhu and Kim13, Reference Li, Yang, Yang, Lian and Lin14 In particular, KMgF3 was an ideal host lattice for RE ions because not only KMgF3 has good homogeneous optics, high thermal stability, low melting point, anisotropy, and high optical transparency, but also KMgF3 could stabilize low-valence RE ions, which could be used to further refine spectral structure of these RE ions. For example, Eu2+ ion in KMgF3 single crystals can substitute K+ ion and exhibits an intense blue fluorescence, which is assigned to the d–f transition within Eu2+ electronic configuration.Reference Francini, Grassano, Tomini, Boiko, Tarasov and Scacco15, Reference Hua, Jia and Shi16 Pure and doped KMgF3 single crystals have been studied extensively by Shi et al.Reference Seo, Moon and Tsuboi17–Reference Darabont, Neamţu, Fărcaş and Borodi19
Recently, a great deal of research effort has been devoted to the synthesis of RE-doped nanocrystals.Reference Yan and Li20–Reference Li, Quan, Yang, Yang, Lian and Lin24 Nanosized phosphors or optoelectronic devices usually exhibit novel capabilities, such as high efficiencies, tunable wavelengths, and rapid responsibilities,Reference Yang, Li, Cheng, Zhang, Quan, Zhang and Lin25–Reference Wang, Huang, Zhong, Chen, Xue and You31 resulting from the quantum effects and a high surface-to-volume ratio compared to their bulk counterparts. Herein, we successfully prepared perovskite KMgF3:Eu nanocubes with a mean edge length of ∼12 nm according to our reported liquid–solid–solution (LSS) strategy.Reference Wang, Peng and Li12, Reference Wang, Zhuang, Peng and Li32 The photoluminescence properties were studied in detail.
II. EXPERIMENTAL
In a typical synthesis, 4 mL of KF aqueous solution (0.5 mol/L) and 1 mL of chlorate (MgCl2 and EuCl3) aqueous solution (0.5 mol/L) were added to a mixture of NaOH (1.2 g), ethanol (8 mL), deionized water (4 mL), and oleic acid (20 mL), and the solution was thoroughly stirred. Subsequently, the milky colloidal solution was transferred to a 50 mL Teflon-lined autoclave and heated at 160 °C for 24 h. The systems were then allowed to cool to room temperature. The final products were collected by means of centrifugation, washed with ethanol, and finally dried in vacuum at 80 °C for 4 h. For comparison, the corresponding bulk sample with the same components was prepared by sintering stoichiometric mixture of KF (99.99%), MgF2 (99.99%), and EuF3 (99.99%) at 700 °C for 6 h in an inert atmosphere.
The crystal structure was analyzed by a Rigaku (Tokyo, Japan) D/MAX-rA x-ray diffractionmeter equipped with graphite monochromatized Cu Kα radiation (γ = 1.541874 Å). The size and morphology of the final products were characterized with a transmission electron microscope (TEM, JEOL-2010, Tokyo, Japan) operated at 200 kV. The luminescence spectra were recorded with a Hitachi F-4500 fluorescence spectrophotometer (Hitachi, Tokyo, Japan) at room temperature. For comparison of the luminescence properties of different samples, the luminescence spectra were measured with the same instrument parameters [2.5 nm for spectral resolution (Full-Width Half-Maximum) of the spectrophotometer and 400 V for PMT voltage] at room temperature.
III. RESULTS AND DISCUSSION
A. XRD and TEM measurements
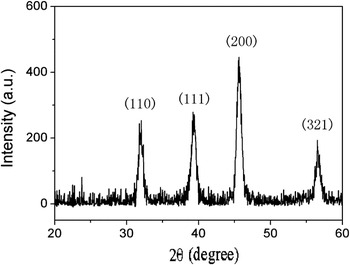
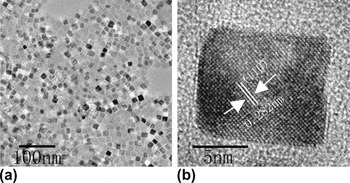
The crystal structure and particle size were obtained by x-ray diffraction (XRD) pattern, as shown in Fig. 1. All the diffraction peaks can be easily indexed to a pure perovskite KMgF3 (JCPDS 75-0307). No other impurity peaks were detected. The morphologies of the final product were characterized with a TEM (JEOL-2010) operated at 200 kV, as shown in Fig. 2(a). The as-obtained KMgF3:Eu nanocrystals are monodisperse and exhibit square-like sheet morphology with a mean edge length of ∼12 nm. The high-resolution TEM (HRTEM) image of a single nanoparticle further confirms the XRD measurement, as shown in Fig. 2(b). The measured lattice spacing is about 0.282 nm, corresponding to the distance of {110} planes of the perovskite KMgF3. This image also reveals the single-crystal nature.
X-ray diffraction pattern of KMgF3:Eu nanocubes.

(a) Transmission electron microscope (TEM) and (b) high-resolution TEM images of KMgF3:Eu nanocubes.

B. Photoluminescence of KMgF3:Eu nanocubes
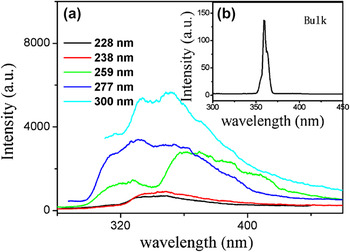
Figure 3 shows the emission spectra of KMgF3:Eu nanocubes under 228, 238, 259, 277, and 300 nm excitation, which result from the absorption of the trace oxygen and color centers of KMgF3 matrix.Reference Riley and Sibley33 When the excitation wavelength is 228 or 238 nm, there is a maximum broad band centered at 348 nm. When the excitation wavelength is 259 nm, there are two broad band peaks centered at 322 and 359 nm. When the excitation wavelength is 277 nm, there is a maximum broad band centered at 332 nm. When the excitation wavelength is 300 nm, besides the broad band peak at 332 nm, there is a broad band peak at 351 nm. On the basis of the previous report on Eu in KMgF3:Eu single crystals, the 6P7/2 → 8S7/2 transition of Eu2+ should be observed.Reference Seo, Moon and Tsuboi17 This transition is a sharp peak emission located at ∼360 nm. However, no sharp peak emission located at ∼360 nm was observed in the emission spectra of KMgF3:Eu nanocubes, which can be attributed to the overlappment of the emissions of Eu2+ and color centers.Reference Riley and Sibley33 Perhaps, the emissions from the organic surfactants also exist. For comparison, the Eu2+ emission of bulk KMgF3:Eu is shown in Fig. 3(b).
(a) Emission spectra of the trace oxygen and color centers in KMgF3:Eu under different excitation wavelengths. (b) Emission spectrum of bulk KMgF3:Eu under 247 nm excitation.

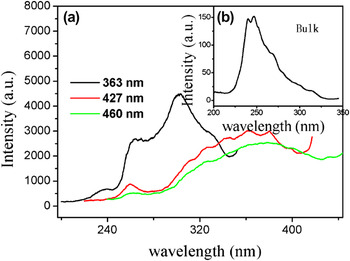
Figure 4 shows the excitation spectra of KMgF3:Eu nanocubes monitored at different emission wavelength. When the emission wavelength is 363 nm, there are three broad band peaks centered at 238, 259, and 300 nm. When the emission wavelength is 427 or 460 nm, besides the broad band peak at 362 nm, there is a broad band peak at 259 nm. The excitation spectrum of bulk KMgF3:Eu is shown in Fig. 4(b).
(a) Excitation spectra of the trace oxygen and color centers in KMgF3:Eu nanocubes monitored at different emission wavelengths. (b) Excitation spectrum of bulk KMgF3:Eu monitored at 360 nm.

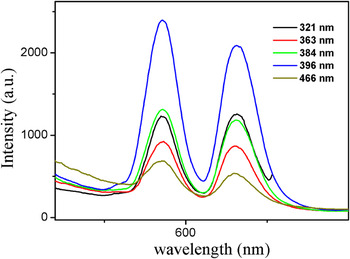
Figure 5 shows the emission spectra of KMgF3:Eu nanocubes under 321, 363, 384, 396, and 466 nm excitation, which correspond to the 7F0 → 5H4, 7F0 → 5D4, 7F0 → 5G2, 7F0 → 5L6, and 7F0 → 5D2 transitions of Eu3+, respectively. The results demonstrate the existence of Eu3+ ions in the sample. The emission peaks located in the 575–630 nm range can be attributed to the 5D0 → 7F1 and 5D0 → 7F2, which are typical magnetic and electric dipole–dipole transitions of Eu3+, respectively. In a site with inversion symmetry, the 5D0 → 7F1 is dominating, while in a site without inversion symmetry, the 5D0 → 7F2 is the strongest. Therefore, the intensity ratio of 5D0 → 7F2 to 5D0 → 7F1 is strongly dependent on the local symmetry of the Eu3+ ions. By comparing the emission intensities of the 5D0 → 7F1 with those of the 5D0 → 7F2 in Fig. 5, it is found that the intensity ratio of 5D0 → 7F2 to 5D0 → 7F1 changed with excitation wavelength, indicating that the material has multiple luminescence centers or emitting states.Reference Wang and Peng34
Emission spectra of Eu3+ ions in KMgF3 nanocubes under different excitation wavelengths.

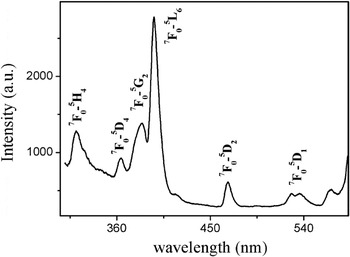
Figure 6 shows the excitation (monitored at 592 nm) spectra of KMgF3:Eu nanocubes, which consist of the characteristic excitation lines of Eu3+. These excitation lines can be clearly assigned: 7F0 → 5H4 (∼321 nm), 7F0 → 5D4 (∼363 nm), 7F0 → 5G2 (∼384 nm), 7F0 → 5L6 (∼396 nm), 7F0 → 5D2 (∼466 nm), 7F0 → 5D1 (∼537 nm), and 7F0 → 5D0 (∼565 nm).
Excitation spectra of Eu3+ ions in KMgF3 nanocubes monitored at 592 nm.

IV. CONCLUSION
KMgF3:Eu nanocubes with a mean edge length of ∼12 nm were synthesized by the LSS process. XRD analysis shows that the nanocubes are perovskite phase. The broad emission bands of trace oxygen and color centers in KMgF3 matrix were observed under ultraviolet excitation. The spectral configurations of them changed with excitation wavelength. In comparison with a bulk sample having the same chemical compositions, no characteristic emissions of Eu2+ were observed, which were attributed to the overlappment of the emissions of Eu2+ and color centers. In addition to the aforementioned emissions of trace oxygen and color centers, the emissions of Eu3+ were also observed, indicating the existence of Eu3+ ions in the sample. The intensity ratio of 5D0 → 7F2 to 5D0 → 7F1 changed with excitation wavelength, indicating that the material has multiple luminescence centers or emitting states.
ACKNOWLEDGMENTS
This work was supported by the National Natural Science Foundation of China (10979032 and 21001042) and the Program for New Century Excellent Talents in University.