

1. Introduction
Until the early 2000s, studies of Taiwan's welfare regime have mostly been optimistic about its evolution and direction (Peng, Reference Peng and Gakkai2001). One of the most convincing arguments was that democratization and political competition had altered the nature of the welfare state. This, in turn, made it possible for advocates, experts, and politicians to form a cross-class coalition in Taiwan to resist the pressure of globalization and pursue welfare entrenchment, rather than retrenchment (Wong, Reference Wong2006). Taiwan and the East Asian welfare model was lauded as a success and provided ‘developed countries of the West with a commanding example of how to square the welfare circle’ (Aspalter, Reference Aspalter2006: 300).
The thesis that democratic deepening can lead to welfare entrenchment is persuasive, but it tends to overlook that welfare programs are often costly; therefore, generating debates concerning taxation and distribution. Taiwan's compacted developmental experiences combined with an extremely rapid process of aging accentuates the importance to examine the relationship between taxation and welfare regime since the processes of welfare entrenchment and retrenchment basically overlap.
Understanding the policy legacy that shaped the structure of Taiwan's tax revenue and its ensuing impact on taxation reform and taxation capacity is critical in finding answers to explain the makings of welfare programs because welfare initiatives cost money. Yet, Taiwan has experienced recurrent fiscal deficits since the early 1990s, thereby facing the difficult challenge of expanding welfare provisions while at the same time minimizing the accumulation of debt.
This paper begins with an analysis of the characteristics of Taiwan's welfare expenditure and illustrates that the provisions of long-term care (LTC) remain limited due to difficulties in securing fiscal resources, even though welfare expenditure has become the largest item in the national budget. Second, it examines how Taiwan's taxation policy, a result of the institutional legacy of the developmental state, has brought the erosion of Taiwan's tax base and hindered welfare reforms. Finally, the paper explores the political determinants that shape Taiwan's taxation policy – hence the characteristic of welfare regime in Taiwan.
In short, this paper argues that the trajectory of Taiwan's welfare regime is, in fact, determined by the state's taxation capacity. While democratic competition does create incentives to expand public provision of welfare, the design and realization of these policies inevitably depend on whether the state has the capability to raise the needed revenues through taxation policies. Taxation, and especially its fairness implications, is a subject of an on-going debate in Taiwan. However, its effect on Taiwan's welfare regime has remained unscrutinized in the academic literature. This overlooks an issue of importance to understanding Taiwan's welfare regime. Only by contextualizing Taiwan's taxation politics from a comparative perspective, as this paper proposes, we can begin to form a more dynamic picture of Taiwan's welfare regime.
2. Familialistic welfare regime in Taiwan
Much like in Japan, South Korea, and some Mediterranean countries, Taiwan's families, which, in most cases, means women, are expected to shoulder much of the responsibilities for care (children and the elderly) and management of various risks (old-age income security and health). This is termed the familialistic welfare regime, which differs from the so-called conservative welfare regime providing more generous public assistance, child support policies, and unemployment benefitsFootnote 1 (Miyamoto et al., Reference Miyamoto, Peng, Uzuhashi and Esping-Anderson2003; Shinkawa, Reference Shinkawa and Shinkawa2011).
Despite being one of the newly industrialized countries which often has a younger demographic structure, Taiwan is one of the fastest aging society in the world. This has posed new challenges for Taiwan's welfare regime. According to a poll conducted in 2015 by the Democratic Progressive Party (DPP, 2015), LTC of the elderly was the third greatest worry (9%) and the second most unsatisfactory policy area (52.9%) for mothers over 20-years old. Although the idea of implementing LTC insurance (LTCI) emerged as far back as 2000, and had become a major presidential electoral promise by 2008, the public provision of LTC remains limited, and no concrete plans for introducing LTCI are in contemplation at the time of writing.Footnote 2
Consequently, according to the Ministry of Health and Welfare (MOHW), 54.9% of those needing LTC are cared for by family members, and more than 30% of those family members involved in LTC feel unable to continue bearing this burden (MOHW, 2015: 7). This means, despite the democratic deepening and three changes of government since the 1990s, Taiwan's welfare regime has not effectively addressed the rapidly rising needs of its aging society. It, then, naturally begs the question of why democratic consolidation has not resulted in furthering welfare entrenchment in Taiwan, contrary to the contentions of previous studies.
LTC policies are relevant to understanding how the characteristics of a familialistic welfare regime persist or transform, and how taxation affects the welfare regime, for two reasons. First, such policies as expanding the public provision of LTC, resulting from societal pressure, can either weaken or strengthen the family's role. If LTC services are socialized, women are freer to participate in the labor market and, hence, less dependent on families for income. Alternatively, women continue to provide LTC with assistance from government programs or migrant care-workers, as in the case of Taiwan. In other words, evolving welfare policies, such as those on LTC, can result in either defamilialization or re-familialization.
Second, to expand the public provision of LTC, the government must either find new fiscal resources (by raising taxes) or reallocate existing resources by reducing spending on other welfare programs. As will be discussed below, securing fiscal resources for the public provision of LTC, including the use of taxation, has dominated discussion of LTC in Taiwan. Hence, examining LTC policy efforts is an ideal approach to build an understanding of how taxation affects Taiwan's welfare regime.
2.1 Aging Taiwan
Taiwan is a rapidly aging society. While the percentage of those aged 65 or older, the elder population, is comparatively low, the speed of aging is unprecedented, even internationally.
In the 1990s, Taiwan's total fertility rate hovered at around 1.70. The obvious decline began in the early 2000s. In 2001, the rate dropped to 1.40, before plummeting to 0.90 in 2010, recording the lowest figure for that year worldwide (National Statistics R.O.C., 2016). The impact on the population is manifestly evident: the elder population increased from 7% in 1997 to 12% in 2014, and has exceeded 14% in 2017, making Taiwan a so-called aged society. Though still relatively low compared to that of the Organization for Economic Co-operation and Development (OECD) countries, it is the speed of aging that impacts noticeably on Taiwanese society.
In 2012, Taiwan's Council of Economic Planning and Development (CEPD) forecasted that the elder population would double (from 7 to 14%) in 24 years (from 1993 to 2017), and likely surpass 20% after a further 8 years, thus becoming a super-aged society (CEPD, 2012: 62). A similar speed can only be observed in South Korea, Japan, and the city-state of Singapore. If this trend continues, it is estimated that Taiwan will surpass Japan in around 2050–2060 to become the world's oldest society.
2.2 Long-term care and long-term care insurance
It is against this backdrop that the needs for LTC came to the attention of Taiwanese society. Newspapers and magazines began to run stories of ‘care-tragedies,’ in which care providers, often family members, and care recipients both faced dire conditions in the early 2000s. Some resulted in tragic deaths or suicides.
In 2007, the government responded to such rising needs by rolling out a major initiative called the Ten-Year Plan for LTC, intended to improve the entire LTC-related system. The government earmarked 81.7 billion NT dollars for the next 10 years to achieve the objectives of improving the accessibility of LTC, by creating community-based care services, and strengthening training services for care-professionals. This would be followed within ten years by an LTC Service Act, to ensure the quality of care and support services, and the implementation of LTCI as the last phase (Ministry of Interior, 2012).
The substance of the Ten-Year Plan was mostly unaffected by the power transition to the Nationalist Party (KMT) in 2008. Though implementing LTCI within 4 years was prioritized, since this was an electoral promise of President Ma Ying-jeou, this has yet to be realized. However, the LTC Service Act was eventually enacted in May 2015. Deliberations over the LTC Service Act lasted more than 7 years, spanning over two terms of the Legislative Yuan (LY). While there were debates on various aspects of LTC provision, the most heated one concerned how it should be financed (Huang and Deng, Reference Huang and Deng2015). After lengthy discussions, the LY eventually settled on creating a 12 billion NT dollar LTC fund, to be accumulated within 5 years. Article 14 of the LTC Service Act specifically stipulates that programs will be funded by government budget, cigarette contributions (indirect taxation on cigarette consumption), donations, interest accrued from the LTC service fund, and other income. Many advocacy groups criticized the new legislation as being too little, too late, and nothing more than ‘guidance for managing care institutions’ (Lu, Reference Lu2015).
Much like the LTC Service Act, the main impediment to the process of establishing LTCI has been fiscal concerns. According to the draft submitted by MOHW, modeled upon all the social insurances in Taiwan, such as National Health Insurance and Labor Insurance, the government would contribute up to 40% of the premium (1.19% of insured salary), while the employer and employee would each contribute 30%. This would require at least 40 billion NT dollars annually from the government (MOHW, 2015). The last draft submitted to the LY planned to secure this through raising the cigarette contribution by 20 NT dollars per pack and partial revenues from the newly launched integrated housing and land tax.Footnote 3 In reality, however, the forecasted cigarette contribution (0.9 billion) and integrated housing and land tax (2.6 billion) amounted to only 3.5 billion NT dollars for 2016. Thus, without reducing other expenditures or creating new tax revenues, LTCI can only be financed through debts.Footnote 4
After 8 years of extensive debate, the LTCI bill was deferred as the DPP returned to power in May 2016. The DPP government's priority is to improve the existing LTC service capacity, to avoid the overt profit-seeking behavior of private LTC providers, before actually implementing LTCI. The DPP's policy is to finance the so-called LTC 2.0, a continuation and upgraded version of the Ten-Year Plan, through a 10% hike in inheritance tax (Apple Daily, 2016).
Meanwhile, after 6 years of implementing the Ten-Year Plan under the KMT government, the results were far from impressive. According to various estimates calculated from MOHW data in 2014, of those elders in need of LTC, only 12% utilized some form of publicly provided LTC, such as home-visiting care, senior daycare, and privately managed care institutions; the rest of the burden is entirely shouldered by family members (59%) and migrant care-workers (29%) (Yeh, Reference Yeh2015).
2.3 LTC, migrant care-workers, and re-familialization
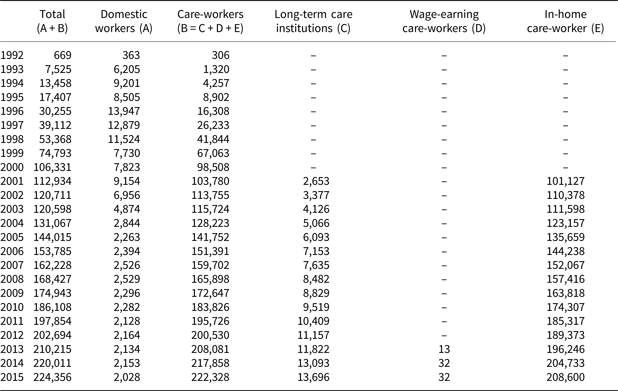
Since the deregulation of importing foreign labor in the early 1990s, migrant worker numbers have steadily risen in Taiwan. Employing migrant workers as domestic helpers has become a common practice in Taiwanese households. By the early 2000s, domestic helpers had evolved into LTC providers, and migrant care-workers had become the second most important care providers, after family members. While some work in LTC institutions, most migrant care-workers are in-home, which means that they live with the family that employs them. From 2008 to 2015, the number of migrant care-workers increased by 134% (see Table 1).
Migrant welfare workers (by category, 1992–2015)

Source: Ministry of Labor, Taiwan, Labor Situations and Affairs Statistics, http://statdb.mol.gov.tw/statis/jspProxy.aspx?sys=100 [accessed 28 September 2016].
The majority of migrant care-workers come from Southeast Asian countries with very few exceptions. Indonesia has been the largest sending country since the late 1990s with the exceptions of 2004 and 2005 during which migrant care-workers from Vietnam surged and comprised more than 50%. Moreover, in 2000, 60% of migrant care-workers came from Indonesia, 33% from the Philippines, followed by Thailand and Vietnam. By 2017, Indonesia had become dominantly the largest sending country of migrant care-workers at 76%. Rest of the migrant care-workers came from the Philippines (12%) and Vietnam (11%) (Ministry of Labor, 2018).
The introduction of migrant workers, both industrial and care, was regarded as a temporary policy to supplement labor shortages, therefore, workers were forbidden to change their visa status and had to leave Taiwan after 3 years of stay when the system was first introduced (Lin, Reference Lin2014). However, as care-workers grew increasingly difficult to replace, the law was revised three times thereafter to extend the length of stay for care-workers to 12 years accumulatively by 2014. With the exception of marriages with Taiwanese citizens, which requires a lengthy and complicated process of acquiring a new visa, the policy remains that all migrant workers must return to sending countries as of 2018.
Nevertheless, through the combination of the lack of public LTC provision, society's rapidly rising needs and certain cultural factors, migrant care-workers have become the core of LTC in Taiwan (Lin, Reference Lin2016). Most importantly, migrant care-labor is almost ‘fiscal-free’ for the government, since family members bear the full costs, including health insurance premiums for the care-worker, thereby meeting a large proportion of national LTC needs.Footnote 5
Thus, relieving family members (mostly women) of family care obligations resulted neither from public support nor socializing care, but rather from introducing migrant care-workers into the labor market.Footnote 6 Defamilialization, with women relieved from care obligations and entering the labor market to become independent of household finances and secure personal income, was coupled with re-familialization in Taiwan.Footnote 7 The discussion of LTC and LTCI provide evidence that fiscal constraint was a major (though not the sole) factor in preserving Taiwan's familialistic welfare regime.
2.4 Welfare expenditure in Taiwan
As lack of resources caused attempts to broaden public LTC provision to be unsuccessful, the question arises of why, despite social welfare coming to occupy the largest share in government budgets, more fiscal sources cannot be allocated for LTC.
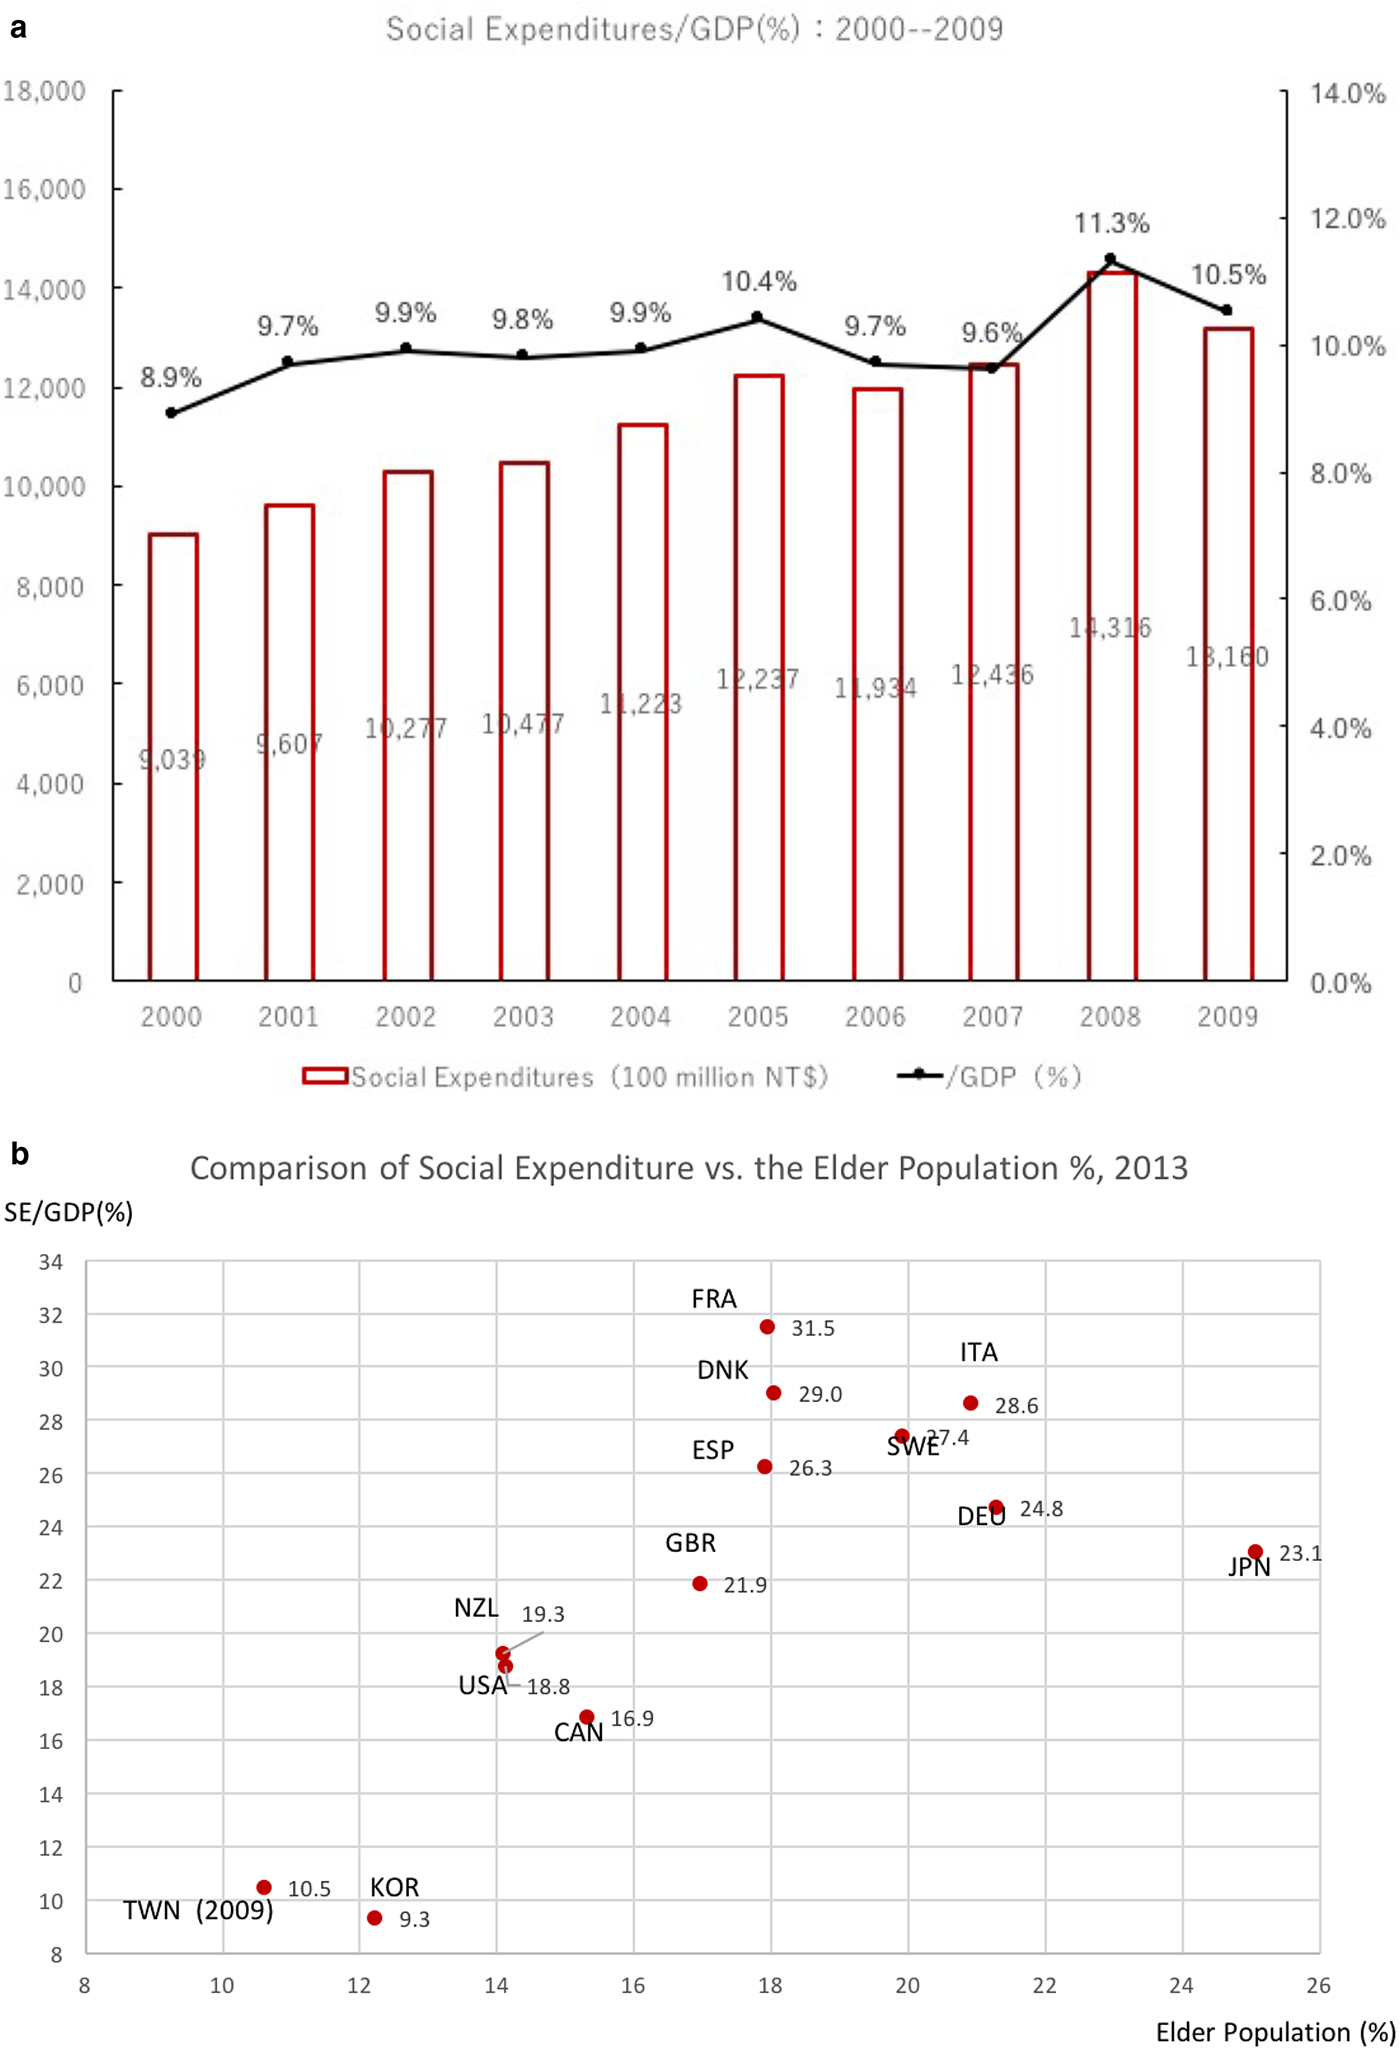
Taiwan's social expenditure as a percentage of gross domestic product (GDP), although it has been steadily increasing, remains relatively low (see Fig. 1a).Footnote 8 In comparison with countries often examined to represent different ‘worlds’ of welfare capitalism, Taiwan's social expenditure as a percentage of GDP is even lower than that of liberalist countries such as the USA (see Fig. 1b). Since the percentage of Taiwan's elder population, while growing fast, remains much lower than that of OECD countries, the country's relatively low level of social expenditure is not unexpected.
(a) Social Expenditure (OECD Standards) as % of GDP (2000–2009).
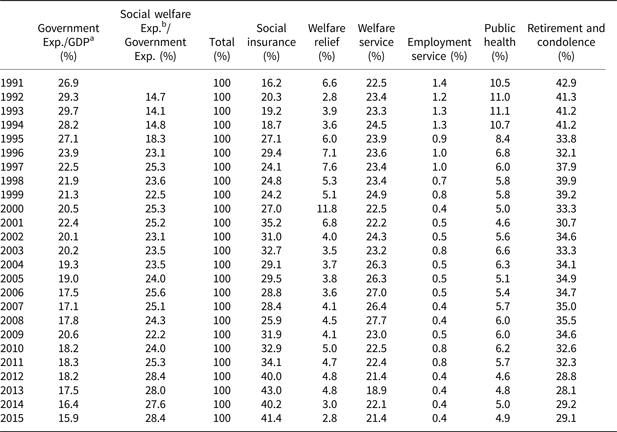
Nonetheless, discussions on the new LTC programs in Taiwan showed that, for the policy elites, how to finance these programs has always been the most important issue. One reason is that social welfare expenditure increased rapidly in the early 1990s, coming to occupy the largest share of government expenditure by 1996.Footnote 9 Its size increased further and, by 2015, accounted for 28% of total government expenditure.Footnote 10 The biggest elements of social welfare expenditure in Taiwan, however, are social insurance and ‘retirement and condolence’ (see Table 2), which together consume more than 70% of the social welfare budget, leaving limited resources for other elements, such as welfare serviced and public health, within which the current LTC-related programs are often included.Footnote 11
Social welfare expenditures (including retirement and condolence) as % of total government expenditures (1991–2015)

Notes:
a Government Expenditure/GDP: National Development Council (2016) Taiwan Statistical Data Book, http://www.ndc.gov.tw/en/News.aspx?n=607ED34345641980&sms=B8A915763E3684AC [accessed 15 December 2016].
b Social welfare expenditure in this table is the sum of ‘social welfare expenditure’ and ‘retirement and condolence’ in the Yearbook of Financial Statistics, ROC. ‘Social welfare expenditure’ within the Yearbook of Financial Statistics, ROC, includes social insurance, welfare relief, welfare service, employment service, and public health.
In other words, the various universal social insurance schemes and public employees’ retirement benefits have dominated social welfare spending, while shares of resources for other social welfare policies, such as public health, have either remained the same or decreased. Efforts to contain the costs of universal social insurances have not been successful, especially for the pension schemes. This situation could be exacerbated since funds for all three public pension schemes will be exhausted within the next 15 years without fundamental reforms (Lin, Reference Lin2016).
This explains why those involved in policy-making are very cost-conscious when discussing LTC, although it offers sure electoral gains for politicians and is, therefore, an ideal policy for credit-claiming. Expanding public LTC provision would require additional revenue. Without high levels of social consensus and trust that new or additional taxes will be well-spent on good policies, it is extremely difficult to execute the expansion of public LTC provision, especially when the more convenient option of migrant care-workers is readily available, albeit with associated costs.Footnote 12 Choosing the alternative of publicizing linkages between revenue, cigarette contributions, and inheritance tax, on the one hand, and LTC services, on the other, then became a way to simultaneously gain taxpayers’ trust and answer social needs. All these are results of the government's inability to broaden its tax base and, thereby, secure additional revenue.
3. Unfair taxation and welfare regime
From 1991 to 2015, Taiwanese government expenditure as a percentage of GDP fell from 26.9% to 15.9% (see Table 2). Over the span of just 30 years from the mid-1980s, government expenditure relative to GDP has halved. Discussions below will demonstrate that Taiwan not only failed to broaden its tax base: various tax deductions and exemptions implemented by the government have, in fact, narrowed the tax base.
3.1 Low tax-to-GDP ratio and rising debt
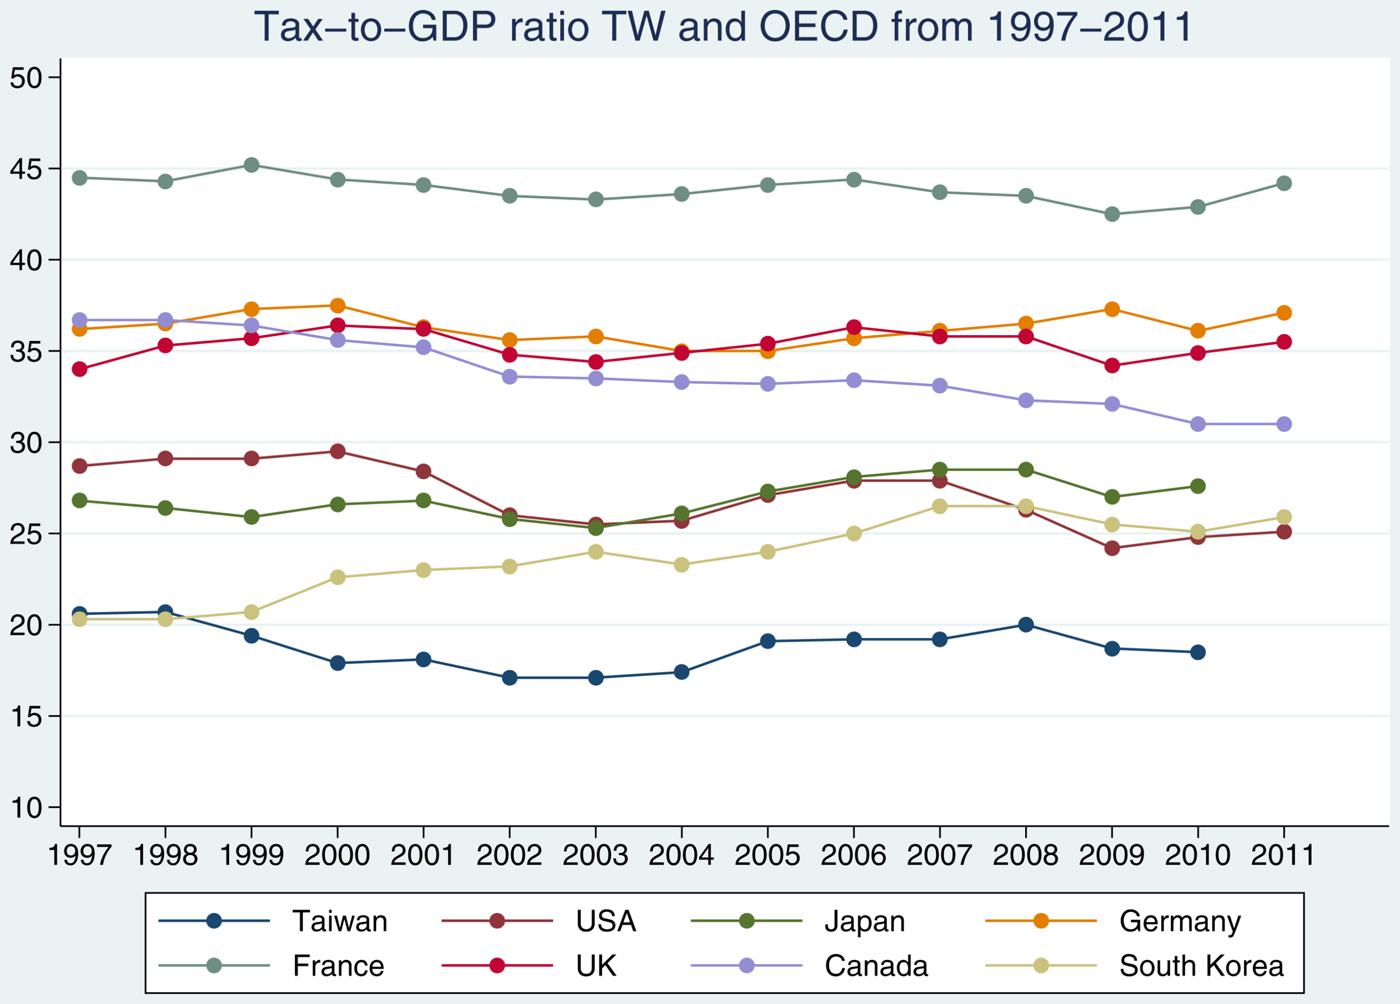
One of the first issues flagged by public finance experts when discussing Taiwan's taxation structure is its low tax-to-GDP ratio (see Fig. 2).Footnote 13 It is even low in comparison with that of South Korea, which exceeded 25% in 2010, compared with Taiwan's 18.5%. This inability to extract sufficient tax revenue to meet government expenditure has led to constant fiscal deficits. Except for 1998, fiscal deficits have become a permanent reality in Taiwan since the 1990s. As these deficits have mostly been financed through debts, by 2015, Taiwan's cumulative debt was equivalent to 36.6% of GDP. While this figure might seem reasonable compared with those of many industrialized democracies, it is often deployed as a powerful argument against welfare expansion in Taiwan. As attested by the above discussions in section I, fiscal concerns hindered the earlier realization of more comprehensive public LTC services.
Tax-to-GDP Ratio of Taiwan and Other Countries (1997–2011).

3.2. Structure of tax revenue
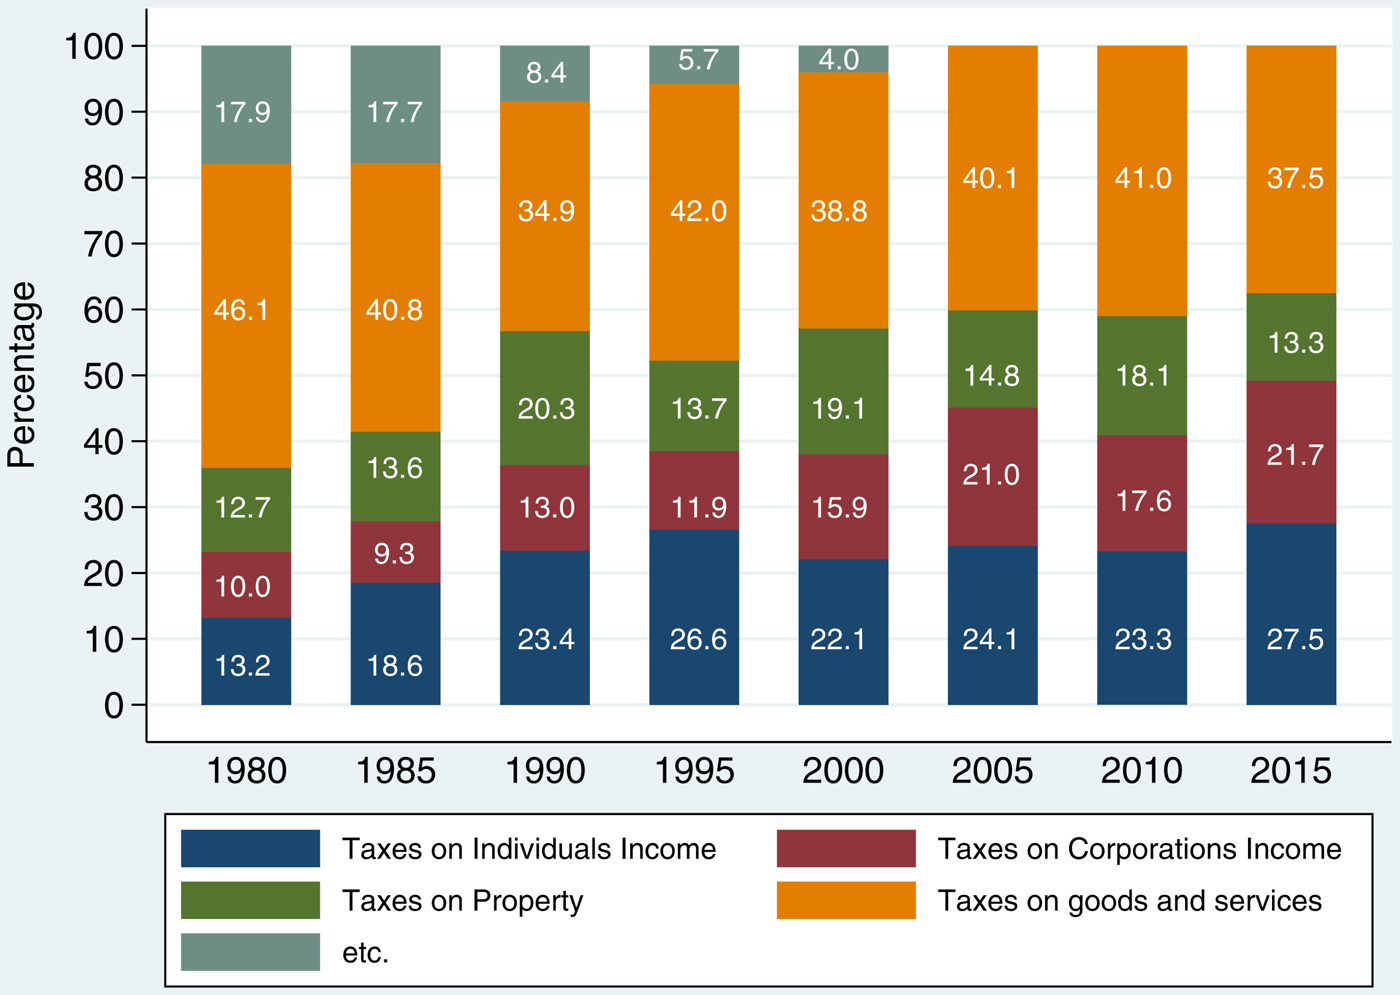
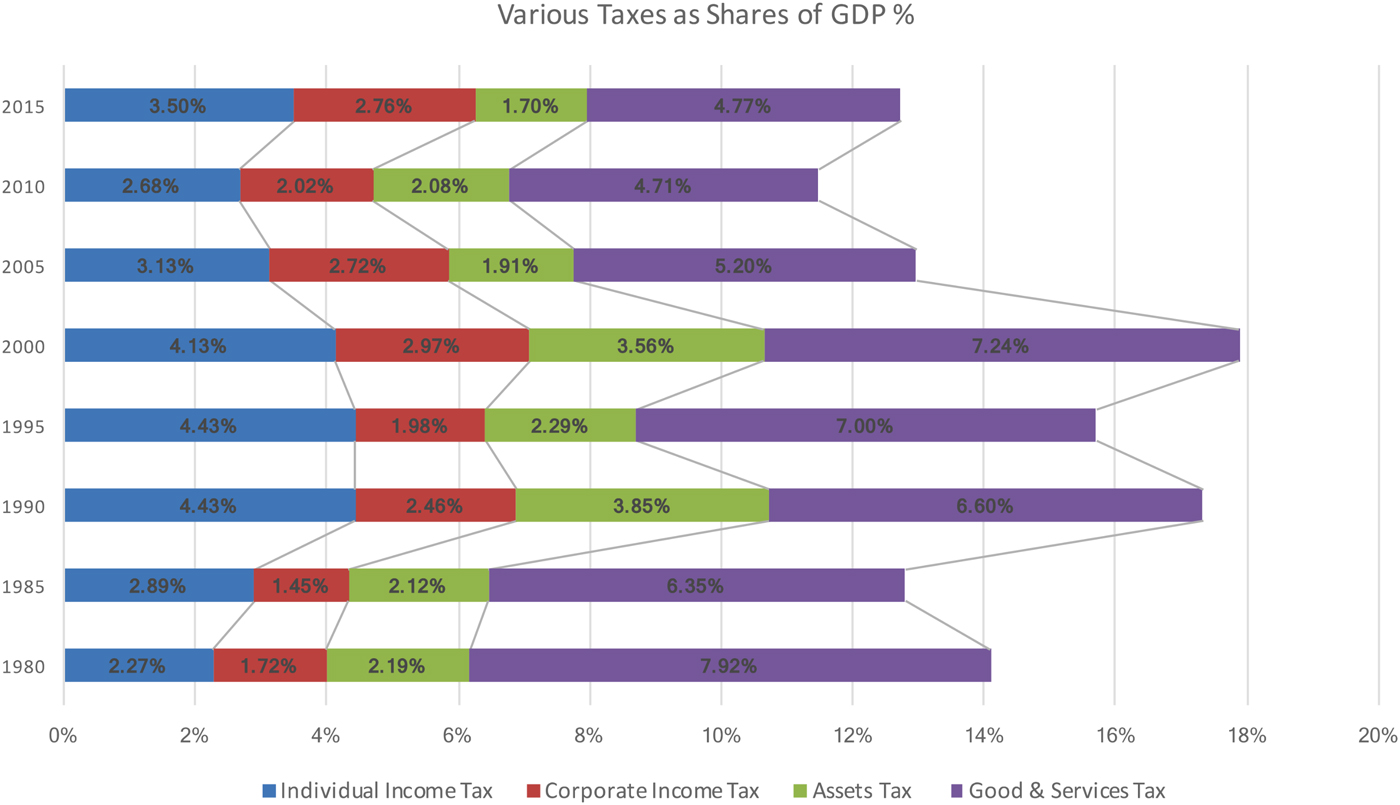
With the relative decline of aggregated tax revenue, Taiwan is slowly, but increasingly, coming to rely on individual income taxes (see Fig. 3). In this sense, Taiwan conforms with the argument that taxation competition generated by globalization leads to higher taxation of less mobile wage earners or consumers. Indeed, the top statutory income tax rate was raised from 40 to 45% in 2015. This would place Taiwan in the upper-middle range of OECD member countries, and is definitely much higher than in countries usually considered newly industrialized, such as South Korea, Hungary, Turkey, and Mexico. Another assumed the effect of globalization on taxation is that capital mobility asserts downward pressure on taxation of capital, corporate income, and wealthy individuals (Genschel, Reference Genschel2002). Taiwan also seems to fit this scenario, since the corporate income tax rate was lowered from 25 to 20% in 2010, and then from 20 to 17% in 2011. Given Taiwan's low level of taxes as a share of GDP, corporate tax revenue as a share of GDP is expectedly low. At 2.76% in 2015, this was higher in Taiwan than in the USA (2.2%), UK (2.5%), and Ireland (2.7%), but lower than in South Korea (3.2%) and Japan (4.3%).Footnote 14
Taxation Revenue Structure of Taiwan (1980–2015).
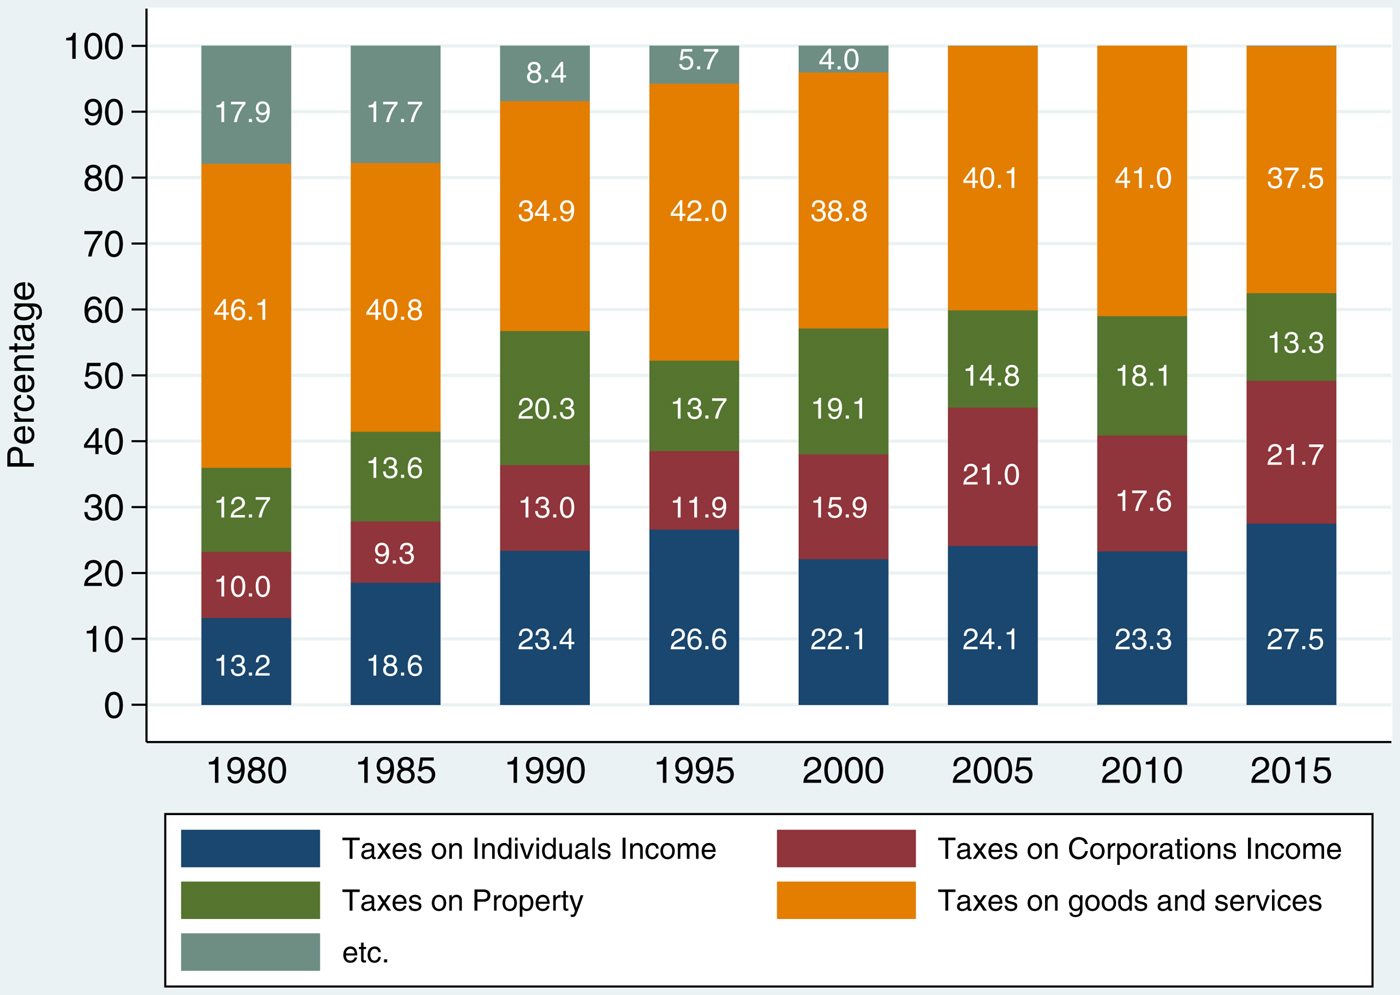
In contrast, as a proportion of total tax revenue, indirect taxes on goods and services have remained fairly constant. Under the Value-added and Non-value-added Business Tax Act enacted in 1986, the rate for ‘business tax,’ Taiwan's consumption tax, can be set at between 5% and 10%. This means that the business tax rate can be easily altered through executive order, without approval from the legislature, which often serves as the veto point for tax reforms. However, since the act's introduction in April 1986, no administration has dared to increase the rate. Taxes on goods and services as a share of GDP declined from 7% in 2000 to under 5% in 2010 and 2015 (see Fig. 4). This would be amongst the lowest if ranked against OECD countries: the five OECD members with the lowest values in 2015 were the USA (4.4), Switzerland (6.1), Japan (6.8), South Korea (7.1), and Canada (7.4).Footnote 15
Various Taxes as Shares of GDP* (%, 1980–2015).

Contrary to other new democracies’ growing reliance on goods and services taxes (see Kato and Toyofuku), Taiwan has not been able to use its value-added tax, the so-called business tax, to efficiently increase its revenues. On the other hand, while showing signs of increasing due to the raising of tax rates, income taxes, as a share of total tax revenue, have not achieved substantial growth to bolster overall tax receipts. The most important reason for Taiwan's failure to broaden its tax base has been its continuous favorable treatment of corporations and the wealthy.
3.3 Narrowing the income tax base through preferential treatment of corporations and the wealthy
Between 1988 and 2012, at least 20 tax deduction or exemption measures were implemented, ranging from lowering the Land Value Increment Tax (1989, 1997, 2002, and 2004) to exempting soybeans from consumption tax (2008) (Academia Sinica, 2014, 18).Footnote 16
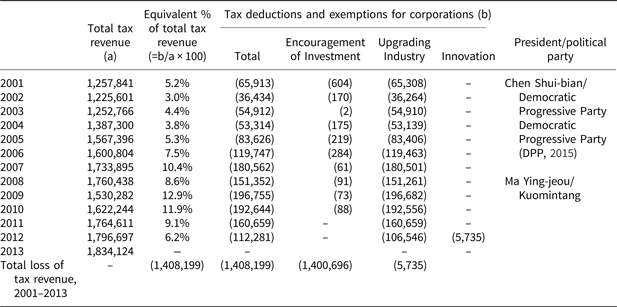
Aside from the ongoing avoidance of raising the consumption tax rate, one major cause of Taiwan's weak capacity to extract tax is the entrenched preference for corporate tax deductions/exemptions, considered one of the most important policy instruments for Taiwan's economic success. Beginning with the Statute for the Encouragement of Investment (1960), later replaced/supplemented by the Statute for Upgrading Industry (1990), Taiwan has provided tax holidays and reliefs for various industries. Eligibility for tax exemption and/or deduction has ranged from importing raw materials to augmenting equipment, such as office air-conditioning systems. Lower tax rate ceilings or exemption from consumption tax have also often been applied. For those who witnessed Taiwan's ascent to become part of the East Asian Miracle, the Statute for the Encouragement of Investment was considered ‘one of the most important economic reforms’ (Li, Reference Li1995: 83). At the outset, these statues did attract investment and promoted manufacturing exports; yet as the hyper-growth era was succeeded by the stagnation of the 2000s, they became subjects of heated, contentious debate. In some years, the tax deductions and exemptions for corporations, with the purpose of upgrading industry, were equivalent to more than 10% of Taiwan's total tax revenue (see Table 3).
Tax deductions and exemptions for corporations (2001–2013) (million NT$)

Source: Academia Sinica (2014: 17).
Note: aAside from these two major statutes, there are at least 18 other laws providing various kinds of tax deductions and exemptions for corporations. One can easily find this information on the relevant web pages of Taiwan's National Taxation Bureau. See web page of National Taxation Bureau of Taipei (https://www.ntbt.gov.tw/etwmain/front/ETW118W/CON/1815/4736005044563581113) for an example.
Although abolishing the Statute of Upgrading Industry had been discussed previously, the real push began in 2006 when President Chen Shui-bian convened the Conference on Sustaining Taiwan's Economic Development (CSTED). In total, 516 policy recommendations, including several measures to deregulate investment in mainland China, were drafted by the end of the 2-day meeting, but no consensus could be reached regarding the Statute of Upgrading Industry, which was scheduled to expire in 2010.
Throughout 2007, there were also heated discussions on how to phase out the Statute of Upgrading Industry. The DPP government proposed a package of direct subsidies and lowering the corporate tax rate to 17.5% in exchange for not renewing the statute. However, this proposal was never implemented because the DPP was soon voted out of power (Sato, Reference Sato and Wakabayashi2010: 183).
After coming into power in 2008, the KMT administration, led by President Ma Ying-jeou, delivered on their electoral promise by twice lowering the corporate income tax rate, first from 25 to 20%, and then from 20 to 17% (Liberty Times, 2010a, 2010b). It has been estimated that this enabled corporations to save up to 80 billion NT dollars annually (Lin et al., Reference Lin, Hong, Lee, Wang and Zhang2011: 88–91). Despite the lowering of corporate tax supposedly being a trade-off for not replacing the Statue of Upgrading Industry, the KMT government managed to enact the Statute for Industrial Innovation in May 2010, containing various corporate income tax deductions for research and development and for professional capacity building (Liberty Times, 2010a; 2010b). Thereby, the preferential tax treatment of corporations not only prevailed but was even strengthened.
While corporations undoubtedly benefited from significant tax savings, such preferential treatment inevitably exacerbated discontent towards the taxation system. Through financial records submitted by corporations to the Taiwan Stock Exchange, DPP legislator Lin Shu-fen found that for those with more than 10 billion NT dollars net-profit-after-tax, the average effective corporate income tax rates were extremely low: for nine corporations, the rate was below 10%. These examples are rather telling since the average effective corporate income tax rate is estimated to be around 11% (United Daily, 2016).
The impression of low taxes for the wealthy was not limited to corporations: it applied also to individuals. Taiwan's integrated income tax system, which allows tax deductions for capital gains when calculating income tax, is seen as symbolic of a policy favoring the rich. In 2011, the estimated deductible dividend income was approximately 100 billion NT dollars, which was equivalent to 30% of the individual income tax revenue of the same fiscal year (Academia Sinica, 2014: 34). It is, therefore, unsurprising that assets taxes as percentages of GDP have declined (Fig. 4). Another related development was the lowering of the inheritance tax rate. During the 2008 presidential electoral campaign, the candidates of both major parties advocated lowering the inheritance tax rate from 50% to 10% to bring capital and investment to Taiwan. This was also quickly realized in 2009 after President Ma assumed office.
3.4 Unfair taxation, social consent, and welfare
These series of tax measures favoring wealthy corporations and individuals in the last two decades generated deep public suspicions that Taiwan's taxation system was ‘unfair.’ In October 2007, the Coalition of Fair Tax for Taiwan (Gong-ping Shui-gai Lian-meng) was founded to coalesce 17 influential advocacy groups focusing on issues of labor, welfare, gender, poverty, youth, public health, and disabilities.Footnote 17 The coalition's members have been consistent in criticizing the tax system for imposing a disproportionate share of the burden on average Taiwanese taxpayers. Major targets of their criticism include the various tax incentives offered to corporations through legislation, such as the Statute of Upgrading Industries, and the integrated income tax system.Footnote 18
One outcome of such advocacy work was the publication of an influential book called The Collapsing Generation in 2011. Taiwan Labor Front, a labor advocacy group that had been very active since the 1980s and was also a member of the Coalition of Fair Tax for Taiwan, collaborated with academics critical of the neoliberalist ideology to author this highly influential book (Lin et al., Reference Lin, Hong, Lee, Wang and Zhang2011). It sold more than 11,000 copies, setting the record for any book published by advocacy groups or academics in Taiwan.
Three years later, in July 2014, a group of academics comprising economists and public finance scholars from Academia Sinica published a comprehensive report on taxation reform. The first problem, according to the report, was Taiwan's eroding tax base. This created a taxation system that lacked ‘fairness’ (gong-ping) and undermined the rather equal income distribution of which Taiwan was once proud (Academia Sinica, 2014).Footnote 19 The detailed prescriptions for tax reforms differed between these two books, but their analyses of the syndrome were quite similar: Taiwan's taxation regime is unfair and is highly related to deteriorating income distribution in the country.
These initiatives and their findings were certainly uncoordinated, since the academics of Academia Sinica were mostly American trained economists, undoubtedly at the opposite end of the socioeconomic ideological spectrum from the left-leaning Taiwan Labor Front and other progressive advocacy groups. However, these two books together underscore a high level of social consensus on an unfair tax regime in urgent need of reform. In various opinion polls conducted by Taiwanese newspapers and periodicals, the findings confirm this popular perception of the taxation system being unfair and needing serious reforms.Footnote 20
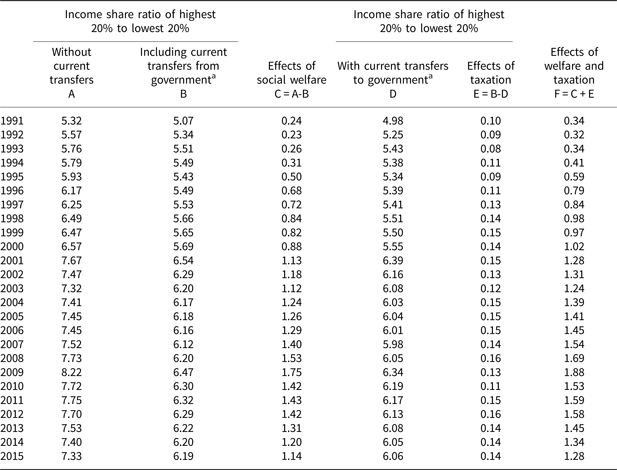
Indeed, since 1991, the effects of government welfare and taxation on the redistribution of disposable income have decreased, and income disparities widened. Table 4 shows the effects of government welfare and taxation on Taiwan's disposable income distribution from 1991 to 2015. From the 1990s to the early 2000s, there was an obvious reduction in the income share ratio between the highest 20% of earners and the lowest 20%. This is consistent with the rapid expansion of various welfare programs, such as universal health insurance, during the same period. In contrast, the effects of taxation on the income share ratio of the two groups remained largely constant since the 1990s, with only minor fluctuations. Hence, when the effects of welfare programs declined after 2007, sliding back to 2000 levels, the overall effects of welfare and taxation also declined (Table 4). It is, therefore, quite natural that the Taiwanese public opposes raising tax rates or introducing new taxes since the current system has been proven to have limited effects on income redistribution. However, Taiwan's people also favor expanding the public provision of LTC services to cope with the country's aging society, premised also on the perception that the government could do more to rectify the ongoing unfairness.
Effects of government welfare and taxation on disposable income distribution (1991–2015)

Source: DGBAS, ROC, 2016, Report on the Survey of Family Income and Expenditure (table 6, p.25). The concept of this table is sourced from Lin et al. (2012: 107). The author recalculated the numbers using the newest data from the DGBAS report.
Note: aFor definitions of current transfers from and to the government, see DGBAS (2016: pp.132–133).
Discussions so far have shown that repeated tax reductions and exemptions over the past 20 years have significantly narrowed Taiwan's tax base. These policy practices are extremely difficult to alter because ‘once a social bargain around tax relief is struck, it can be locked in politically through interest group pressure, norms, and party competition’ (Ide and Park, Reference Ide and Park2014: 686). Preferential tax treatment for corporations in Taiwan attests to this claim. However, this has also eroded social consent on taxation. Taxpayers consent to paying taxes on the assumption that the government is able to efficiently handle the revenue. Ide and Steinmo (Reference Ide, Steinmo, Martin, Mehrotra and Prasad2009) have argued that prior tax policy choices, if unconvincing, could prevent a government from persuading common citizens to pay more taxes. In other words, if prior repeated tax reliefs for corporations and the wealthy are not redressed, it is unlikely that Taiwan will be able to raise tax rates or introduce new taxes.
Thus, Taiwan is presently unable to broaden its tax base by, for example, raising the consumption tax rate, which is not an uncommon option for financing welfare in other countries. Without sufficient revenue to fundamentally transform the LTC system, the government has mostly endorsed the fiscal-free choice of migrant care-workers, aside from sporadic superficial policies. This has led to the re-familialization of Taiwan's welfare regime.
4. Political determinants of taxation and the welfare regime
Discussions so far have demonstrated the lasting impact of taxation on Taiwan's welfare regime. This final section delves further into the political determinants of taxation in Taiwan. The analysis below argues that the effect of weak taxation on the welfare state is fortified by identity-based party politics, influential capital, acquiescent labor, and the limited bargaining power of civil society.
4.1 Identity-based party competition
After extensive studies of the policy processes of tax reforms in Taiwan, one of the first conclusions reached by Sato is that there is no clear partisan confrontation over tax reform (Sato, Reference Sato and Wakabayashi2010, Reference Sato and Kawakami2015, Reference Sato2016). This paper's findings reaffirm this observation since the various tax reliefs for corporations have been introduced and renewed regardless of the party in power (see Table 3). This is exceptional because, since democratization, Taiwan's politics have often been characterized as polarized and filled with intense party competition (Fell, Reference Fell, Goldstein and Chang2008, Reference Fell, Cabestan and deLisle2014). The simple explanation for this exception is that party competition has been based on identity politics, rather than socioeconomic issues. Analyzing identity politics has been the most important and dominant approach in understanding the structure of Taiwan's politics (Wachman, Reference Wachman1994; Wakabayashi, Reference Wakabayashi2008). It has also had a profound impact on party competition, since during the early process of democratization, ‘national elections established Taiwan's relationship with China as the primary issue dividing party loyalties’ (Rigger, Reference Rigger, Diamond and Shin2014: 107).
This does not mean, however, that party competition is irrelevant to tax and welfare. Spending more and cutting taxes can be popular with the public and, therefore, effective in garnering electoral support. What often occurs in Taiwan, therefore, is inter-party competition to spend more (on welfare) and cut more (taxes),Footnote 21 as explored earlier in this paper. However, because identity politics are the core, politicians are not necessarily heavily punished for advocating tax hikes. President Ma was reelected with a comfortable margin in 2012 despite clearly publicizing, during his presidential election campaign, his intention to implement tax reforms that would include raising taxes.Footnote 22 More recently, despite discussing the possibility of raising the consumption tax rate, the DPP still achieved a landslide victory in 2016.
The implications for taxation and welfare are, thus, more contextualized. Studies have shown that if taxpayers feel they can clearly benefit from public spending, they will consent to raising taxes (Steinmo, Reference Steinmo1996; Ide and Steinmo, Reference Ide, Steinmo, Martin, Mehrotra and Prasad2009). A stronger link between revenue derived from taxation and specific welfare programs is, therefore, required, as the case of LTC in Taiwan neatly demonstrates.
Nonetheless, Taiwan's party competition is unique in relation to tax in that politicians propose tax during their electoral campaigns and are not necessarily punished at the ballot box. Once in power, though, they seldom succeed in attempts to actually execute tax reforms. Instead, they follow their predecessors in introducing tax deductions, which also tends to go unpunished. As such a pattern continues to weaken the state's ability to tax, consecutive governments, hence, opt for more self-financed welfare programs.
4.2 Strong capital and acquiescent labor
Lopsided power relations between capital and labor is another factor contributing to the entrenched policy preferences that weaken the government's taxation capacity. According to Sato (Reference Sato2016), an obvious characteristic in the process of tax reforms is that corporate leaders can often assert more influence than other actors, such as the president, premier, bureaucrats, legislators, experts and advocacy groups. During the authoritarian era, relationships between corporate leaders and the state were institutionalized. The chairmen of the largest industrial federations were, almost without exception, members of the KMT's central committee, then the de facto highest decision-making body of Taiwan. Although this mechanism has obviously receded since democratization, a myriad of personal ties still persists as the legacy of the authoritarian era (Huang, Reference Huang2004; Chang, Reference Chang2008).
In addition to using the regular channels of relevant ministries, such as the Ministry of Economic Affairs or Ministry of Finance, corporate leaders can also seek to influence policy-making through personal connections with powerful legislators and politicians, especially the president (Shinkawa et al., Reference Shinkawa, An, Lin and Shinkawa2015: 29). Another route is to push an agenda on crucial policies through the media. High profile corporate leaders are often outspoken about various issues and are treated as celebrities in Taiwan.Footnote 23 Some actually acquire media platforms to enable them to set the agenda directly (Lin, Reference Lin2015). As the equivalent of the Japanese Business Federation (Keidanren) or the Federation of Korean Industries, the Chinese National Federation of Industries (CNFI) is not nearly as active as its counterparts in Japan and South Korea, respectively. However, corporate leaders’ view has been quite consistent and not unexpected given Taiwan's past as a growth-first, newly industrialized economy: low tax and low welfare (Hsieh, Reference Hsieh2016) Their ability to control wage negotiations also remain very much intact. In short, although the mechanism for corporate leaders to assert their own agenda is no longer as institutionalized, it remains effective in democratized Taiwan.
To some degree, capital's ability to maintain influence is partially enabled by an acquiescent and fragmented labor force. In countries where industrialization was pursued under a democratic regime, tax and welfare are the results of ‘historic compromise’ between capital and labor (Ide and Steinmo, Reference Ide, Steinmo, Martin, Mehrotra and Prasad2009: 122). In contrast, Taiwan's industrialization began under an authoritarian regime, characterized by coopted labor, prior to the emergence of autonomous labor unions during the process of democratization (Huang, Reference Huang1999). Chiu (Reference Chiu and Wang2014) argues that while labor oppression in Taiwan might have seemed comparatively mild in the international context, organized labor was actually severely oppressed by the government during the process of democratization. From 1989 to 1993, more than 200 union cadres were laid off and more than 20 union organizers were prosecuted (Chiu, Reference Chiu and Wang2014: 120). Consequently, Taiwan's labor force eventually lost its momentum towards consolidation, due to fragmented leadership and partial incorporation into an identity-based party system, as all major parties began to nominate labor representatives as at-large legislators (Kamimura, Reference Kamimura and Soshou2007). The unionization rate for Taiwan's industrial workers was approximately 27% in 1994, but by the late 2000s, it had dropped to 15%. For the entire workforce, the unionization rate is estimated to be only around 7%: Taiwan's occupational unions are mostly convenient ‘fronts’ for small businesses and housewives to enroll in social insurance schemes, rather than fulfilling the traditional role of labor unions.
Consequently, the role of labor organizations is often limited to participation in wage negotiations and handling labor disputes; their interests in tax and social welfare remain low and limited. Were there to be compromises between capital and labor in Taiwan, they would be very minimal and vague: cost-sharing in universal social insurances and minimal corporate welfare, in exchange for relatively low-income tax for workers and apathy towards the tax rate on profits and capital.
4.3 Limited bargaining power of advocacy groups and civil society
What has, in a certain sense, supplemented the role of labor is the idea of civil society and its manifestation in advocacy groups’ participation in formulating social agenda and policy-making. Taiwanese intellectuals have consistently adopted the idea of civil society as a strategy for democratic consolidation and deepening. The tradition of intellectual activism emerged in the very early stages of Taiwan's democratization process (Chang, Reference Chang and Hsiao1990; Lii, Reference Lii and Ding-tzann2004), and remains a salient trend in which mixing academism and activism are common.Footnote 24
An ideal civil society should be accompanied by vibrant social activism. This is also a consistent argument for advocacy groups dedicated to various socioeconomic issues, such as labor, welfare, and, eventually, tax, an issue not traditionally addressed by social activists in Taiwan. Wong's (Reference Wong2006) research on health care reform in Taiwan also highlighted the importance of cross-class coalitions of policy advocates: in broadening the appeal of welfare, their efforts led to the creation and maintenance of redistributive universal health insurance. Similar dynamics can be observed regarding tax and welfare. Members of the Coalition of Fair Tax for Taiwan have been outspoken on unfair taxation since the early 2000s; some even became legislators and political appointees themselves, using the legislature and government to realize their advocacy work.Footnote 25
Obviously, civil society, in the form of advocacy groups, does not engage in collective bargaining and lacks the class-oriented cohesion of labor. It is, by nature, pluralistic and fragmented, and can sometimes be coopted by the state (Wu, Reference Wu2002). However, as demonstrated by the discussions on taxation's perceived unfairness in Taiwan, their views can serve as ‘counter forces against the corporate leaders when popular opinions are strong and clear’ (Sato, Reference Sato2016: 2). Since their role in shaping popular opinion is also crucial, the abilities of advocacy groups to shape policy agendas are, therefore, an important element of policy-making in taxation and welfare.
This does not necessarily mean that advocacy groups can reach a ‘historic compromise’ with capital. A series of entrenched policy preferences are extremely difficult to alter, especially with the accompanying erosion of social consent on taxation in Taiwan. However, as manifested by the allocation of certain tax revenues, the current government's commitment to public LTC provision, despite many corporate leaders calling it a fiscal ‘black hole,’ is evidence that advocacy groups have some impact on the politics of tax and welfare.
5. Conclusion
After exhaustive studies on mortality-reducing social services in East Asia and Latin America, McGuire concludes that democracy does not inevitably lead to the provision of basic social services or quantitative increases in spending on public health. Rather, democratic processes offer opportunities to improve health care, and whether a country succeeds depends on policy design and implementation (McGuire, Reference McGuire2010). In other words, the relationship between democratic deepening and welfare entrenchment is more nuanced and depends on the institutional designs of welfare programs. Still, the implied logic is that resources, including fiscal, committed to welfare policies are the results of institutional designs.
This paper has shown that the logic can function inversely: securing funding is not a result of welfare reform; rather, the availability of resources, that is, taxation capacity, determines the direction of welfare reforms. Welfare late-comers, such as Taiwan, have been extremely cost-conscious and reluctant to alter taxation policies or mobilize regressive taxation measures to finance the public provision of health care. Hence, the democratic process has, in fact, both enabled and yet constrained the implementation of LTC. Revenue-raising capacity can be an equally crucial variable in welfare entrenchment. This observation is consistent with Kato's (Reference Kato2003) argument that the newly industrialized countries, using the latecomer's advantages, tend to avoid ‘high tax, high welfare’ through regressive taxation.
In many ways, this has been a consistent feature of welfare expansion in Taiwan. Compacted developmental experiences often require simultaneous welfare entrenchment reforms and fiscal reforms. This was the case when single-payer universal health insurance was introduced in Taiwan. It was a policy instrument implemented in response to democratic pressure and to rectify an unfair social insurance system heavily favoring certain social groups. However, its purpose was also to improve the general social insurance schemes’ failing finances, which was achieved by separating off these schemes’ health coverage and broadening the base of insurance premium payers (Lin, Reference Lin1997).
In short, welfare entrenchment occurred without the need to fundamentally transform the state's revenue-raising capacity since the 1990s. However, Taiwan now faces new challenges. This paper shows that the increasing costs of universal social insurance schemes, coupled with prior tax policies that have narrowed the tax base, have made it extremely difficult for Taiwan to raise additional revenue to finance fundamental LTC program reforms. Whether the new LTC 2.0 can deliver the results required to justify further fiscal resources remains to be seen. However, the belated and insufficient attempts to deliver public LTC provision are, in many ways, a result of weak state capacity to raise tax revenues. This has, in turn, mapped the trajectory of the re-familialization of Taiwan's welfare regime. By linking discussions of welfare and tax, this narrative suggests an alternative explanation beyond existing discussions of welfare politics in Taiwan. It also attests to the contention in analyzing Latin America and South Korea that new democracies’ welfare regimes cannot be fully explained without analysis of taxation policies and politics.
Acknowledgements
The paper was originally prepared for delivery at the University of Tokyo Symposium: Democratization. Taxation, and the Welfare State in the Developing World, 11 January 2017. The author would also like to thank Editage (www.editage.jp) for English language editing.
Chenwei Lin is a professor at the Law Faculty of Tokoha University. His main research interests lie in Taiwanese politics and welfare regimes in East Asia. His works have been published in The Developing Economies and Nihon Taiwan Gakkaiho.