Implications
Livestock and feed production are dependent on finite freshwater. The need to meet the growing demand for livestock products and services coupled with multiple uses of water is expected to intensify the pressure on freshwater. To devise relevant strategies for optimum water use and allocation, we need to know the level of water consumption for livestock production in the system. This study reveals the water productivity (WP) of feed and livestock based on the feed resources types in the mixed crop-livestock (MCL) system. This will help to analyze the gap and apply interventions for WP improvement.
Introduction
Demand for livestock products is growing and expected to continue in the coming decades, especially in developing countries due to wide spectrum of drivers; increases in population, urbanization and income (Thornton, Reference Thornton2010; Herrero et al., Reference Herrero, Grace, Njuki, Johnson, Enahoro, Silvestri and Rufino2013). With growing incomes, people tend to change pattern of their eating habits and increase expenditure for consumption of livestock products (Steinfeld et al., Reference Steinfeld, Wassenaar and Jutzi2006). To meet these demands, the livestock sector needs to achieve increased productivity and use feed and water resources efficiently. The prime constraint to livestock production in most developing countries is feed shortage, the production of which is often dependent on limited freshwater. Fresh water is a finite and vulnerable resource (Falkenmark and Rockström, Reference Falkenmark and Rockström2004), and it increasingly becomes a limiting factor for agricultural activities (Haileslassie et al., Reference Haileslassie, Blümmel, Clement, Descheemaeker, Amede, Samireddypalle, Acharya, Radha, Ishaq, Samad, Murty and Khan2009; Descheemaeker et al., Reference Descheemaeker, Bunting, Bindraban, Muthuri, Molden, Beveridge, van Brakel, Herrero, Clement, Boelee and Jarvis2013). Expected rise in the demand for livestock products potentially augments the pressure on freshwater and calls for improved WP of livestock-related production systems (Haileslassie et al., Reference Haileslassie, Priess, Veldkamp, Teketay and Lesschen2011; Kebebe et al., Reference Kebebe, Oosting, Haileslassie, Duncan and de Boer2015).
In the MCL systems, livestock perform multiple functions and enhance system productivity (Peden et al., Reference Peden, Tadesse, Misra, Ahmed, Astatke, Ayalneh, Herrero, Kiwuwa, Kumsa, Mati, Mpairwe, Wassenaar and Yimegnuhal2007; Herrero et al., Reference Herrero, Thornton, Notenbaert, Wood, Msangi, Freeman, Bossio, Dixon, Peters, van de Steeg, Lynam, Parthasaranthy, Macmillan, Gerard, McDermott, Sere and Rosegrant2010) through provision of food, draught power, manure, raw materials for industry, cash income, employment and export earnings. However, in recent years, livestock and livestock products have been exposed for too much criticism due to a widely perceived use of large amount of freshwater and to their negative impacts on water resources and the environment (Peden et al., Reference Peden, Taddesse and Haileslassie2009; Descheemaeker et al., Reference Descheemaeker, Mapedza, Amede and Ayalneh2010). Evidences suggest that most of these examples come from industrial livestock production systems where large amount of water is being used to produce forages and grain feeds (Peden et al., Reference Peden, Tadesse, Misra, Ahmed, Astatke, Ayalneh, Herrero, Kiwuwa, Kumsa, Mati, Mpairwe, Wassenaar and Yimegnuhal2007). Whereas, the MCL system typical in developing countries is characterized with strong integration due to multifunctionality of livestock in crop production and importance of crop residues (CR) to feed livestock. Under MCL system farmers with relatively higher endowment of farm resources have registered improved food-feed crop and livestock outputs (Haileslassie et al., Reference Haileslassie, Blümmel, Clement, Descheemaeker, Amede, Samireddypalle, Acharya, Radha, Ishaq, Samad, Murty and Khan2009; Kebebe et al., Reference Kebebe, Oosting, Haileslassie, Duncan and de Boer2015), owing their capacity to channel more inputs into the system. However, there is limited information on whether the improvements in crop and livestock productivities along with farmers’ wealth gradient are at the expense of more freshwater depletion or not. It is hypothesized that farmers differ in acquiring enabling production factors which will have an effect in farm water use, farm output and WP. The present study is aimed at determining feed water productivity (FWP) and livestock water productivity (LWP) in MCL system operated by smallholders.
Material and methods
Description of the study area
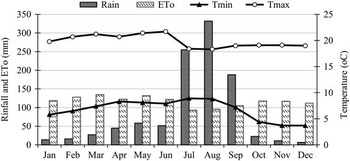
The study was conducted in Debre Berhan milkshed in the Amhara National Regional State, central highlands of Ethiopia, 130 km away to the Northeast of Addis Ababa. The area is located between 9°30' and 9°50' N and 39°20' and 39°44' E. The elevation ranges from 2840 to 2943 masl (Molla, Reference Molla2013). The mean annual minimum and maximum temperatures averaged between 2000 and 2014 years are 6.7°C and 19.9°C, respectively. The mean annual rainfall within the span of the same years is 1025.8 mm with a potential evapotranspiration of 1395.6 mm. Rainfall distribution is bimodal, usually the long rains last from June to the beginning of September, and the short rains falls between February and May. About 75.5% of the rain falls between July and September which is the main cropping season (Figure 1). Most of the area is covered by moderately and poorly drained soils, predominantly black Vertisol (Amsalu et al., Reference Amsalu, Stroosnijder and Graaff2007; Molla, Reference Molla2013).
Average monthly rainfall, potential evapotranspiration (ET0), maximum (T max) and minimum (T min) temperatures at Debre Berhan weather station (monthly data averaged from 2000 to 2014).

Rainfed MCL farming is the dominant system carried out primarily to meet the subsistence requirements for most of the farmers. Small-scale irrigated farming is limited to few farmers with small patchy areas along Beressa river mainly for vegetables. The principal rainfed food-feed crops include barley, wheat, faba bean and field pea. The cereals which covered the largest portion of cropped area are the major sources of CR for livestock feeding. Cultivation of teff (Eragrostis teff), lentils, chickpea, oats, linseed and vegetables is intermittent on small plots of cropland. The livestock species reared include cattle, sheep, goats, donkeys, horses, mules and poultry. Cattle production with indigenous and crossbred animals predominates the livestock production followed by sheep production. Natural grazing land (GL) and CR are the major livestock feed resources. Fallow land and crop aftermath grazing are temporal sources that contribute negligible amounts. The use of concentrates is rare due to unavailability and unaffordability by the smallholders.
Wealth status classification criteria
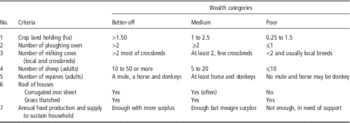
The setting of criteria for wealth status was made in consultation with district experts, development agents and confirmed based on the perspectives of local farmers during group discussions. Multiple criteria focussed on physical ownership of key assets and their anticipated values at the time of the study were used rather than precarious annual cash income. Ownership of houses with corrugated iron or thatched grass roofs, number and types of livestock, area of land and the capacity of farmers to satisfy household basic needs throughout the year were the major focusses. Nonetheless, setting an absolute cut-off point to each criterion was not possible, and an overlap in the range of values for the set criterion was evident. Instead of fixing the judgement based on the value of a single criterion, the contributions of the whole were assessed together to group a farmer under one of the three wealth categories. The descriptions of each criterion are summarized in Table 1.
Description of wealth status grouping criteria generalized based on farmers’ perspectives

Survey design and data collection
Sampling procedures and sample size
A multistage sampling procedure was employed to select farmers engaged in MCL farming and deliver fluid milk to the nearby milk collection centres (MCC). Debre Berhan milkshed was purposively selected based on its accessibility and potential representativeness of the MCL system in central highlands of Ethiopia. From 48 villages in the milkshed, six representative MCC (Wushawushign, Angolela, Kormargefia, Kebele01, Kebele07 and Kebele09) were selected using simple random sampling procedure. List of farmers obtained from selected MCC were categorized into three wealth groups to form the sampling frame. The number of sample farmers in each wealth group was based on the probability proportional to size sampling technique (50 poor, 58 medium and 51 better-off wealth groups). Finally, a total of 159 farmers were selected using systematic random sampling with whom the questionnaires were administered.
Data collection
A socio-economic survey using pretested semi-structured questionnaires was carried out using a face-to-face interview in 2014 and 2015. The questionnaire covered data on household demographic characteristics, land and livestock ownership, livestock species composition and herd structure, livestock offtake, draft animal services, feed types, crop types grown, areas cultivated, input used and crop yield at farm level, market price for crop and livestock products and by-products. Checklists were prepared for group discussions on the major factors influencing crop and livestock production, land use, wealth group categorization, trends of livestock and crop production. Focus group discussions were conducted at each of selected MCC. A total of 40 farmers (six to eight per session) representing wealth groups have participated in six sessions. Knowledgeable farmers from all wealth groups were selected anticipating an effective communication between the moderator and within themselves. The secondary data were extracted from previous studies and information documented at agricultural development and research offices.
Data analyses
Methods and procedures followed to estimate livestock beneficial outputs (BO), feeds sourced, water evapotranspired and WP are described below.
Livestock beneficial outputs
Multiple products and traction services accrued at household level were estimated as annual livestock BO. Annual milk production was estimated from the number of lactating cows, the average daily milk yield and lactation period of cows. Offtake for the different livestock types counted was based on the number of animals sold, slaughtered and/or gifted out. Manure production and its nutrient composition was estimated from manure dry matter (DM) yield per tropical livestock unit (TLU) per year (Lupwayi et al., Reference Lupwayi, Girma and Haque2000; Haileslassie et al., Reference Haileslassie, Peden, Gebreselassie, Amede, Wagnew and Taddesse2005) for the annual average livestock holdings. Manure production was calculated using dry weight productivity of 3.3 kg/day per TLU for cattle and 2.4 kg/day per TLU for equines and small ruminants (Haileslassie et al., Reference Haileslassie, Peden, Gebreselassie, Amede, Wagnew and Taddesse2005). Nutrient composition was estimated based on average nutrient content of 18.3 g N/kg, 4.5 g P/kg and 21.3 g K/kg on a dry weight basis (Lupwayi et al., Reference Lupwayi, Girma and Haque2000). Monetary equivalence of manure to artificial fertilizers was extrapolated from the nutrient contents and prices of Urea and di-ammonium phosphate (DAP). Traction services were calculated based on number of oxen used and frequency of land cultivation from fist ploughing to sowing, number of animals used for threshing and use of equines for transportation of agricultural produce, human and other commodities. Market prices of live animals, livestock products and livestock hiring values for services were used to quantify into unity in monetary terms (USD).
Livestock feeds
Livestock feeds in the study area are mainly sourced from natural gazing lands and food-feed crops. To convert grain yield to CR, multipliers of 1.5 t/ha for barley and wheat, and 1.2 t/ha for faba bean and field pea were used (Kossila, Reference Kossila1988). The total GL available to the household was the sum of privately owned and part of communal GL. Livestock are left to graze freely on communal GL, where no local ground rules were applied in sharing of this resource to assume equitable share. It was assumed that utilization of the available feed and water from such given area is a function of livestock density and ownership per farm household. A livestock density of 14.8 TLU/ha derived based on data on the size of livestock and GL area were used to allocate the communal grazing to each livestock owner relative to livestock possession. The feed DM productivity on GL was estimated based on multiplier of 2 t/ha established from previous GL condition and productivity studies (Food and Agriculture Organization of the United Nations (FAO), 1987).
Water depleted for feed production
Meteorological and crop data were used as an input for CROPWAT 8.0 computer program (FAO, 2009) to estimate crop water requirement. Long-term monthly average climate data (radiation, air temperature, air humidity and wind speed) were used to calculate the local evapotranspiration (ET0). The actual evapotranspiration (ET a ) associated with the crop biomass production was estimated by relating the reference evapotranspiration (ET0) with the crop coefficient (K c ); ET a =ET0 .K c (Allen et al., Reference Allen, Pereire, Raes and Smith1998). The crop types, area coverage and length of growing periods were obtained from local farmers. The crop coefficients (K c values) were extracted from FAO Irrigation and Drainage Paper No. 56 (Allen et al., Reference Allen, Pereire, Raes and Smith1998). Crop grain yield during main cropping season obtained from farmers was used to quantify CR and associated water use. The harvest index approach (Haileslassie et al., Reference Haileslassie, Blümmel, Clement, Descheemaeker, Amede, Samireddypalle, Acharya, Radha, Ishaq, Samad, Murty and Khan2009) was employed to partition depleted water between grain and residues. Depleted water on GL was estimated based on area of grazing, K c value for extensively grazed land (Allen et al., Reference Allen, Pereire, Raes and Smith1998) and length of growing period generated using New_LocClim software (FAO, 2006).
Livestock feed water productivity
The physical WP of livestock feed is determined as a ratio of DM yield to water depleted (WD) to produce feed (van Breugel et al., Reference van Breugel, Herrero, Jeannette van de Steeg and Peden2010; Haileslassie et al., Reference Haileslassie, Priess, Veldkamp, Teketay and Lesschen2011). The model is specified as
 $${\rm FWP}_{j} \,{\equals}\,{{\mathop{\sum}\limits_{j\,{\equals}\,1}^n {{\rm DM}_{j} } } \over {\mathop{\sum}\limits_{j\,{\equals}\,1}^n {{\rm WD}_{j} } }}$$
where j denotes a unit of observation, FWP is livestock feed physical water productivity (kg/m3), DM j is quantity of DM (kg) of j th feed type; WD j is the amount of water evapotranspired (m3) to produce the j th feed type.
Livestock water productivity
Livestock water productivity is an index that relates the annual livestock outputs and services to the WD for feed production (Peden et al., Reference Peden, Tadesse, Misra, Ahmed, Astatke, Ayalneh, Herrero, Kiwuwa, Kumsa, Mati, Mpairwe, Wassenaar and Yimegnuhal2007). The model is specified as
 $${\rm LWP}_{i} \,{\equals}\,{{\mathop{\sum}\limits_{i\,{\minus}\,1}^n {(O_{i} {\times}P_{i} {\plus}S_{i} {\times}P_{i} )} } \over {\mathop{\sum}\limits_{i\,{\equals}\,1}^n {{\rm WD}_{i} } }}$$
where i denotes a unit of observation, LWP is livestock water productivity (USD/m3), O i is quantity of i th livestock output, S i is service type, P i is market price (USD) of the i th output and i th service type; WD i is the amount of water evapotranspired (m3) to produce the i th feed type.
Statistical analysis
To determine whether the means of dependent variables observed (such as farm resource holdings, livestock BO, WD, WP) are the same or not between farmers’ wealth status a one-way analysis of variance (ANOVA) was used. Data complied with the assumptions of ANOVA when checked for normality and homogeneity of variance. The one-way ANOVA model is given by
 $$Y_{{ij}} \,{\equals}\,\mu _{i} {\plus}F_{i} {\plus}{\epsilon}_{ij} $$
where, Y ij is the j th observation in the i th wealth group, µ i is the common effect for the whole wealth group, F i is the effect of the i th wealth group and є ij is the random error associated with the j th observation in the i th wealth group assumed to be normally and independently distributed, with mean 0 and variance σ2 ϵ, i designates the wealth group, and j denotes a specific observation. The test was done at 95% level of confidence (α=0.05). Tukeys’ HSD mean comparison procedure was used to test mean differences. Pearson’s correlation analysis is employed to evaluate the relationship between the proportion of CR in livestock feed supply and FWP and LWP. All statistical analyses were carried out with SPSS 23.0 (International Business Machines Corporation (IBM Corp. Released), 2015).
Results
Ownership of land, livestock and farm labour resources
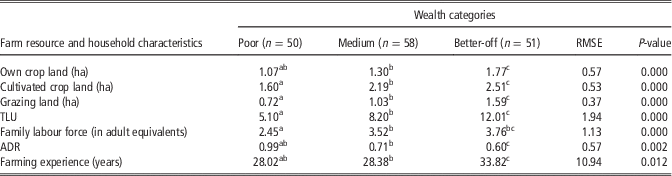
Land, livestock and farm labour were key resources that defined the farm productivity and wealth status of smallholder farmers. Ownership of these resources showed significant difference between wealth groups as presented in Table 2. Cropland ownership (righteously entitled) was significantly higher for better-off than both medium and poor farmer groups. Moreover, the size of cultivated cropland in the cropping calendar (include entitled and land leased through local agreement) was falling from better-off to poor wealth status. The livestock holding aggregated into TLU was higher for better-off followed by medium and poor groups. Area of GL that included privately owned and communal land allocated was found to follow the pattern of wealth status. Poor farmers had less farm labour force available to support their farm operations than other groups. The productively inactive proportion of the family (under 15 and above 64 years) was more in poor and medium than better-off, as it was revealed with significant variation of the age dependency ratio between better-off and other groups. Household head farming experience was also significantly different exhibiting same pattern as age dependency ratio (Table 2).
Means of farm resources and household characteristics among wealth categories

TLU=tropical livestock unit; ADR=age dependency ratio.
1 TLU=250 kg live weight.
ADR=the dependency ratio relates the number of children (0-14 years old) and older persons (65 years or over) to the working-age population (15 to 64 years old).
a,b,cValues within a row with different superscript letters differ significantly at P<0.05.
Livestock feed resources, water depleted and feed water productivity
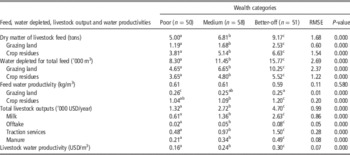
The amount of feed estimated was comprising of CR derived from major food-feed crops (barley, wheat, faba bean and field pea) and grass from GL. Comparisons of feed quantity and volume of WD and the resulting FWP among farmer wealth groups are presented in Table 3. Livestock feed DM obtained from food-feed crops, GL and the overall were significantly different between wealth groups, being higher for better-off followed by medium and poor farmers. The volume of WD for feed sources and the overall feed production showed significant variations among wealth groups with same order as DM. However, WP of feed sources showed significantly contrasting variations. In case of feed from GL, poor farmers gained better WP than medium and better-off. In contrast, better-off farmers gained more WP for CR than medium and poor. However, there was no significant variation on the overall FWP.
Means of feed dry matter, water depleted and water productivity of feed and livestock among wealth categories

USD=United States Dollar (1 USD=20.00 Ethiopian Birr).
a,b,cValues within a row with different superscript letters differ significantly at P<0.05.
Livestock beneficial outputs and livestock water productivity
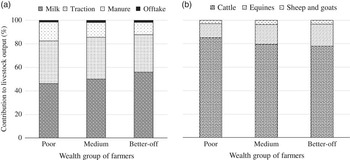
Comparisons of the mean values of outputs and services quantified on annual basis separately and in aggregate into monetary terms and the resulting LWP between wealth groups are presented in Table 3. Derived monetary values for livestock BO like milk, offtake and manure and traction services exhibited significant variations between wealth groups. The better-off obtained highest overall benefit as well as various output types and services compared with farmers in other wealth groups. Significant variation in LWP assumed farmers’ wealth status being highest for better-off and lowest for poor groups. Figure 2a and b illustrates the contribution of output types and species to the total annual BO obtained from livestock. Irrespective of wealth status, milk value generated highest proportion followed by traction services, manure and offtake in order of importance. Among species highest proportion was generated from cattle followed by equines and small ruminants.
Proportion of estimated annual livestock beneficial output contributed from (a) livestock products and services and (b) livestock species, among farmer wealth groups.

Relationships of crop residues use with water productivity of feed and livestock
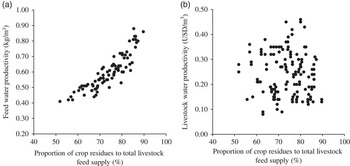
Proportion of CR use in livestock feed supply showed strong positive linear relationship (r(157)=0.89, P=0.000) with FWP. The relationship was linear as illustrated in the scatter plot Figure 3a. But no linear pattern was observed in scatter plot Figure 3b between the level of CR and LWP. It is difficult to suggest the existence of reliable linear association between CR use and LWP based on this evidence.
Relationships between the proportion of crop residues in total livestock feed supply and (a) feed water productivity and (b) livestock water productivity, in the mixed crop-livestock system.

Discussion
Land, livestock and farm labour resources: implications on productivity
The availability of labour, land and livestock resources are the pillars of farm productivity that stratify smallholder farmers into wealth groups. The present study is in agreement with previous reports by Haileslassie et al. (Reference Haileslassie, Blümmel, Clement, Descheemaeker, Amede, Samireddypalle, Acharya, Radha, Ishaq, Samad, Murty and Khan2009) and Kebebe et al. (Reference Kebebe, Oosting, Haileslassie, Duncan and de Boer2015), which revealed the significant effect of resources endowment of farm households on the productivity of food-feed crops, livestock and WP of both livestock and feed under the smallholder MCL system. Small area of cropland and fewer oxen for cultivation deprived poor farmers from diversifying their harvest of food-feed crops and generate enough food and feed. On the other hand, more ownership of livestock (oxen) and farm labour force by better-off and medium farmers besides allowing for more annual benefit gain from livestock and own cropland further capacitate them to acquire and cultivate leased cropland. Wealthier are enabled to harvest more diversified food-feed crops on wide area and avail additional CR to offer for livestock. Two ways of local lease agreements for cropland are practiced: share the product or pay the rent in cash for the land. When they do share agreement, the cultivator is entitled to use whole CR, whereas only share half of the grain yield to land owner. When they do rent the land in cash agreement, the land cultivator pays a certain amount of money to the land owner for a given period of time (usually a year) based on land size, fertility, water access for irrigation and length of period of agreement and takes whole crop biomass. Comparable observations were reported by Kebebe et al. (Reference Kebebe, Oosting, Haileslassie, Duncan and de Boer2015) and Molla (Reference Molla2013) that farmers with more ownership of livestock numbers particularly oxen and farm labour force are able to cultivate cropland on the right time of season with required frequency of tillage to prepare the land better and depress the influence of weeds on the main food-feed crop. Proper agronomic practices are duly done when sufficient family labour is available or farmers are able to afford hired labour, which is amenable for better-off farmers and in rare cases for medium but not for the poor groups. Moreover, labour availability is compulsory to carryout sound livestock management and improve their productivity (McDermott et al., Reference McDermott, Staal, Freeman, Herrero and van de Steeg2010).
Feed resources, water depleted and feed water productivity
Choices for production of major food-feed crop types are comparable in the system irrespective of farmers’ wealth status. Barley, wheat, faba bean and field pea are the major cultivated crops in order of importance. Allocation of piece of land for a particular crop type in cropping season is determined mainly by area of cropland owned and capacity of the farmer to acquire additional land through lease. The decreasing gradient in size of cropped land from better-off to poor groups dictates relative difference in type and quantity of CR production, volume of WD and FWP in the same direction. In conformity with this study Blümmel et al. (Reference Blümmel, Samad, Singh and Amede2009) and Haileslassie et al. (Reference Haileslassie, Blümmel, Clement, Descheemaeker, Amede, Samireddypalle, Acharya, Radha, Ishaq, Samad, Murty and Khan2009) reported the size of cropped land and crop diversity as major contributing factors for disparities in the type and amount of CR that farmers can afford to supply and associated volume of rainwater evapotranspired per year for production of livestock feed in MCL system.
As a matter of fact, the DM harvested and water evapotranspired to produce CR is intrinsically dependent on crop attributes from which it is derived. The effects manifested on the crops are carried over to CR in the process, although the share of WD for grain and CR depends on each product fraction from the total biomass (Descheemaeker et al., Reference Descheemaeker, Amede, Haileslassie and Bossio2011; Haileslassie et al., Reference Haileslassie, Priess, Veldkamp, Teketay and Lesschen2011). Variation in crop biomass yield among wealth groups contributed to the difference in the volume of water evapotranspired for part of feed production. In line with the present study, Haileslassie et al. (Reference Haileslassie, Blümmel, Clement, Descheemaeker, Amede, Samireddypalle, Acharya, Radha, Ishaq, Samad, Murty and Khan2009) and Kebebe et al. (Reference Kebebe, Oosting, Haileslassie, Duncan and de Boer2015) investigated similar pattern of variation among wealth groups, whereby better-off farmers gained higher feed production from CR with improved WP. Fortunately, productivity improvements in grain and residues of food-feed crops can be made all along the line of technologies and management practices such as plant breeding, selection, tillage, fertilization, weed and pest control, harvesting, water use and other agronomic practices (Borlaug, Reference Borlaug2000). However, low technology uptake and access to resources are the challenges that restrain the capacity of poor farmers. Given the positive relationship of these factors with increased yield of crop biomass and associated WP, interventions targeted to improve provision of inputs, credit, extension and training support to the poor would potentially help to improve CR yield and part of water use for feed production.
Another major path to water depletion for livestock feed production is GL (Haileslassie et al., Reference Haileslassie, Priess, Veldkamp, Teketay and Lesschen2011; Kebebe et al., Reference Kebebe, Oosting, Haileslassie, Duncan and de Boer2015), which has two types of ownership; private and communal. Generally, the low FWP on GL irrespective of wealth status indicates the need of interventions at all levels. However, the difference in FWP on GL observed among poor and other wealth groups is prominently the reflection of communal GL use intensity attributed to livestock density and ownership pattern. Poor farmers do share small portion of communal GL than other wealth groups, which is appropriated relative to the size of livestock ownership, yet they own comparable size of private GL, which were relatively in good condition. Relatively, wealthy farmers with more TLU exploited more feed and water and gain less FWP on GL than poor farmers, as their herd are responsible for removal more biomass from communal GL, which is not properly managed.
The low FWP on GL is an indicator of inefficiency in water use for feed production, which can be partly explained by poor GL management and overgrazing. Overgrazing cause land degradation (Peden et al., Reference Peden, Tadesse, Misra, Ahmed, Astatke, Ayalneh, Herrero, Kiwuwa, Kumsa, Mati, Mpairwe, Wassenaar and Yimegnuhal2007), which increase the unproductive water lose through water evaporation from the soil surface (Passioura and Angus, Reference Passioura and Angus2010) and resulted reduced FWP on GL. Every member of the local community, though has the right to use communal GL, do not feel secured. They noticed that communal land is the once easily available for redistribution and land grant to the landless youth, investors or other public sector needs. Farmers do not pay attention for better GL management, proper use and adopt sustained interventions to improve productivity and condition of the communal land. This is supported by Lawry et al. (Reference Lawry, Samii, Hall, Leopold, Hornby and Mtero2014) who reported that secured land tenure enables farmers to invest in long-term improvements without fear in the expectation that they will reap the benefits from their farms. Therefore, mechanisms that ensure land security is expected to promote better land management, which could positively impact land productivity and increase FWP. Proper grazing management and pasture improvement is essential for increased feed biomass production and FWP from GL. The supply of improved forage seeds and application of soil and water conservation practices would enhance the improvement in FWP.
Livestock beneficial outputs and livestock water productivity
Farmers explore the advantaged of keeping blend of livestock species to generate distinctive outputs and services through allocation of farm resources available at their disposal. The present work considered outputs like milk, offtake, manure and traction services to estimate the annual livestock BO. However, Behnke (Reference Behnke2010) underscores that livestock under smallholder MCL systems in developing countries like Ethiopia perform other social and economic functions as savings and insurance which are difficult to evaluate annually in monetary terms. Unlike the findings of Haileslassie et al. (Reference Haileslassie, Blümmel, Clement, Descheemaeker, Amede, Samireddypalle, Acharya, Radha, Ishaq, Samad, Murty and Khan2009) and Kebebe et al. (Reference Kebebe, Oosting, Haileslassie, Duncan and de Boer2015) where manure and traction services accounted for the prime share of annual benefits, in this study higher proportion is captured from milk production followed by traction services and manure regardless of farmers’ wealth status. The potential of dairy farming is evidenced due to market accessibility for the products and inputs in Debre Berhan town and Addis Ababa city and conduciveness of the temperate type climate that could easily be acclimatized by crossbred dairy animals of the locals with exotic blood of temperate origin. Various studies emphasized the desirability of the area for intensive dairy farming with crossbred animals (Wondatir et al., Reference Wondatir, Mekasha and Wouters2011; Ayalew and Asefa, Reference Ayalew and Asefa2013). The variation in milk offtake between farmer groups is mainly attributed to the number of milking cows particularly crossbreds kept in wealthier than poor farmers. Variation in the value of traction services has displayed the pattern of disparity in the cropped land area, frequency of cultivation, and volume of production reflecting the state of wealth among farmers. The pattern of variations in manure production and estimated value among groups is unequivocally associated with the size of livestock holdings and the type and level of feeding. Even though there is variation in livestock offtake among wealth groups, its contribution to the total annual livestock output is the least. This observation reflects the general situation of the country reported by Behnke (Reference Behnke2010) where live animal offtake rate is low especially in the mixed system. In MCL system the primary purpose of keeping livestock is to complement the crop production and maintain continuity of livestock herd. However, dairying could not be undermined in this area, it is an attractive venture provided good husbandry and management interventions are in place. Generally, in the present context the variations in LWP can be explained by cumulative spillover effects of the contrasting ownership of assets, outputs gained and inputs used at farm level between wealth groups. These circumstances reinforced the previous findings on the magnitude of LWP and the effect of farmers’ wealth status on LWP by (Haileslassie et al., Reference Haileslassie, Blümmel, Clement, Descheemaeker, Amede, Samireddypalle, Acharya, Radha, Ishaq, Samad, Murty and Khan2009; Kebebe et al., Reference Kebebe, Oosting, Haileslassie, Duncan and de Boer2015) that households in better-off and medium wealth categories registered higher values of total BO and LWP. Access to resources and relevant technologies are expected to substantiate the relationship between yield and WP. Considering the potential of the area for MCL system, interventions that complement each other can be suggested to increase WP in smallholders, particularly for the poor groups. Promotion of livestock production focussed on milk through crossbreeding, supplementation and sound healthcare; and crop production through provision of suitable varieties, oxen and fertilizers complemented with training will boost the capacity of poor farmers to achieve increased LWP.
Implications of crop residues on feed and livestock water productivity
Crop residues are considered relatively as cheap sources of livestock feed supply. However, the use of CR is transcending beyond livestock feed and their price is tremendously increasing. It can be used as construction material, fuel and in conservation agriculture for soil fertility enrichment and water conservation management. If not used as livestock feed, the water imbedded in CR could be diverted to other benefits. This justifies that the water cost due to feeding CR to livestock could not be entirely considered as free source. What makes it cheap source is that no extra land and water inputs are demanded beyond the requirement for the principal product of crop cultivation, that is grains and pods (Blümmel et al., Reference Blümmel, Haileslassie, Samireddypalle, Vadez and Notenbaert2014). Owing the opportunity cost of using CR to other benefits other than livestock feed, it is rational to share the cost of water. This partitioning of water evapotranspired for crop biomass production and use of CR as livestock feed explains the strong and positive relationship with FWP.
Obviously, higher feed DM yield per unit volume of WD reduces the water input for livestock production and ultimately will increase LWP. This has been reported by various authors (Descheemaeker et al., Reference Descheemaeker, Bunting, Bindraban, Muthuri, Molden, Beveridge, van Brakel, Herrero, Clement, Boelee and Jarvis2013; Kebebe et al., Reference Kebebe, Oosting, Haileslassie, Duncan and de Boer2015). The unclear, but more likely non-linear relationship pattern between the level of CR supply and LWP in the present scenario may reflect the other dimensions of CR. Crop residues are obtained as by products after full maturity of the plant where less utilizable structural components of the plant tissue are high. Plant maturity has a counteracting effect on digestibility and nutrient availability to the animal. This makes CR as a sub-optimal feed resources to meet the nutrient requirement and bring livestock productivity to their potential. This is an established fact from numerous studies (Blümmel et al., Reference Blümmel, Samad, Singh and Amede2009 and Reference Blümmel, Haileslassie, Samireddypalle, Vadez and Notenbaert2014). In the production systems where share of CR in the ration of livestock is considerable and other interventions like supplementation, alternative feed resources and feed treatments are limited the productivity potential of livestock will be impaired. The limitations imposed by high proportion of CR result in decreased output from livestock and consequently low LWP. Mechanisms that help to enhance the feed value of CR will have immense potential to increase LWP.
Acknowledgements
The authors like to acknowledge Addis Ababa University and Debre Berhan University for financial support. The authors like to thank staff of the Bosona Worana and Angolela enaTera district agriculture and rural development offices, development agents who assisted in data collection and farmers of the study area for their cooperation.