Introduction
Autism spectrum disorder (ASD) is a complex neurodevelopmental disorder characterized by early behavioral differences relative to typically developing (TD) children, including abnormal social interactions and communication along with repetitive and restrictive behaviors. ASD is associated with anatomical abnormalities including a faster increase in head circumference early in life that normalizes later in development (Courchesne & Pierce, Reference Courchesne and Pierce2005), altered minicolumnar architecture (Casanova, Reference Casanova2007), and differences in brain connectivity (Ameis et al., Reference Ameis, Fan, Rockel, Voineskos, Lobaugh, Soorya and Anagnostou2011; Bode et al., Reference Bode, Mattila, Kiviniemi, Rahko, Moilanen, Ebeling and Nikkinen2011; Jou et al., Reference Jou, Mateljevic, Kaiser, Sugrue, Volkmar and Pelphrey2011). Some studies have reported local over-connectivity while others report long-distance under-connectivity between key brain regions (see Vissers, Cohen, & Geurts, Reference Vissers, Cohen and Geurts2012, for a review of connectivity studies). Moreover, several of these regions connect brain areas implicated in the development of higher cognitive specialization (Geschwind, Reference Geschwind2009).
Despite accumulating evidence of white matter alterations in ASD, there is a lack of studies investigating the relationship between white matter integrity and specific neuropsychological function such as intelligence quotients (IQ). Recent epidemiological data (Charman et al., Reference Charman, Pickles, Simonoff, Chandler, Loucas and Baird2011) suggest wide variability in IQ across the ASD population, with 55% having an intellectual disability defined by IQ < 70 (but only 16% having a moderate to severe disability of IQ < 50), 28% having average intelligence (115 > IQ > 85), 3% having above-average intelligence (IQ > 115), leaving 14% in a below-average range of 70 < IQ < 85. Administration of standardized neuropsychological tests to children with ASD is often complicated by impaired language function (Anderson et al., Reference Anderson, Lange, Froehlich, DuBray, Druzgal, Froimowitz and Lainhart2011; Frye & Beauchamp, Reference Frye and Beauchamp2009). This is important when assessing IQ in children with ASD, as most standard IQ tests are heavily language-based and subjects with ASD score higher on visuospatial compared to verbal-analytic items in tests of intelligence (Fugard, Stewart, & Stenning, Reference Fugard, Stewart and Stenning2011).
The objective of this study is to explore the relationship between white matter integrity and IQ in children with ASD. To that end, we administered a standardized test of non-verbal IQ (Hammill, Pearson, & Wiederholt, Reference Hammill, Pearson and Wiederholt1997) to a group of high-functioning ASD and TD children matched on the basis of age and gender. The use of this IQ test allowed both groups of children to complete testing successfully by computer interaction, thereby de-emphasizing dependence on language skills. We then conducted within- and between-group covariate analyses using tract-based spatial statistics (TBSS) of their diffusion tensor images (DTI) to allow for whole-brain exploration of white matter integrity as a function of IQ.
Methods
Subjects
Ten children with ASD and 10 TD controls matched on the basis of age (ASD mean, 10.7; std, 2.2; range, 7.8 to 14.8 vs. TD mean, 11.4; std, 2.0; range, 8 to 15; no age difference p = .49) and gender (9 males) were enrolled with parental consent in this study, which was completed in accordance with the Helsinki Declaration and approved by the local institutional review board for ethical research and the protection of human subjects. The majority of children with ASD (8) were recruited from a local private school providing behavioral and educational services for children with ASD, diagnosed using the standardized Autism Diagnostic Observation Schedule criteria. The other two ASD participants were recruited from the University of Texas Health Science Center at Houston's Medically Based Autism Clinic and had previously been diagnosed using standard criteria by both a psychiatrist and developmental pediatrician. All subjects were examined by the last author (R.E. Frye) and determined to meet the DSM-IV criteria (APA, 1994) for ASD before entering the study. Controls with no history of developmental disorders or school problems were recruited from flyers posted in the University of Texas Health Science Center and by word-of-mouth from the families of the ASD patients tested.
Neuropsychological Testing
Each subject completed the computerized version of the comprehensive test of non-verbal intelligence (CTONI) (Hammill et al., Reference Hammill, Pearson and Wiederholt1997). The CTONI does not require any oral responses, reading, writing, or manipulation of objects, and is useful for testing individuals with difficulties in language or fine motor skills or other neurological disabilities. It contains six subtests, which require subjects to view a group of pictures or geometric designs and to solve problems involving analogies, categorizations, and sequences. In the computerized CTONI, an interactive multimedia display instructs the subjects, who then points the mouse and clicks on the answer. The CTONI criterion validity has been compared to a more traditional and widely used IQ measure, the Wechsler Intelligence Test for Children (WISC-III), in a large sample and was found to correlate strongly (r = 0.81) (Kamphaus, Reference Kamphaus2005).
MRI Acquisition
All subjects participated in one 3 Tesla MR imaging (Philips Intera) session. Two high-resolution T1-weighted MRI (repetition time/echo time [TR/TE] = 8.4/3.9 ms; flip angle = 8 degrees; matrix size = 256 × 256; field of view [FOV] = 240 mm; slice thickness = 1.0 mm thick sagittal slices) and one 32-direction diffusion imaging sequence (high angular resolution, overplus on, TR/TE = 8500/67 ms; flip angle =90 degrees; matrix size 128 × 128; FOV = 224 mm; 2-mm-thick axial slices, max. b-value of 800 s/mm2) were obtained.
Tract-Based Spatial Statistics
A tract-based spatial statistics analysis (TBSS) (Smith et al., Reference Smith, Jenkinson, Johansen-Berg, Rueckert, Nichols, Mackay and Behrens2006), part of FSL (FMRIB Analysis Group), was performed using the DTI data. First, fractional anisotropy (FA) images were created by fitting a tensor model to the raw diffusion data using FSL's FDT module, and then brain-extracted using the BET module. All subjects’ FA data were then aligned into a common space using the nonlinear registration tool FNIRT, which uses a b-spline representation of the registration warp field. Alignment of each subject's FA data was made to a study-specific template, since an adult-derived template is inappropriate for studying children. The custom template was generated by aligning every ASD and TD FA image to every other one, identifying the most representative, and using it as the target image. The target was then affine-aligned into MNI152 standard space, and every image was transformed into MNI152 space (1 mm3 resolution) by combining the nonlinear transform to the target FA image with the affine transform from that target to the MNI152 space. Next, the mean FA image was created and thinned to create a mean FA skeleton (using an FA threshold of 0.2), which represents the centers of all tracts common to the group. Each subject's aligned FA data was then projected onto this skeleton and the resulting data were fed into voxelwise cross-subject statistics.
Separate within- and between-group TBSS analyses were performed with CTONI IQ as covariates. The within-group analyses used contrasts to find voxels where FA and IQ were correlated in the ASD and TD groups separately. The between-group analyses used a contrast testing for voxels with differences in the relationship between FA and IQ between the ASD and TD groups. In all analyses, a significance threshold based on random permutation testing of p < .05 was used, which represents a threshold that is corrected for multiple comparisons across space using the threshold-free cluster enhancement option in FSL.
Results
IQ Scores
CTONI scores differed between ASD and TD but, on average, were within normal range for both groups (85.3 vs. 108.4; t(18) = 3.44; p = .003). Scores for picture and geometric CTONI sub-components also differed but, on average, were within normal range for both groups (pictures: 84.6 vs. 105.5; t(18) = 3.11; p = .006; geometric 87.6 vs. 110.2; t(18) = 3.06; p = .007).
Analysis of Scanner Motion
Analysis of six-axis translational and rotational motion during acquisition of the 32 diffusion-weighted volumes was conducted on the output re-alignment parameters to determine if ASD subjects moved more than TD subjects. The mean range of translational displacement was small and was not significantly greater for ASD (mean 1.22 mm, std. 0.68) compared to TD (mean 2.06 mm; std. 0.26). The mean range of angular displacement was also small and was not significantly greater for ASD (mean 0.98 degrees; std. 0.58) compared to TD (mean 0.47 degrees; std. 0.28).
TBSS Analyses
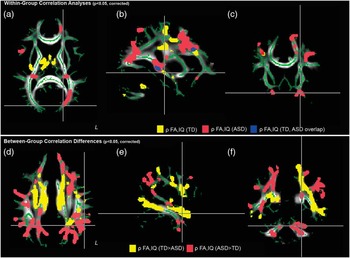
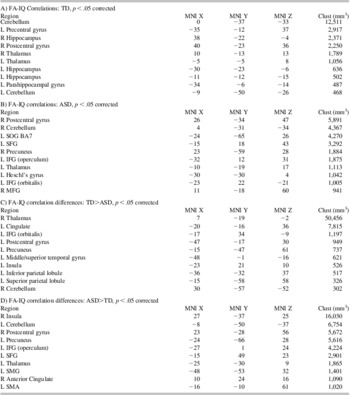
First, TBSS analyses were conducted to identify voxels where FA varied significantly (p < .05, corrected) as a function of IQ within the TD and ASD groups separately. These analyses revealed mostly non-overlapping patterns of white matter, which are depicted in color in Figure 1a–c. Of the 55,419 mm3 of tissue found to correlate with IQ in TD and the 67,112 mm found to correlate with IQ in ASD, only 11,762 mm3 (9.6%) was found to overlap. The different clusters of white matter in each group are summarized by location in Table 1a & b. They include in TD (Table 1a) right and left (para-) hippocampus, bilateral thalamus, cerebellum, left precentral gyrus Brodmann area (BA) 6, and right postcentral gyrus. The ASD group (Table 1b) also included correlations in left thalamus, right cerebellum and postcentral gyrus, as well as other areas including left superior occipital gyrus (SOG, BA7), left superior frontal gyrus (SFG), right precuneus, left inferior frontal gyrus (IFG; separate clusters in operculum and orbitalis), left Heschl's gyrus and right middle frontal gyrus (MFG).
Different fractional anisotropy–intelligence quotients (FA-IQ) correlation patterns within- and between-groups. Representative axial, sagittal, and coronal slices from separate within-group analyses reveal significant (p < .05, corrected) positive correlations between FA and IQ in superior occipital gyrus in the autism spectrum disorders (ASD) group (a), the left hippocampus in the typically developing (TD) group (b), and the orbital frontal region in ASD (c). There was minimal overlap (blue voxels, a–c) between the correlation patterns found in the ASD (red voxels) and TD (yellow voxels) within-group analyses. A between-group analysis found widespread significant (p < .05, corrected) correlation differences, including greater correlation between ASD (red voxels) versus TD (yellow voxels) near left supramarginal gyrus (d), greater correlations between TD versus ASD in left middle/superior temporal gyrus (e), and greater correlations between ASD versus TD in left cerebellum. Cluster labels, locations, and sizes are found in Table 1.

Cluster locations and sizes for within- and between-group FA-IQ correlations

TBSS maps were thresholded at p < 0.05 (corrected) and center of mass MNI coordinates and cluster size in cubic millimeters were tabulated. The nearest brain region to the 3D coordinate is labeled by referencing the Harvard-Oxford Cortical/Subcortical Structural Atlas and the Juelich Histological Atlas in FSL.
Next, a single additional TBSS analysis was conducted to identify voxels in which FA varied significantly (p < .05, corrected) differently between the TD and ASD groups. These regions can be visualized in Figure 1d–f and summarized in Table 1c & d. Areas where TD showed significantly greater FA compared to ASD (Table 1c) included right thalamus and cerebellum, and left cingulate, left IFG postcentral gyrus, precuneus, left middle and temporal gyrus (MTG/STG), left insula, and left inferior and superior parietal lobule. Conversely, areas where ASD showed significantly greater FA compared to TD (Table 1d) included right insula and right anterior cingulate, and left thalamus, left cerebellum, left precuneus, left postcentral gyrus, left supramarginal gyrus (SMG), left supplementary motor area, and left IFG and left SFG.
Finally, aside from group differences in FA-IQ correlations, overall group differences in FA included left STG (BA22) and right SFG where TD showed higher FA compared to ASD. More areas showed higher FA in ASD compared to TD, including left thalamus, IFG (BA47), MOG (BA18), SMG, precuneus, and right MFG, SFG, IFG (BA47).
Discussion
The relationship between brain structure and intellectual functioning in ASD is not well understood. Previous studies have investigated the relationship between ADI scores and fractional anisotropy (Cheung et al., Reference Cheung, Chua, Cheung, Khong, Tai, Wong and McAlonan2009) and have provided insight into the neural correlates of repetitive responses and other diagnostic features of ASD. However, it is apparent in clinical and neuropsychological testing environments that IQ exhibit wide variability in ASD. Therefore, we aimed to explore using DTI how white matter integrity correlates with IQ using a validated non-verbal IQ measure acquired with a computerized testing system. Since many children with ASD exhibit deficits related to both language and social cognition, this test proved easier to administer to completion than other verbal IQ measures involving more interaction with a neuropsychologist.
Separate within-group TBSS analyses were conducted in ASD and TD groups to find voxels where FA correlated with IQ. Although numerous large areas of white matter were found to correlate with IQ separately in each group, these analyses found mostly non-overlapping regions (<10%). In TD subjects, these regions included left and right hippocampus, cerebellum and pre- and post-central gyrii where higher FA mapped to higher IQ. ASD subjects however demonstrated mostly different regions of correlated FA and IQ (Figure 1a–c; Table 1b), including left SFG/IFG, right MFG, left Heschl's gyrus among others (Table 1b). The pattern of FA-IQ correlations found in the TD group is most like FA-IQ mappings in large-scale studies with healthy controls (Tamnes et al., Reference Tamnes, Ostby, Walhovd, Westlye, Due-Tonnessen and Fjell2010). These within-group analyses did not reveal which areas showed significantly different correlations of FA and IQ between TD and ASD so, to map these regions, a between-groups analysis was performed and indicated widespread differences with TD showing greater correlations compared to ASD subjects in left MTG/STG, parietal lobe, and right thalamus (Table 1c), while ASD subjects showed greater correlations compared to controls in left frontal lobe, right insula, left cerebellum, and left thalamus (Table 1d). The main conclusion to be drawn from both the within- and between-group analyses is that the ASD subjects show widespread differences in the relationship of FA with IQ, even at a corrected significance threshold (p < .05) commonly used in TBSS studies of ASD (Cheng et al., Reference Cheng, Chou, Chen, Fan, Decety and Lin2010). These differences are bilateral, and include cortical, subcortical, and cerebellar regions, suggesting that the altered relationship between white matter integrity and intellectual ability is not a focal, but a global, one. Our additional finding of increased FA with higher IQ in TD subjects in MTG/STG (Figure 1e) is consistent with reported decreases in white matter integrity related to language, particularly comprehension, in children with autism (Fletcher et al., Reference Fletcher, Whitaker, Tao, DuBray, Froehlich, Ravichandran and Lainhart2011).
There are several limitations of this exploratory study. First, we studied a small number of children in each group. Two of the subjects in our ASD group had Asperger syndrome and one was female, which added two additional elements of variability to an inherently variable diagnosis. If our ASD and TD groups had completely different (i.e., non-overlapping) IQ distributions, it would be impossible to know whether the differences in the relationship between IQ and FA for the two groups is an effect of the presence of ASD or an effect of the lower IQ of that group. However, while the mean of the two sets of IQ scores differed between the groups, the two IQ distributions overlapped by 60%, with only 4 TD subjects having IQ scores higher than the ASD subject with the highest IQ, and only 4 ASD subjects having IQ scores lower than the TD subject with the lowest IQ. Given that age and gender were matched, we believe these overlapping IQ distributions allow for valid inferences to be made from a FA-IQ covariates analysis. To confirm our exploratory findings, future TBSS investigations are warranted in a much larger sample of subjects with more overlap in the distribution of their IQ scores. Finally, the restricted age range of our sample should be considered when interpreting our results in the wider context of other DTI studies of ASD adolescent and adults where the relationship between white matter integrity and IQ may be different due to continued neurodevelopmental changes. The frontal lobes are known to demonstrate structural alterations even into late adolescence (Perrin et al., Reference Perrin, Leonard, Perron, Pike, Pitiot, Richer and Paus2009) and age is an important variable to consider when examining white matter changes in ASD (Ameis et al., Reference Ameis, Fan, Rockel, Voineskos, Lobaugh, Soorya and Anagnostou2011; Kleinhans et al., Reference Kleinhans, Pauley, Richards, Neuhaus, Martin, Corrigan and Dager2012). A wider age range should therefore be included as a covariate in larger, future studies of white matter and IQ.
Findings from our within- and between-group TBSS analyses show an altered relationship between white matter connectivity and IQ in ASD. Although exploratory and preliminary, this is a novel and important finding because it relates a brain connectivity metric implicated in ASD to a specific neuropsychological measure of intellectual abilities. White matter integrity and intellectual abilities vary widely in ASD, as known from separate reports, but the present study links these measures in the same subjects. Although no causal statements can be made about this relationship (e.g., impaired white matter microstructure causes lower IQ in ASD, or vice versa), the finding is suggestive of an altered developmental process. One biological process that could contribute to widespread differences in white matter integrity is neuroinflammation, and reports implicate increased microglial density and inflammation in ASD including frontal cortex and cerebellum (Morgan et al., Reference Morgan, Chana, Pardo, Achim, Semendeferi, Buckwalter and Everall2010). More research is needed to understand how these and other processes contribute to specific cognitive operations underlying intellectual abilities, and how white matter and IQ changes generalize to the larger ASD population.
Acknowledgments
The information in this manuscript and the manuscript itself has never been published either electronically or in print. The authors have no financial or other relationships that could be interpreted as a conflict of interest. We thank Vipulkumar S. Patel, RT, MR for help with MRI data collection, Benjamin Malmberg, for help with patient testing, Rebecca Simmons for assistance with data processing, and Michael S. Beauchamp, Ph.D. for helpful comments. This work was supported by NS046565 to Dr. Richard E. Frye, and the T.T. and W.F. Chao Family Foundation and John S. Dunn Research Foundation to Hai Li, Zhong Xue, and Stephen T.C. Wong.