


Introduction
The Larsen Ice Shelf extends on the eastern side of the Antarctic Peninsula from 65° S (from 64° S before 1995) to 74° S (Fig. 1). Because the mountain range of the Antarctic Peninsula acts as a barrier for the westerly winds, there is a pronounced gradient of precipitation rate from high values in the mountains to low values near the ice shelf. Surface mass balance on the northernmost sections of the Larsen Ice Shelf was slightly positive in the 1980s, but became negative in the 1990s (Reference Rott, Rack, Nagler and SkvarcaRott and others, 1998). One reason for this is the significant rise of mean summer temperatures during the last two decades, resulting in enhanced surface melt and run-off (Reference Skvarca, Rack, Rott and Ibarzabal y DonangeloSkvarca and others, 1998).
Location map of northern larsen Ice Shelf with ERS SAR image mosaic from 2 July 1992 (©ESA1992). Dashed lines show P-, S- and T-Profiles of field measurements.
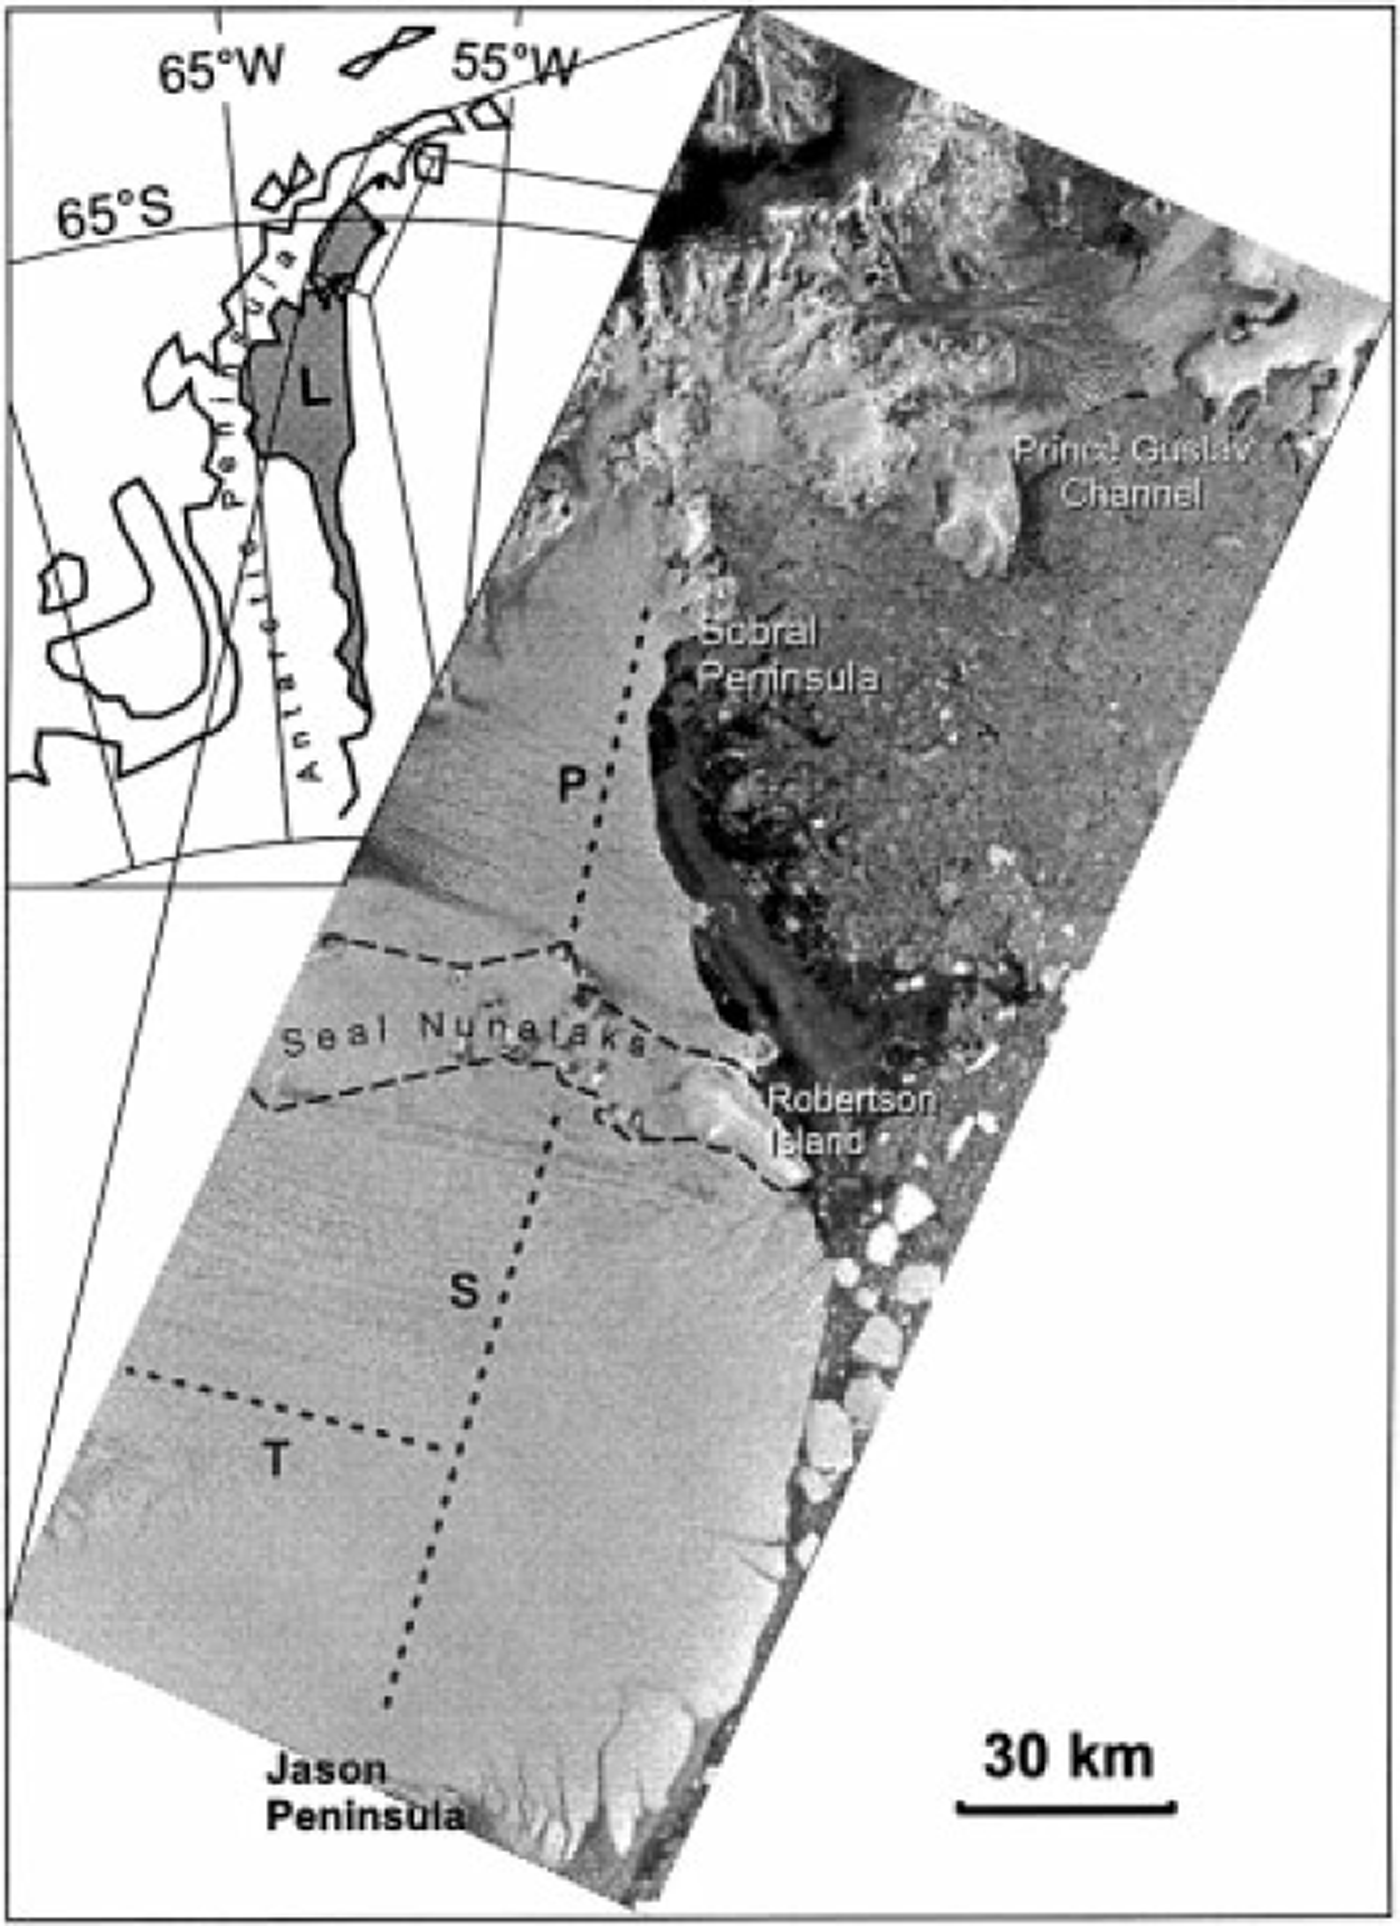
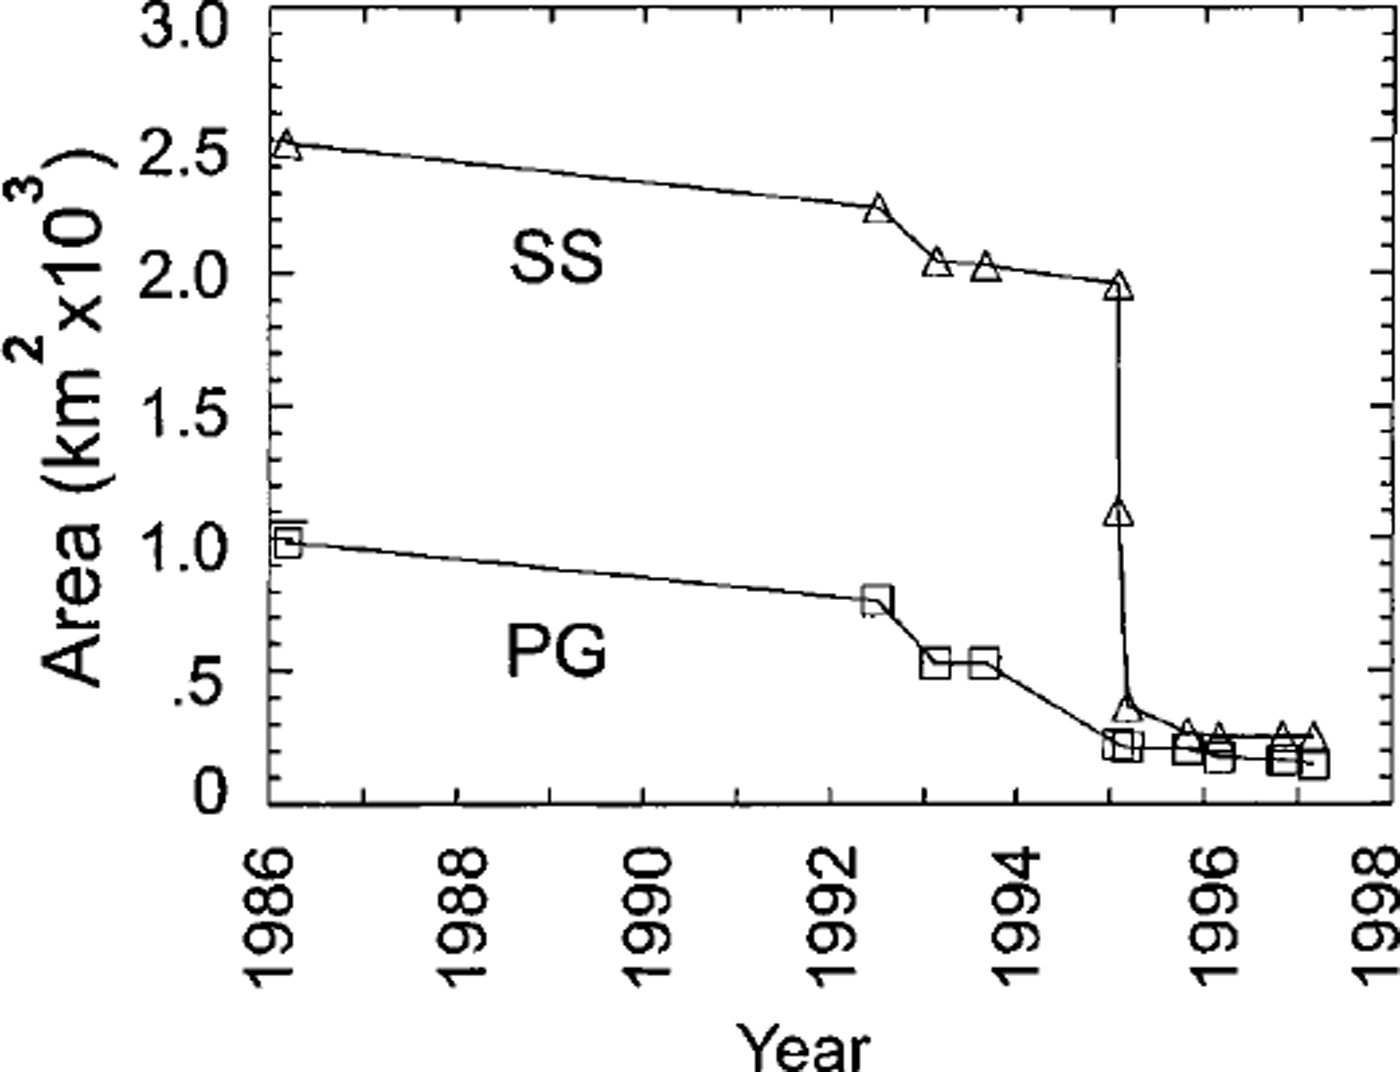
The northern Larsen Ice Shelf is considered to be very close to the climatic limit for the existence of ice shelves (Reference MercerMercer, 1978). Therefore it is very sensitive to climate change (Reference Vaughan and DoakeVaughan and Doake, 1996; Reference Rott, Rack, Nagler and SkvarcaRott and others, 1998). The ice shelf north of Seal Nunataks (65° S) retreated slowly but constantly during recent decades. The retreat culminated in the collapse of the ice-shelf section in Prince Gustav Channel (64° S) and of the section between Seal Nunataks and Sobral Peninsula (64.5° S) in early 1995, when 1600 km2 disintegrated within a few days. At the same time about 2300 km2 of ice calved from the section between Jason Peninsula (66° S) and Seal Nunataks (65° S) (Reference Rott, Skvarca and NaglerRott and others, 1996, Reference Rott, Rack, Nagler and Skvarca1998). Figure 2 shows a graph of the decrease of area of the two northernmost sections between 1986 and 1997. Model calculations (Reference Doake, Corr, Rott, Skvarca and YoungDoake and others, 1998) and recent observations also indicate that the ice shelf between Seal Nunataks and Jason Peninsula is no longer in equilibrium.
Decrease of tee-shelf areas in Prince Gustav Channel (PG) and between Sobral Peninsula and Seal Nunataks ( SS)from 1986 to 1997, derived from satellite images.
The finite-element model used to analyze the strain-rate patterns of the ice shelf between Sobral and Jason Peninsulas used ice thickness and comparatively coarse estimations of grounding-line velocities as input data (Reference Doake, Corr, Rott, Skvarca and YoungDoake and others, 1998). The model was not constrained by the field measurements of velocity because of the paucity of data. Motion fields derived from satellite data are able to provide basic measurements for the study of the ice-shelf dynamics and for model improvements. We calculated the ice motion for various ice-shelf sections from geocoded optical and radar satellite images, using a cross-correlation technique. Reference Bindschadler, Fahnestock, Skvarca and ScambosBindschadler and others (1994) derived the motion field for part of the section north of Seal Nunataks from optical satellite images for the interval 1975-89. We extend this period until August 1993 by the inclusion of Earth Resources Satellite (ERS) synthetic aperture radar (SAR) images, and also the areal coverage. Field data on ice motion are available for a transect north of Seal Nunataks and for two transects south of Seal Nunataks (Fig. 1). The analysis is complemented by studies of surface displacement by means of radar interferometric data from the ERS Tandem Mission in 1995.
Motion Analysis by Image Gross-Correlation
To derive the motion field, we used cloud-free Landsat data from 1986 to 1989 and ERS SAR images in Universal Transverse Mercator (UTM) projection. The images from repeat-pass orbits were co-registered with an accuracy of about 0.5 pixel using fixed targets such as nunataks in the ice shelf and rock outcrops on the peninsula. For ERS images we used a pixel size of 25 m x 25 m, corresponding to the nominal resolution with three looks; for the Thematic Mapper (TM) a pixel size of 28.5 m x 28.5 m; and for the Multispectral Scanner (MSS) a pixel size of 57 m x 57 m. The optimum temporal baseline for measuring surface displacement by non-coherent registration techniques depends on the magnitude of the ice motion and the stability of surface properties. The velocities on the ice-shelf sections under investigation range typically from 150 to 300ma−1. The snowpack properties in summer change rapidly as a result of melting and refreezing. The radar images also show a strong seasonal fluctuation in backscattering, with minimum a° values of-20 dB in summer (water-saturated snowpack) and up to OdB in winter (coarse-grained refrozen firn with ice lenses) (Reference Rott, Miller, Sturm and RackRott and others, 1994). However, some melt features preserve their shape over several years and retain a similar appearance throughout this period, especially when frozen.
After image co-registration, a two-dimensional cross-correlation algorithm in the image domain is applied to the non-filtered images. The size of the template window depends on the pixel resolution and is chosen so that the typical wavelength of surface features fits into the window. For every matched feature a reverse correlation was calculated to reduce the artifacts (Reference Scambos, Dutkiewicz, Wilson and BindschadlerScambos and others, 1992). The cross-correlation matrix is oversampled by a factor of 10 in both directions. A cubic spline function is used for interpolation. As the criterion for accepting the matching points a case-specific threshold is used.
For SAR data we obtained best results for motion analysis with images separated by lyear from winter to winter, when firn and ice were frozen.
Motion of the Ice Shelf in Prince Gustav Channel
To derive the ice motion in Prince Gustav Channel, Landsat TM images and ERS SAR images with pixel size of 25 mx 25 m were used. The velocity was calculated in a raster with 47 pixel intervals using a 71 × 71 pixel template-matching window. No field measurements are available from this part of the ice shelf.
Figure 3a shows the motion field derived from a Landsat TM image pair of 29 February 1988 and 5 November 1989. Vectors with a correlation coefficient higher than 0.3 are plotted. The main contribution was from the ice stream of Sjögren and Boydell Glaciers (S-B), coming down from the Antarctic Peninsula plateau. On the floating ice shelf it split into two branches, flowing towards the northern and southern fronts. The second largest contribution came from James Ross Island, but with much smaller velocities. The largest velocities, 420 ma−1, were detected on the northern branch. Even higher velocities would be expected near the grounding zone of S-B, but in this part the temporal change of features does not allow a motion analysis. In the central part of the southern branch, the velocity is about 270 m a−1. The flow pattern allows the identification of several sections (dashed line in Fig. 3a) according to the various tributaries (Reference Rott, Rack, Nagler and SkvarcaRott and others, 1998).
Motion field in Prince Gustav Channel, derived from (a) Landsat TM image pair of 29 February 1988 and 5 November 1989 and (b) ERS SAR image pair of 2 July 1992 and 26 August 1993. Dashed lines in (a) separate various ice-shelf zones.
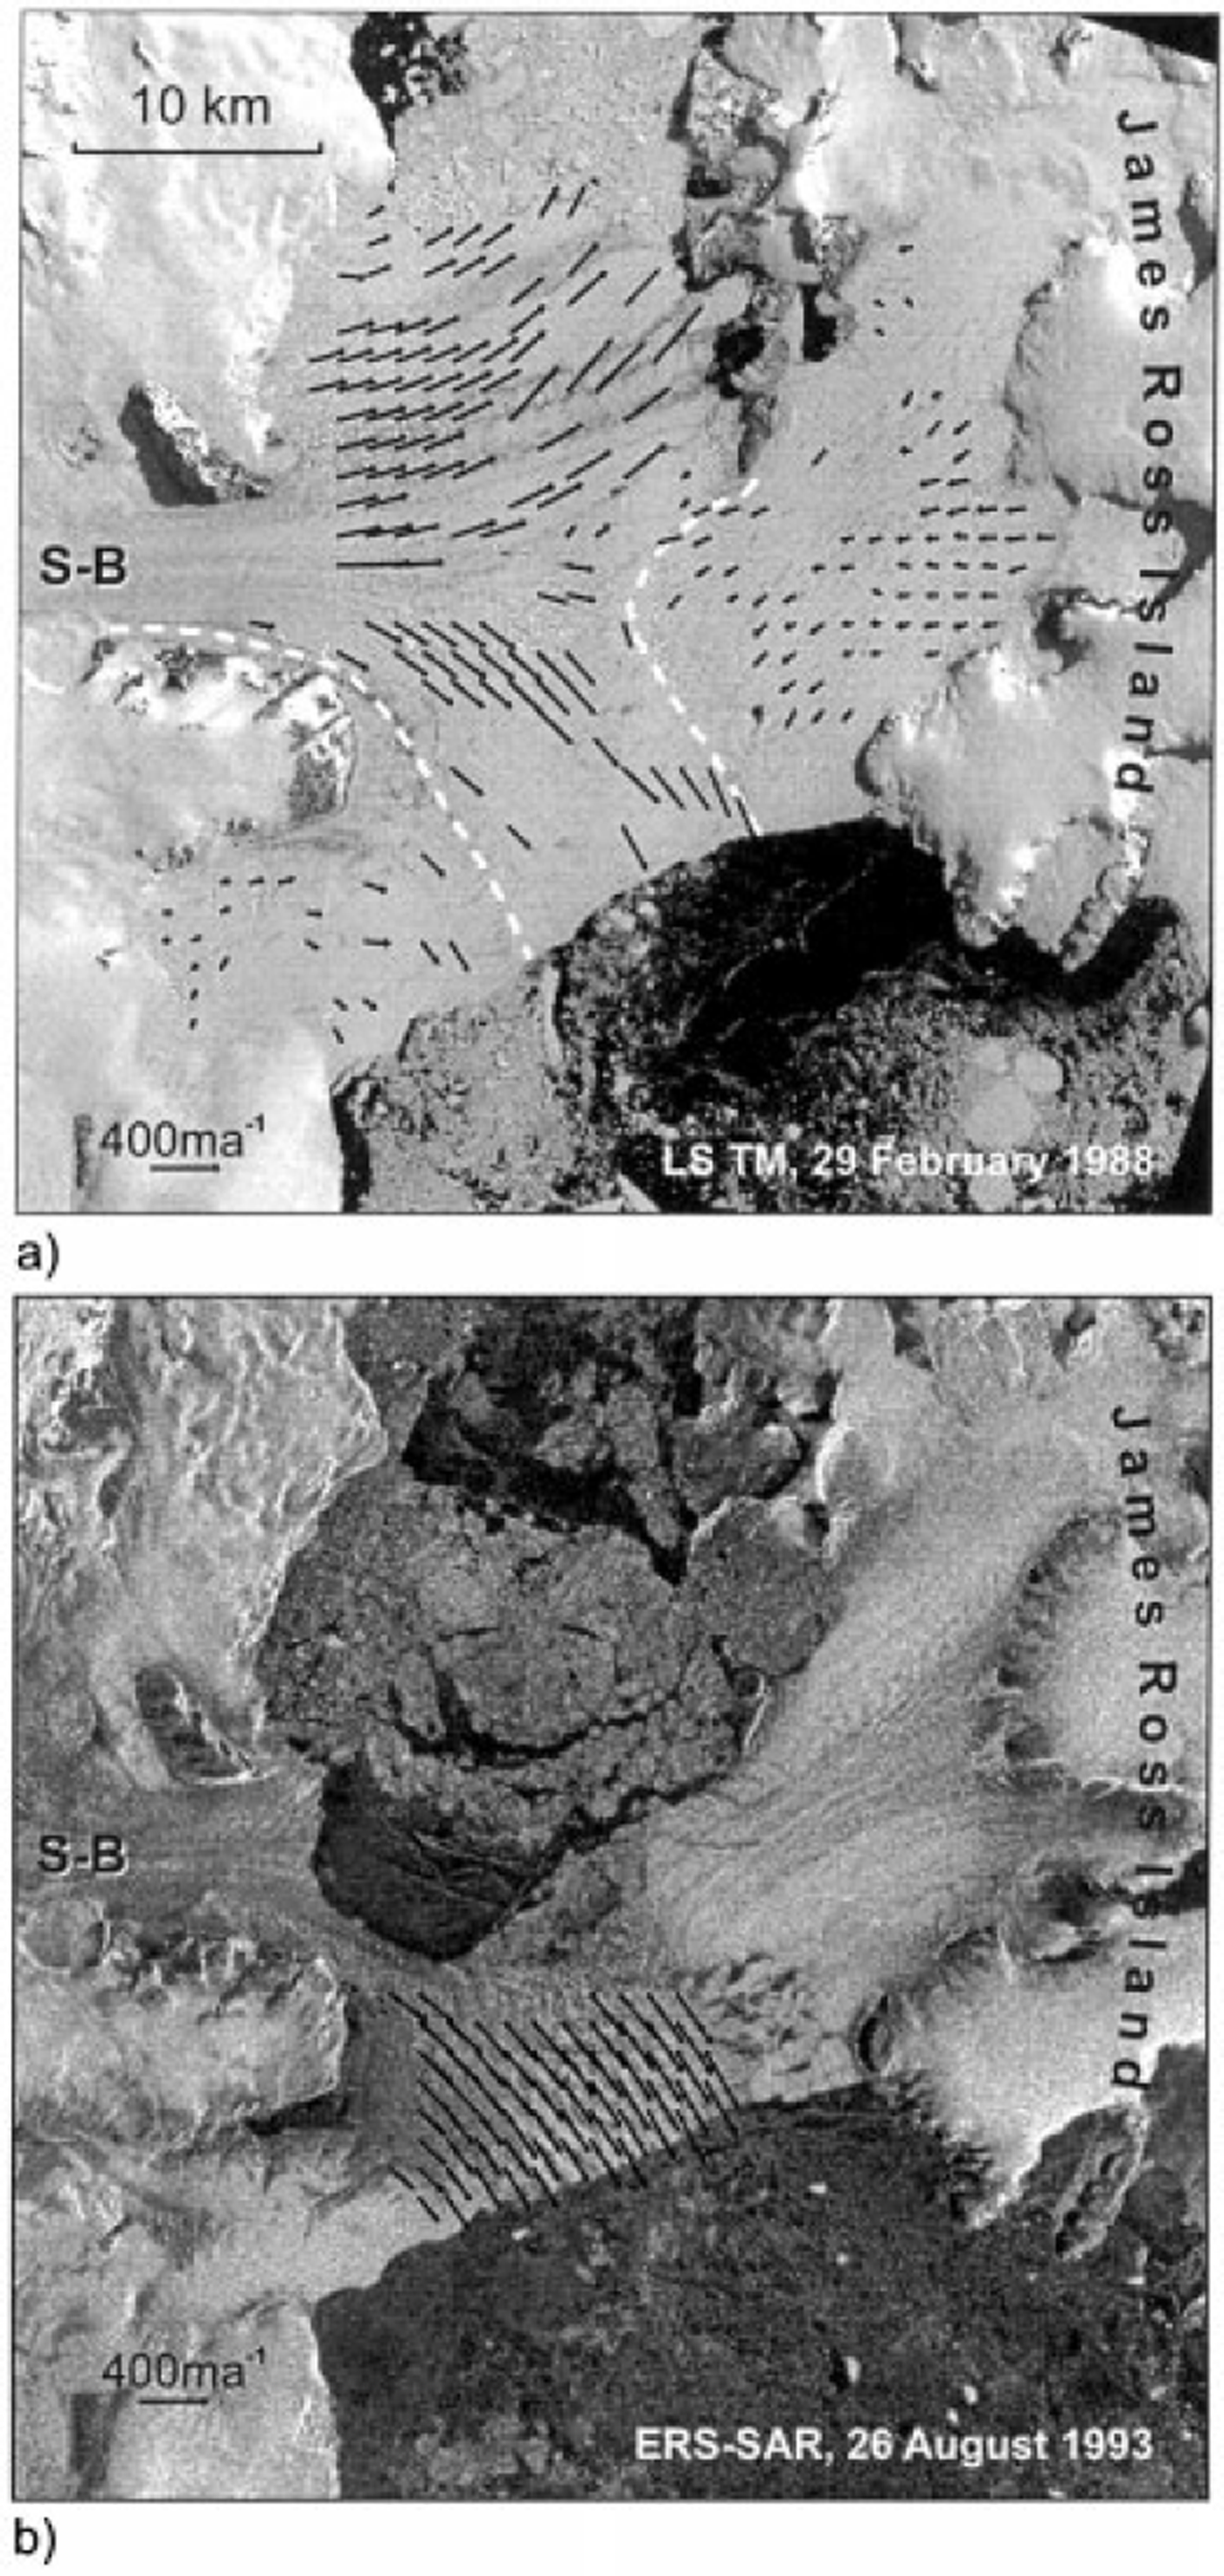
In summer 1992-93 the northern branch of the ice shelf disintegrated. Figure 3b shows the motion field of the remaining part, which was calculated from the ERS SAR image pair of 2 July 1992 and 26 August 1993. The comparison of velocities in the southern branch at the same gridpoints as for Figure 3a revealed an increase in velocity of 14% relative to the TM-denved velocities, which is probably an indicator of the onset of the disintegration process.
The Motion Field Between Seal Nunataks and Sobral Peninsula
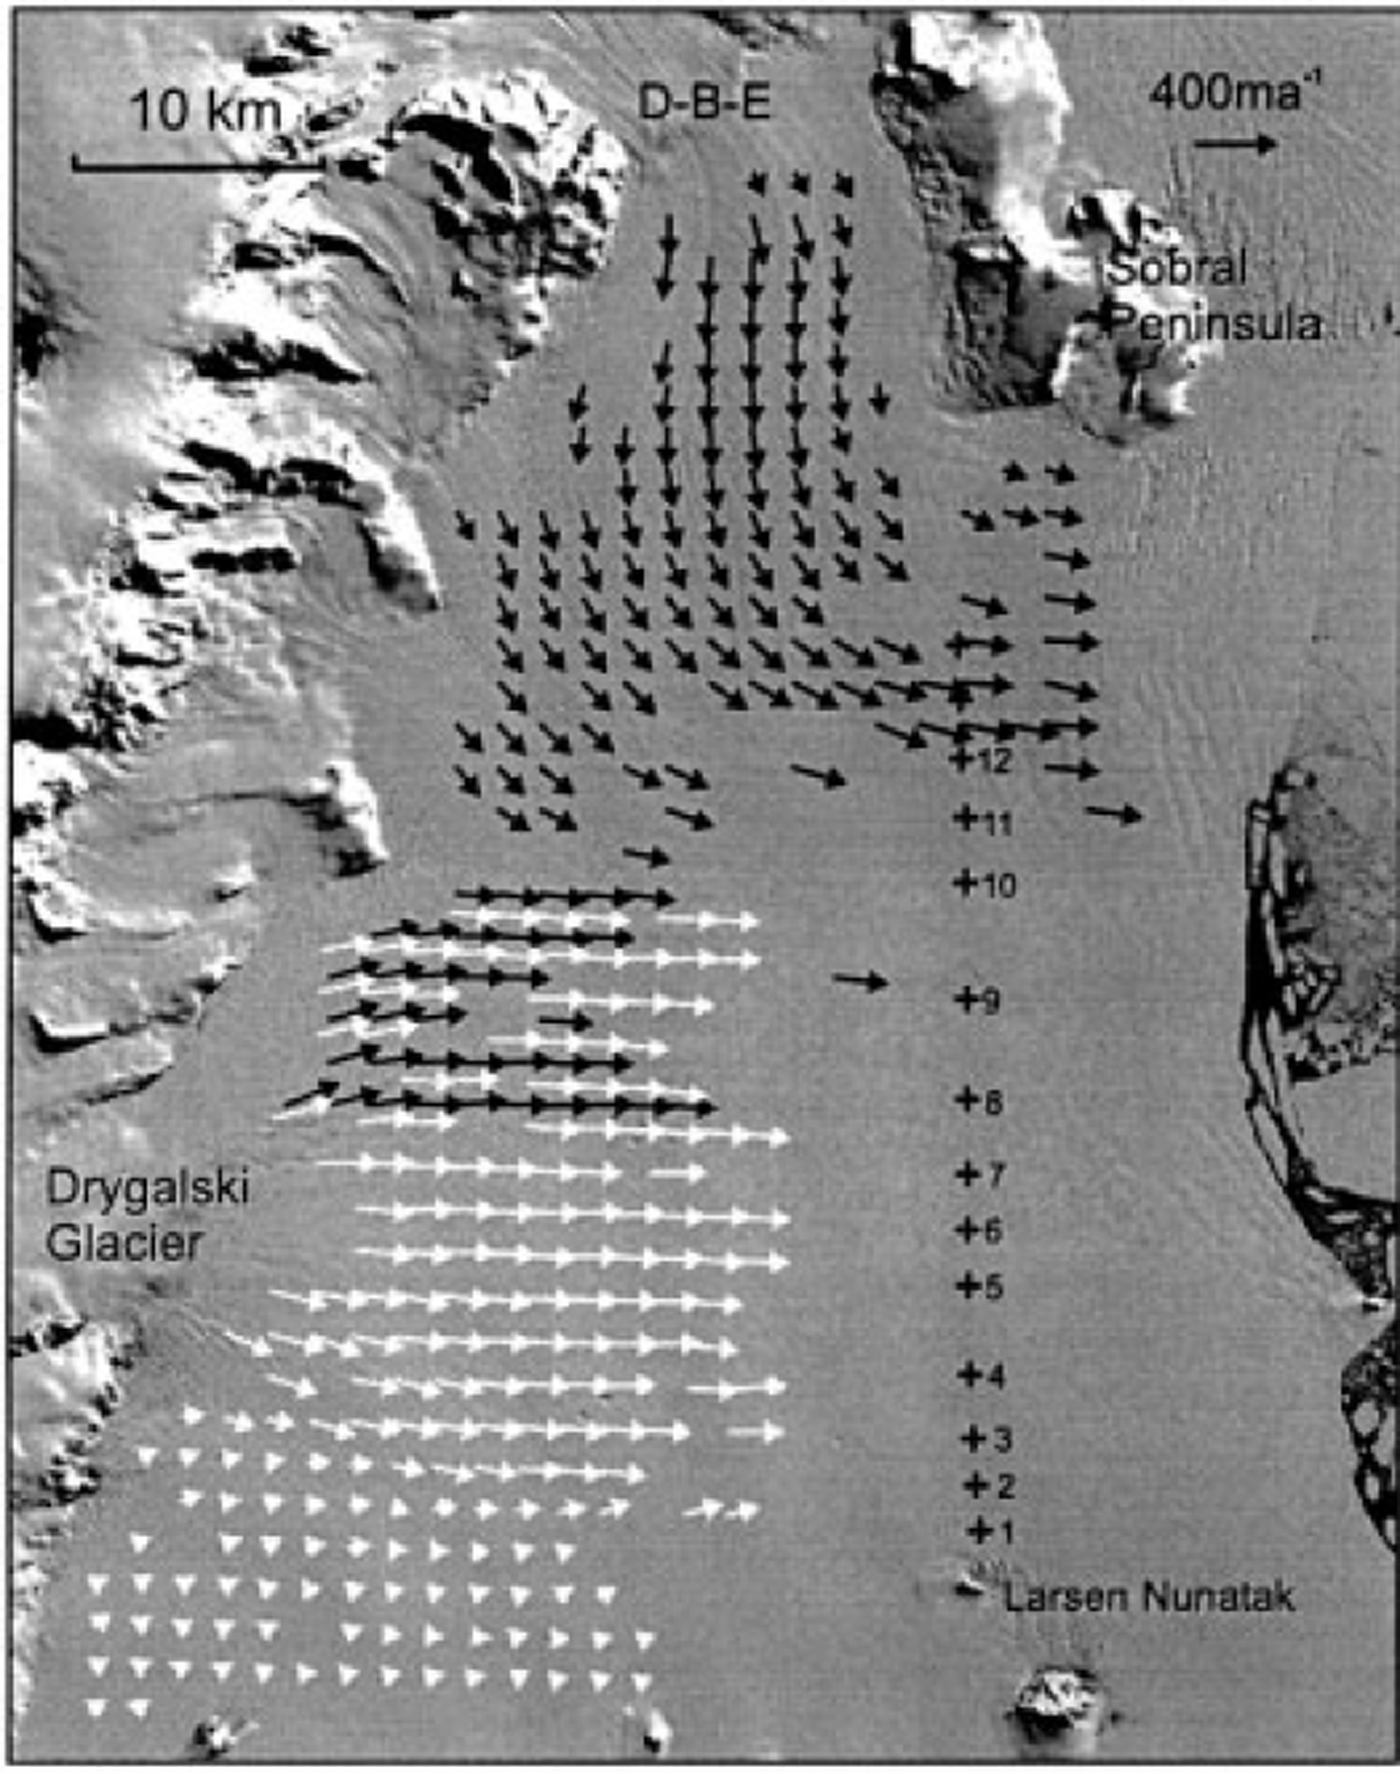
For the motion analysis between Seal Nunataks and Sobral Peninsula two optical image pairs (Landsat MSS, band-3, 1 March 1986, and Landsat TM, band-4, 5 November 1989; Landsat TM, band-4, 19 January 1988 and 8 January 1990) were used (Fig. 4), as well as one ERS SAR image pair (2 July 1992 and 26 August 1993; Fig. 5). The main ice discharge into this ice-shelf section was provided by Dinsmoor, Bombardier and Edgeworth Glaciers (D-B-E) and by Drygalski Glacier. In addition to the spatial distribution of the velocity vectors, the identification of temporal changes before the disintegration is of interest, as this section collapsed within just a few days.
Landsat MSS image (1 March 1986) with motion field north of Seal Nunataks. Black arrows: velocities derived from this image and the Landsat TM image of 5 November 1989. White arrows: motion field derived from the Landsat TM image pair of 19 January 1988 and 8 January 1990. Crosses show stake positions of P-Profile. D-B-E Dinsmoor-Bombardier-Edgeworth Glaciers.
ERS SAR image of the ice shelf north of Seal Nunataks from 2 July 1992, with motion vectors for 2 July 1992 to 26 August 1993. The dashed line shows the ice edge in August 1993. D-B-E: Dinsmoor-Bombardier-Edgeworth Glaciers. (©ESA1992.)
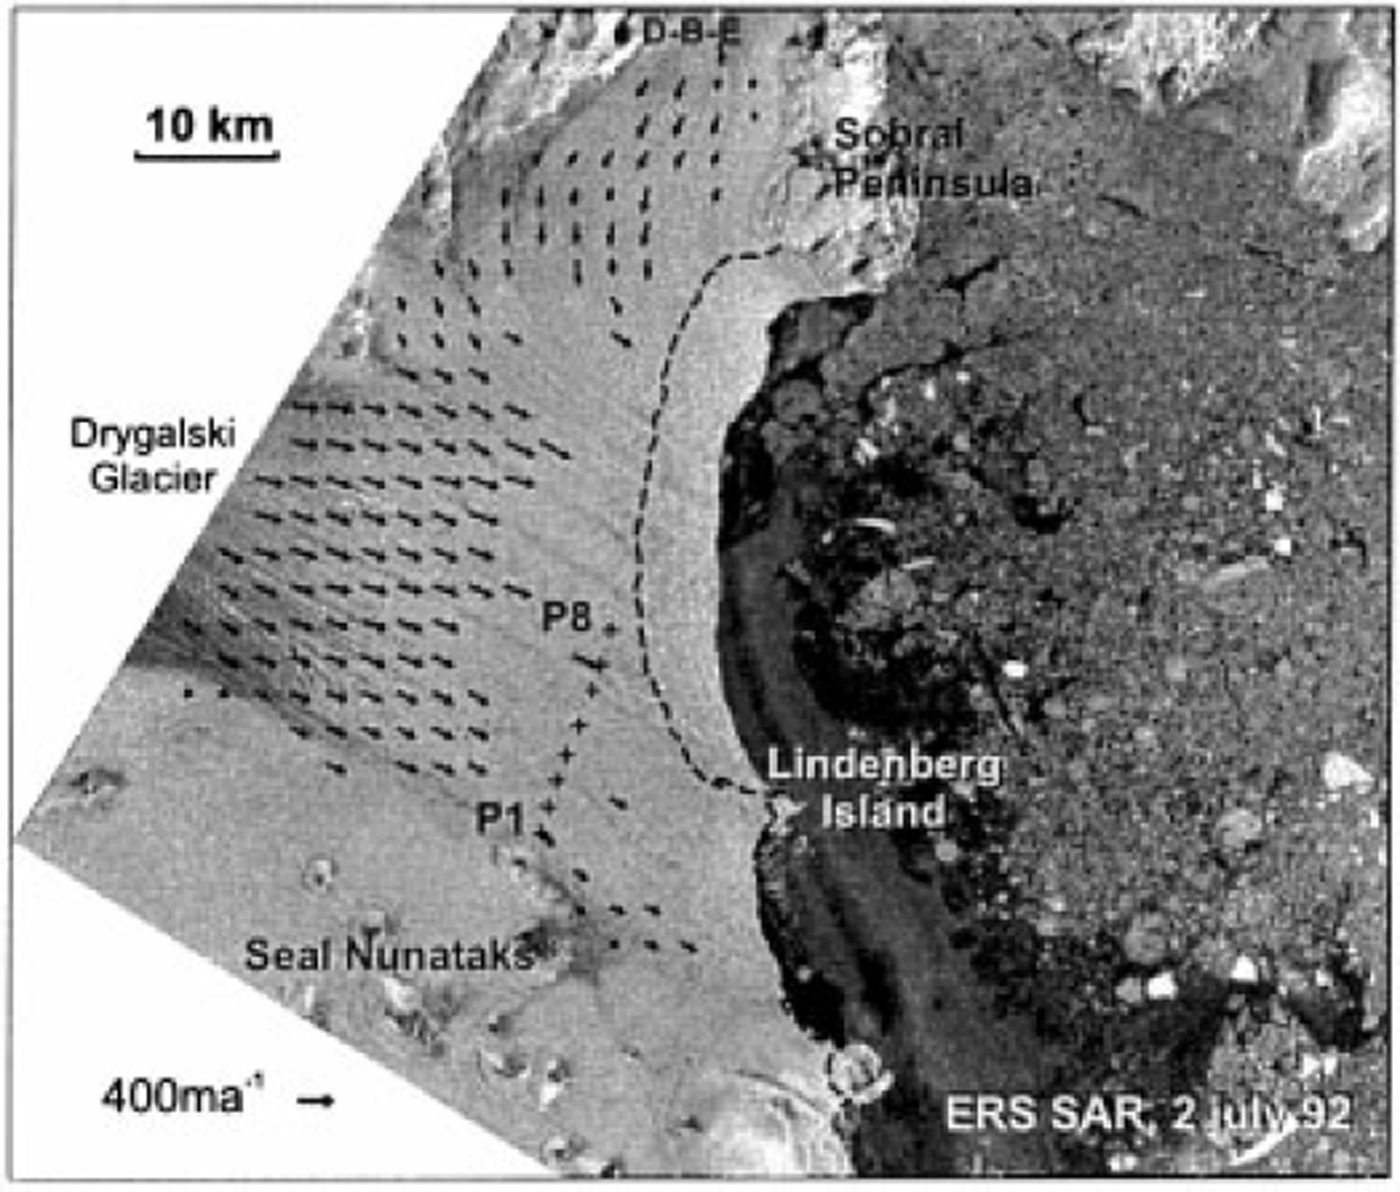
The Landsat TM image from November 1989 extends only to the central flowline of Drygalski Glacier, intersecting the ice edge slightly north of Lindenberg Island. To obtain control points for the image co-registration, we merged this image with the Landsat TM image from 19 January 1988. In the cross-correlation algorithm we used a window size of 31 x 31 pixels and a threshold of 0.3 for the correlation. The velocity of the southern part of the P-profile was measured during a period of 16 days in October-November 1994. The northern part of the profile had already broken away in 1992. The velocities between PI and P8 (2.2 and 17.5 km north of Larsen Nunatak, respectively) for the 16 day period ranged from 0.63 to 0.68 m f 1 (230-248 m a−1). A wooden stake, set in November 1984, was found about 1 km from P8 in November 1994. The mean velocity for the 10 year period at this stake was 252 m a−1. This is almost the same as the short-term velocity in November 1994, though this does not imply that the velocity was constant throughout the period. The points nearest to P8 for which cross-correlation was possible with the Landsat image pair of 1986 and 1989 are located about 8 km upstream and give velocities of 237 m a−1. This suggests that the velocity was comparatively stable in the long term. The small difference between the satellite analysis and field observations may be an effect of the different locations, as well as of some temporal variability. The motion analysis of Reference Bindschadler, Fahnestock, Skvarca and ScambosBindschadler and others (1994), based on the MSS image from 1986 and the TM image north of Lindenberg Island from 1989, gives the same values.
The motion field betweenJuly 1992 and August 1993 was calculated from the SAR images with a matching window size of 51 × 51 pixels. A dense raster of motion vectors could be derived for the western part of the ice shelf. Close to the front the correlation between the two images was poorer because of changes in surface features. Compared with the velocity field from Landsat data, these motion vectors show somewhat higher spatial variability. North of Larsen Nunatak a shear zone was identified, where the velocity reached 204 m adjust 1.5 km north of the nunatak. The SAR-derived velocities are about 10% higher than the TM-derived velocities. For example, 8 km upstream of stake P8 a velocity of 259 ma−1 was derived from the SAR image pair of 1992 and 1993. This increased motion could be due to a slight increase of velocity between the two periods. Such an increase was also measured at the only stake which was preserved from the 1991 measurement Campaign, slightly downstream from stakes P5 and P6. However, at this stake the mean velocity for the period November 1991-October 1994 was 8% higher than at P5 and P6 for the short-term measurement in October-November 1994. This difference may be due to seasonal variations of velocity of the rifted ice shelf. In 1994 a large number of crevasses and narrow rifts were observed on the ice shelf. Therefore it can be assumed that the increase of average velocity during 1991-94 can be attributed mainly to the summer and autumn seasons when, because of melting and refreezing, the rifts and crevasses widen. A similar effect was observed on the section south of Seal Nunataks when, after 1994, in association with the opening of rifts, the velocities at the transverse profile increased by 10-20% (Reference Rott, Rack, Nagler and SkvarcaRott and others, 1998).
Radar Interferometry
In addition to the cross-correlation analysis, the motion of the input glaciers and the displacement of the ice shelf were studied by means of SAR interferometry. Interferometric SAR measures the phase differences between two repeat-pass SAR images, which are acquired from slightly different satellite positions. The phase differences result from the surface displacement (motion) during the time interval between the acquisition of two images and from topography. The sensitivity to topography depends on the distance between the satellite positions of the two images (baseline) (Reference Joughin, Winebrenner, Fahnestock, Kwok and KrabillJoughin and others, 1996). Our analysis is based on an interferogram which was calculated from SAR data from the ERS-1/2 Tandem Mission of 31 October 1995 (1251 UTC) and 1 November 1995 (1251 UTC). The baseline of this tandem pair is 26 m, which corresponds to a topographic sensitivity of 365 m per phase cycle of 2π (this is one color cycle or "fringe" in Figure 6a) for non-moving targets. Due to this short baseline, the topographic phase can be neglected for the motion analysis on the ice shelf. In the scene center, one fringe corresponds to a horizontal displacement of 73 mm in ground range and to a vertical displacement of 31 mm per fringe (Reference Joughin, Kwok and FahnestockJoughin and others, 1998). The phase correlation between the two images was high, the mean degree of coherence over the ice shelf being 0.8. Interferometric analysis was not possible for the sections which disintegrated in January 1995, because only 35 day repeat images are available which completely decorrelate.
(a) Interferogram of the area around Seal Nunataks from the ERS Tandem Mission (31 October and 1 November 1995). The position of stake LI and the flow direction are indicated. IR, ice rise. Nunataks: Bull (Bu), Bruce (Br), Larsen ( La), Pedersen (Pe). The mterferometrically derived hinge line is plotted on the Landsat TM image from 19 January 1988(b).
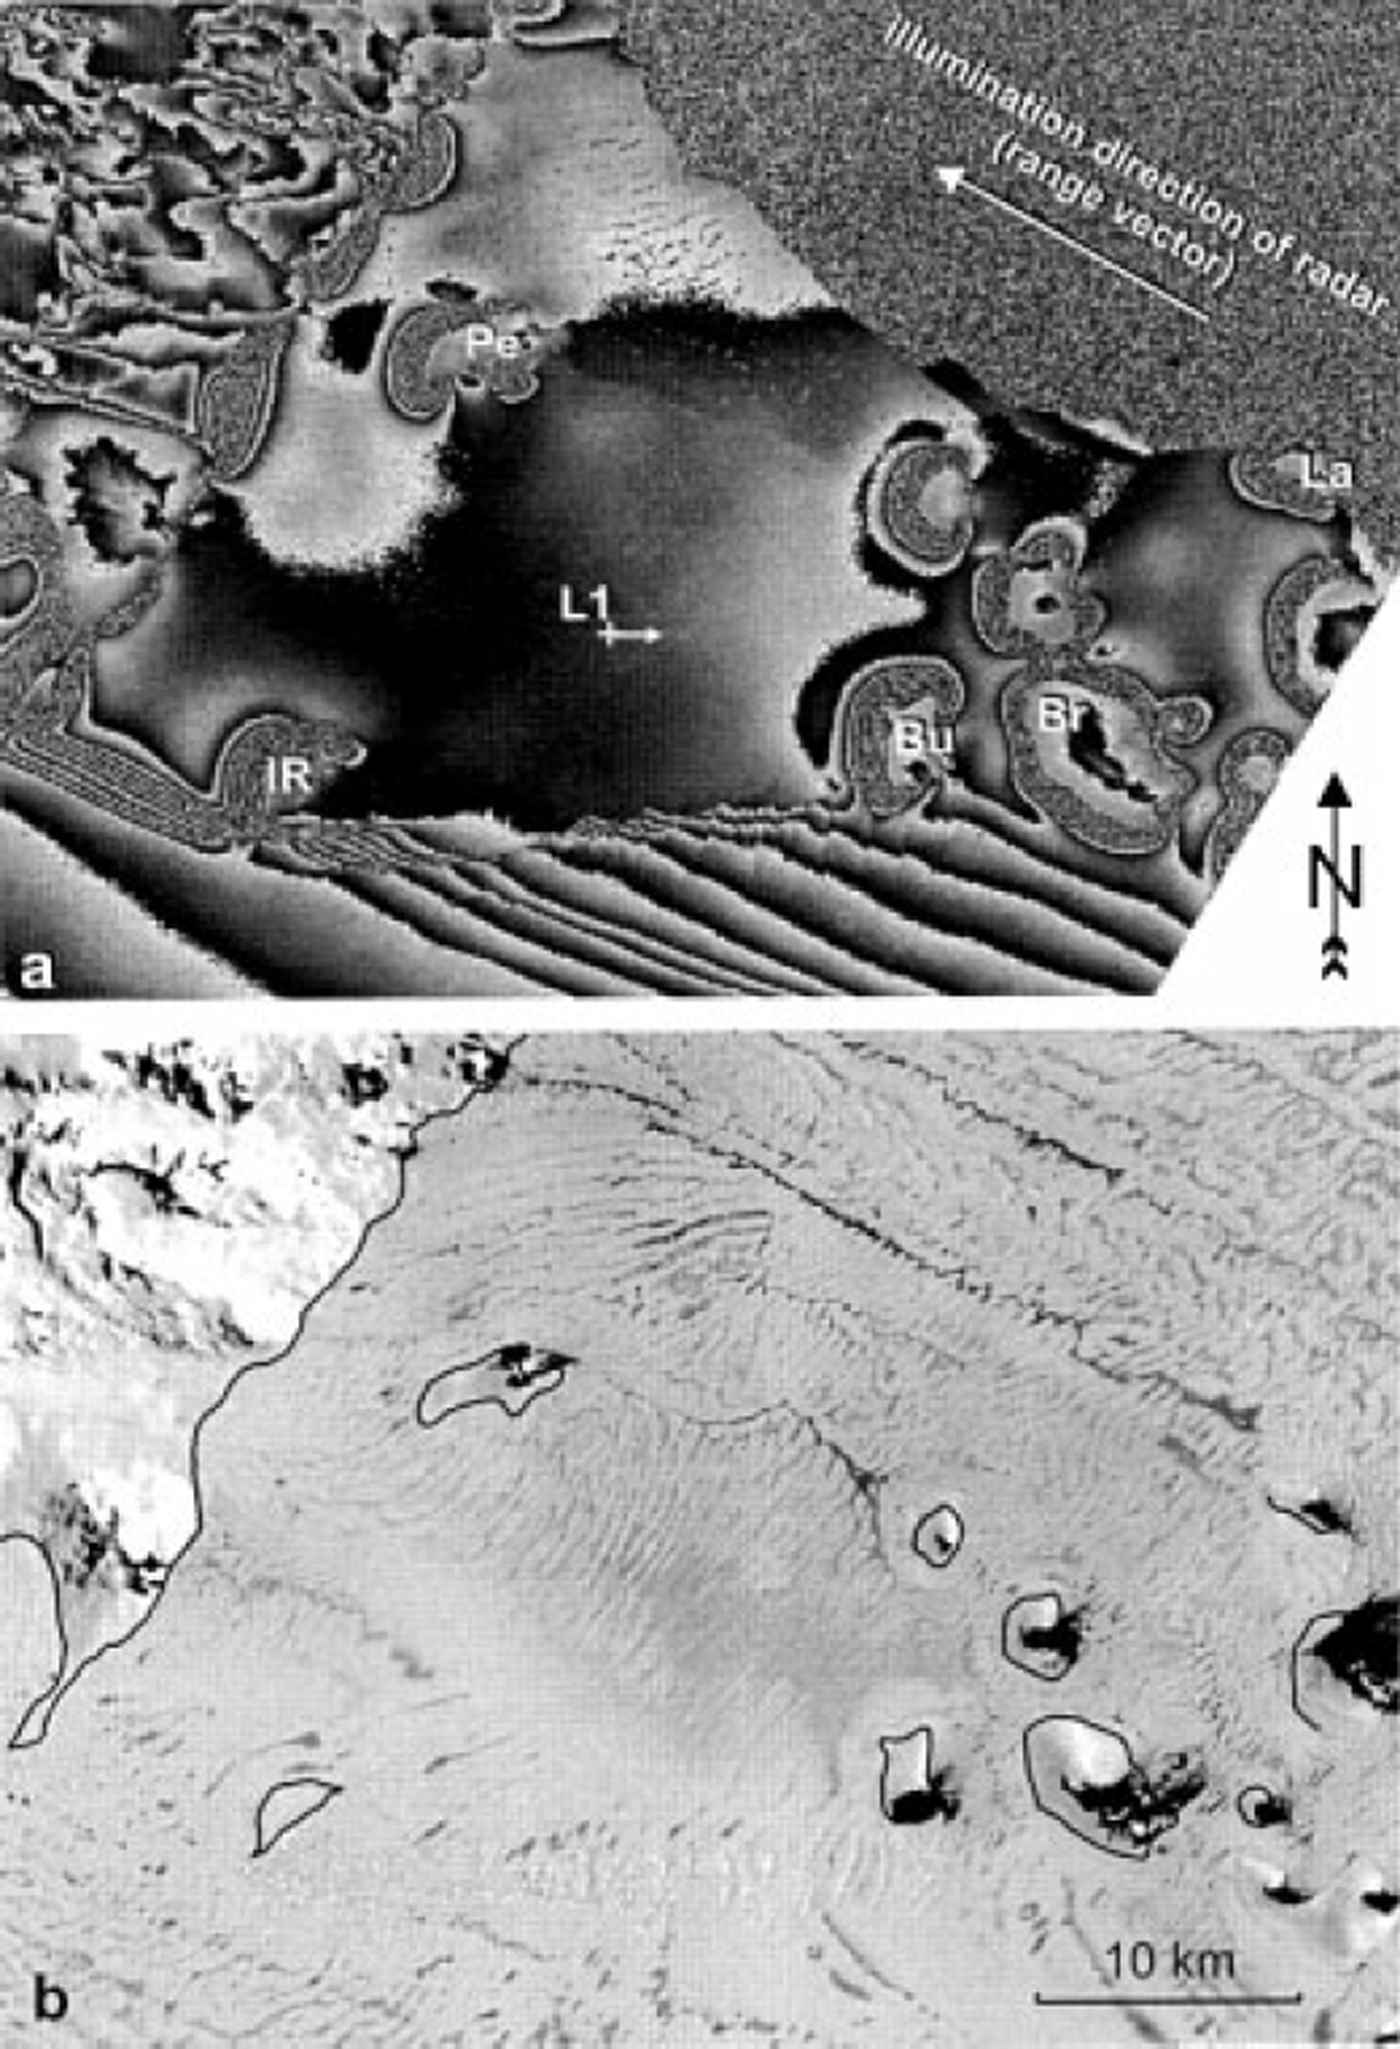
As an example, we show a section of the interferogram for the area around Seal Nunataks (Fig.6a), co-registered to the geocoded ellipsoid-corrected (GEC) SAR image, which is available for the same date. Figure 6b shows the same area in a Landsat TM image from 19 January 1988. The dark patterns are typical summer-melt features. The western, windward slopes of the nunataks are covered by thick ice bulges, whereas the lee sides are largely free of ice, and the ice shelf below is flat and covered by bare ice. The area around Seal Nunataks is an almost stagnant part of the ice shelf, which is separated from the open ocean by the ice-covered Robertson Island (Fig. 1). After the collapse of the ice shelf to the north, this section became the northern limit of the Larsen Ice Shelf. In the late 1970s a network of stakes was installed at LI (Fig. 6). From the surface elevation an ice thickness of 175 m is calculated for this site under the assumption of hydrostatic equilibrium. Between Bruce and Larsen Nunataks an ice thickness of 173 m was measured in 1996 by means of a monopulse radar. The velocity at LI was 23.4ma−1 between October 1996 and 1997, while the ice velocity between Murdoch and Larsen Nunatak is around 10 ma−1.
In Figure 6a the effects of vertical displacement due to the tides are clearly visible. The nunataks are almost completely surrounded by a closed sequence of 10-11 fringes, indicating the zone of tidal flexure which marks the transition from grounded to floating ice. Discontinuities in the fringe sequence are obvious at the western or southwestern boundary of some of the nunataks, indicating an abrupt transition from the nunatak to the ice shelf. Analysis of the fringe pattern (phase unwrapping) reveals a vertical displacement of 0.34-0.35 m for the floating parts of the ice shelf which are not moving horizontally. This is in good agreement with the tide forecast for Larsen Nunatak, which gives a 0.36 m height difference between the two SAR acquisitions. The inner circles of tidal flexure from the interferogram are drawn as hinge lines on the Landsat TM image in Figure 6b.
The interferogram shows a pronounced shear zone along the boundary of the almost stagnant ice shelf around the nunataks and the ice-shelf section to its south. The section north of the shear zone receives ice from a glacier coming down from the peninsula west of Pedersen Nunatak. A velocity of about 0.20 m d"1 (73 m a−1) was derived by interferometry for the center of the glacier above the grounding zone, showing that the mass flux into this ice-shelf section is rather small. In earlier years, when surface melt was less pronounced, in situ accumulation played an important role. However, the observations of negative surface mass balance during the last decade suggest that this ice-shelf section may not survive very long (Reference Rott, Rack, Nagler and SkvarcaRott and others, 1998).
In the heavily crevassed shear zone between the ice rise (IR) and Bull Nunatak the fringe pattern is discontinuous, which is an indication of rifting described by Reference SkvarcaSkvarca (1994). This rift will be relevant for a possible future disintegration process. The fast-flowing ice to the south of this shear zone is fed by inflow from Hektoria and Evans Glaciers, which have an interferometrically determined velocity of about 1 md−1 in the center above the grounding zone. At stake SI, 15 km south of Bruce Nunatak (Br), a velocity of 0.88 md−1 (322 ma−1) was measured between October 1994 and 1996. Taking a point on the ice shelf between Bruce Nunatak and Bull Nunatak (Bu) as reference, ten fringes are counted along the line between this point and SI. If the horizontal motion at the reference point is zero and the tidal displacement is the same at both points, this would correspond to a horizontal motion of 0.75 md−1 (274ma−1) at SI, taking into account the angular shift of 13° between the motion vector and the SAR look direction. The difference between satellite analysis and field measurement of 0.13 md−1 suggests that the assumptions made above are not fully valid. For example, a phase shift due to horizontal displacement of 130 mm is equivalent to a vertical displacement of 55 mm. Such a difference is certainly possible. Temporal variations of horizontal motion also cannot be excluded, because data from measurement intervals of lday in spring, when the ice was still frozen, and 2 years are compared.
On the central part of the ice shelf south of Seal Nunataks, the T-profile was installed along a flowline of Crane Glacier (Fig. 1). In a narrow part just above the grounding zone, this glacier reaches a maximum velocity of about 1.8 md−1 (657 ma−1), as derived from the interferogram. An even higher velocity was determined for Drygalski Glacier, the main input glacier to the former ice-shelf section north of Seal Nunataks, with 2.3 md−1 (840ma−1) close to the grounding zone.
Conclusions
The motion fields of two sections of the northern Larsen Ice Shelf, which disintegrated in 1995, were calculated by a cross-correlation method. Optical image data were used from 1986-89 and 1988-89, and ERS SAR images from 1992-93. For ERS SAR images, best results are obtained with winter images with a time difference of lyear. Comparisons with field measurements of motion, which are available for a few points, show differences of a few per cent. These may result from temporal variations of velocity because the observation periods for the satellite analysis and field measurements differ. The satellite measurements show a slight increase of velocity for 1992-93 compared to the previous periods, as crevasses and rifts opened before the final disintegration.
For the ice shelf around Seal Nunataks and to the south, down to Jason Peninsula, an interferometric image pair from the ERS-1/2 Tandem Mission was processed. The pattern of surface displacement was derived with great detail, but additional image pairs or complementary information from other sources is needed to separate the phase contributions accurately due to tidal displacement, horizontal velocity and topography. Nevertheless, the preliminary analysis reveals interesting features of deformation in the grounding zones, and complex patterns of ice flow. Ongoing investigations, using SAR interferometry and image cross-correlation in synergy with field measurements of velocity, are focusing on this ice-shelf section, which is presently the northernmost section of the Larsen Ice Shelf and which has been subject to intense fracturing for the past few years.
The satellite-derived velocity maps enable the separation of the contributions from the various tributary glaciers on the ice shelf and provide basic data for the analysis of strain-rate patterns and for ice-dynamic models. In addition, the interferometric analysis results in a detailed image of the shear zones and rifts on the ice shelf, as well as of the motion fields of the input glaciers. The complexity of ice deformation in the grounding zones and in the shear zones, as well as the high velocities of the input glaciers, clearly show that the models of ice-shelf dynamics still miss complex processes which play a key role in ice-shelf disintegration. SAR interferometry is able to provide unique observational data for improved understanding of these processes.
Acknowledgements
This work is a contribution to the Austrian Science Fund (FWF) Project No. 12923 GEO, and the Larsen Ice Shelf Project of Institute Antartico Argentino, Direccion Nacional del Antartico. The ERS SAR data were kindly made available by the European Space Agency (ESA) for the experiment AO2.A101. We express our thanks toJ.G. Ferrigno and R. S. Williams, Jr of the U. S. Geological Survey for providing the LandsatTM image of 1988, and to E. Donofrio of Servicio de Hidrografia Naval, Armada Argentina, for providing the tide forecast.



