


Introduction
The 3028 m long GRIP (Greenland Icecore Project) ice core was drilled in 1989-92 at Summit (72˚34’N 37˚37’W), Greenland (GRIP Members, 1993). The Bølling-Allerød period (Greenland Interstadial 1) is found more than halfway down the ice sheet, at ∼1700m depth, where the annual-layer thickness is about 4-6 cm.
The GRIP ice core constitutes a continuous archive of snow and ice, which gives information on past climate in Greenland back to ∼120000years BP. Precise dating of the ice core is essential to gain knowledge of climate variability through time. The stratigraphical dating of the GRIP ice core is based on annual-layer counting using δ18O, Ca2+ and NH4 + profiles back to the transition between the last glacial period and the Holocene (Reference Fuhrer, Neftel, Anklin and MaggiFuhrer and others, 1993, Reference Fuhrer, Neftel, Anklin, Staffelbach and Legrand1996; Reference Johnsen, Clausen, Jouzel, Schwander, Sveinbjörnsdóttir, White, Wettlaufer, Dash and UntersteinerJohnsen and others, 1999). For older ice, counting has been performed on seasonal variations of dust concentrations back to 60 000 years BP (The Greenland Summit Ice Cores CD-ROM, 1997; Hammer, in press). Modelled timescales are available down to the Eemian (Reference JohnsenJohnsen and others, 2001).
The annual counting of dust concentrations has given estimated durations of the Bølling and Allerød of 1432 and 736 years, respectively (Hammer, in press). As dust is brought to Greenland by storms, peaks in dust are, however, likely to represent depositional events, rather than annuality. Due to this, dust may show ‘double peaks’ within one year. When having only this parameter for dating, there is therefore a risk of overestimating the number of years. Motivated by this fact, this study was set up to include as many independent parameters as possible in the dating, all measured in high resolution and showing seasonal variations. These parameters include Ca2+ and NH4 + (Reference Fuhrer, Neftel, Anklin and MaggiFuhrer and others, 1993, Reference Fuhrer, Neftel, Anklin, Staffelbach and Legrand1996), dust and NO3– (Hammer, in press) existing for the whole period of investigation, and new sections of δD and δ18O. The main focus has been on the stable-isotope profiles, as they are known to be ideal tools for dating ice cores under favourable conditions. They show a strong seasonal cycle, with high values during summer and low values during winter. However, diffusion of isotopes in the firn and ice leads to a smoothed isotope profile as time passes (Reference JohnsenJohnsen, 1977; Reference Johnsen, Clausen, Cuffey, Hoffmann, Schwander, Creyts and HondohJohnsen and others, 2000). Hereby the vulnerable annual cycle is weakened at greater depths. The diffusion process in the firn is dependent on temperature and annual accumulation rates. For the annual cycle to survive the densification process in Greenland, the annual accumulation rate has to be greater than ∼0.2m ice a–1 (Reference JohnsenJohnsen, 1977). At present at the GRIP site, the accumulation rate is ∼0.23 m ice a-1 and the average annual temperature is -32˚C (Reference JohnsenJohnsen and others, 1992).
Until now, stable isotopes have not been used as a dating tool within the glacial period, partly because of low accumulation during glacial times, which speeds up the smoothing of the isotope profile, and partly because of the thin annual layers, which require a high sampling rate. The Bølling-Allerød interstadial was characterized by a warmer climate and a higher accumulation rate than during the rest of the glacial period (Reference Johnsen, Dahl-Jensen, Dansgaard and GundestrupJohnsen and others, 1995), which is promising for retaining the annual cycle. It is hoped that this study will show whether it is feasible to use stable isotopes for dating purposes within the Bølling-Allerød interstadial.
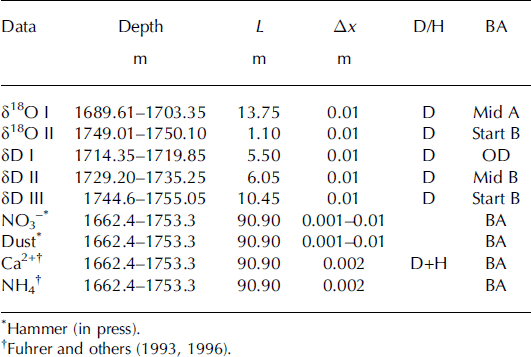
New data presented in this study are high-resolution (1 cm) δD and δ18O profiles, from sections of the Bølling-Allerød interstadial in the GRIP ice core. The stable-isotope series are sampled from ∼1700 m depth. There are three intervals of detailed δD, covering a total of 22 m of ice, and two intervals of δ18O, covering 14.85 m of ice (Table 1; Fig. 1). The stable-isotope profiles have been deconvoluted to correct for diffusion in the firn and ice. The aim of this study is to investigate whether it is possible to retrieve the annual signal in the isotope data from this depth of the GRIP core and, if so, to estimate the duration of the Bølling-Allerød interstadial, by counting annual cycles in these new data together with annual cycles seen in available high-resolution series of Ca2+, NH4 +, NO3– and dust.
Depth intervals of the data from the GRIP ice core used for annual counting of the Bølling-Allerød. L is the length of each data interval, Ax is the sample interval of the data series, D indicates data that have been deconvoluted, and H data that have been high-pass filtered. The column BA shows which part of the Bølling (B), Older Dryas (OD) or Allerød (A) the series covers. The depths 1753.3 and 1662.4 m are taken as the onset of the Bølling and the termination of the Allerød, respectively. The depth interval of the Older Dryas is defined to be 1715.0-1718.6m. See text for explanation
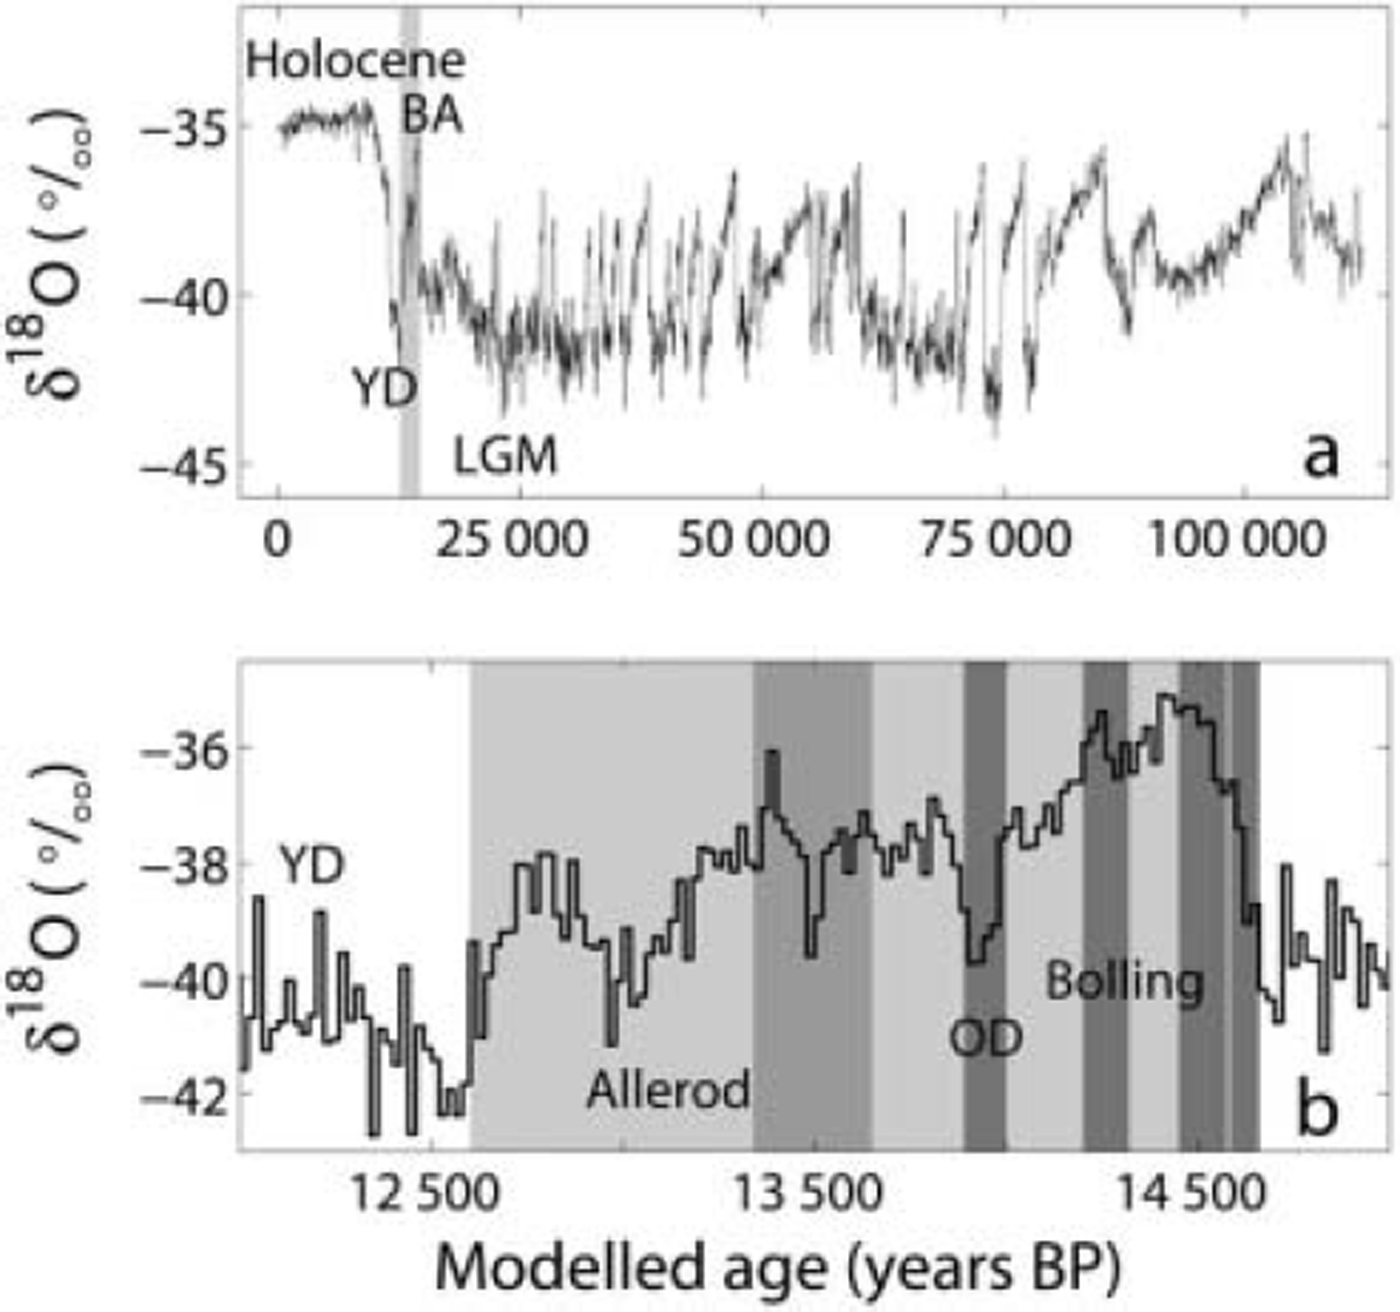
δ18O profiles on a modelled timescale (ss09sea) (Reference JohnsenJohnsen and others, 2001). (a) 50 year averages of δ18O. The Bølling–Allerød (BA, light-grey band) is the last interstadial (GI event 1) before the cold Younger Dryas (YD) and the subsequent warming in the Pre-Boreal of the Holocene. LGM: Last Glacial Maximum. (b) Zoom of the investigated interval (coloured area): 20 year averages of δ18O. The three dark-grey bands indicate the intervals where ice has been sampled and analyzed for δD in high resolution to retrieve annual layers and improve the dating of the climate period. The two medium dark areas show the intervals where detailed δ18O is included in the dating. The deepest δ18O series overlaps a 1.1 m section of the deepest δD interval. See Table 1 for the depth intervals of the stable-isotopes sections. OD: Older Dryas.
Data
A total of 2200 ice samples were cut for δD measurements. The ice, which has been stored at -26˚C, was cut in 1 cm pieces along the ice core, each sample constituting a total volume of ∼2cm3 . The relative abundance of the stable hydrogen isotopes (2H and 1H) was measured on a Micromass (now GV Instruments) continuous-flow Isotope Ratio Mass Spectrometer (CF-IRMS) (Reference Morrison, Brockwell, Merren, Fourel and PhillipsMorrison and others, 2001) configured for a chromium reduction technique, using 0.3-0.5 μL of each melted sample. The isotopic ratios have been corrected for the production of 1H3 + ions, and the raw δD values (expressed relative to the reference gas) have been corrected for possible drift through the run and for a minor inter-sample memory effect. As a last step, the values have been expressed relative to V-SMOW (Vienna Standard Mean Ocean Water) and normalized to the V-SMOW-SLAP (Standard Light Antarctic Precipitation) scale (Reference CoplenCoplen, 1988; IUPAC, 1994; Reference NelsonNelson, 2000). The average normalization constant was 1.017.
The δ18O samples were cut in 1 cm pieces, and the volume of each sample constituted at minimum 3 cm3. The δ18O measurements were performed on a mass spectrometer which applies an equilibrium method, where the melted ice samples are equilibrated with CO2 gas under vibrations. The samples were kept in equilibrium with CO2 gas for 6 hours before the gas was subjected to isotopic analysis. The ratio of mass 46 and 44 is a measure of the O18/O16 ratio in the sample. A total of 1485 samples were measured. The sampling and the measurements of the δ18O data were performed by T. Ebbensgaard Strømfeldt, T. Jurgensen and A. Boas at the University of Copenhagen, Denmark.
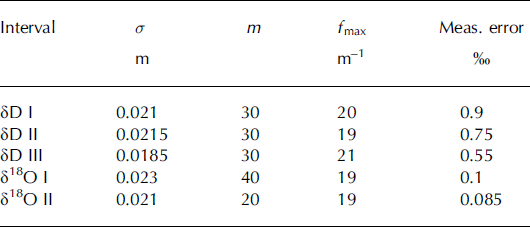
To be able to use the annual signal in the isotope series for dating, a deconvolution technique (Figs 3 and 4) has been used to enhance the annual amplitude, which has been weakened through diffusion processes in the firn and ice (Reference JohnsenJohnsen, 1977; Reference Johnsen, Clausen, Cuffey, Hoffmann, Schwander, Creyts and HondohJohnsen and others, 2000). The diffusion process can be mathematically described as convolving the initial (unknown) isotope profile with a symmetrical Gaussian clock of the form exp(−0.5z2/er2), where the diffusion length a reflects the degree of smoothing and z is depth. The diffusion length represents the mean vertical movement of the water molecules and this parameter is dependent on the depth, accumulation rate and temperature. The initial isotope profile can be reconstructed by performing the inverse process (deconvolution) on the measured isotope profiles. Maximum entropy method (MEM) analysis is used to calculate the power spectra of the series to estimate the a to be used (Fig. 5; Table 2).
Parameters used in MEM spectral analysis. a is diffusion length, m is autoregressive order and fm ax is the maximum frequency allowed in the back-diffusion. The measuring error is the accuracy of the reported δD and δ18O values. The filter length was 100 points. The mean of each of the data series is preserved during the deconvolution process
The measurements of the ion concentrations of Ca2+ and NH4+ were performed by Reference Fuhrer, Neftel, Anklin and MaggiFuhrer and others (1993, Reference Fuhrer, Neftel, Anklin, Staffelbach and Legrand1996) by a continuous melting and continuous flow set-up. The technical resolution of the NH4+ and Ca2+ profiles is 2 mm, while the effective resolution is 3-4cm. Two methods have been applied to the raw Ca2+ data to extract as much information as possible from these data. One set has been deconvoluted to account for mixing in the apparatus during measurements. Another variant of the Ca2+ data has also been created by high-pass filtering. The long-term trends are removed, so that the high-frequency oscillations, which are of interest for annual counting, are enhanced.
The dust and NO3– concentrations were measured by Hammer (in press) in 1-10 mm resolution on melted ice. The effective resolution of the data is considered to be 1-4 cm. The dust concentrations were measured by laser and calibrated by a Coulter Counter.
Method
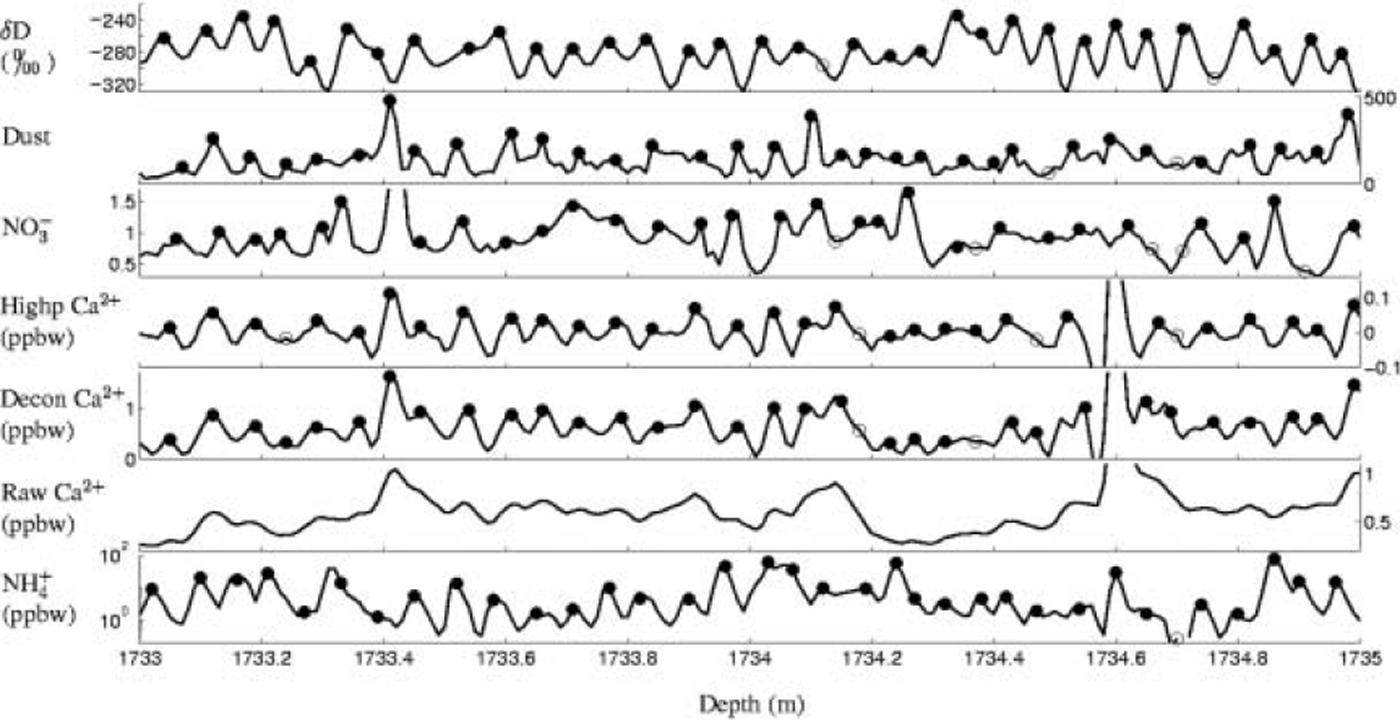
The dating of the Bølling–Allerød is performed by counting annual cycles in deconvoluted δD, deconvoluted δ18O, NH4 +, Ca2+ (raw, deconvoluted and high-pass filtered), dust and NO3 – (Table 1 ; Fig. 2). As seen in Table 1 and Figure 1 , the stable-isotope data cover less than half of the whole interval. The multi-parameter counting is done manually, with all the parameters present at one time. One ‘master’ series of years is established from a common interpretation of the cycles seen in all the different series. In Figure 2 this master series can be seen as dots on the NH4 + profile. A ‘certain year’ (symbolized with a black dot) is an annual cycle that is clearly seen in all (or most) of the parameters. However, the cycles are sometimes hard to interpret (e.g. one series indicates a year where another series does not, or a possible year is seen as a shoulder on a flank of a peak). These ambiguities lead to ‘uncertain years’ (open dots). The best estimate is taken as the certain years + half of the uncertain years. The uncertainty is taken as half of the uncertain years. This uncertainty reflects the degree of difficulty in interpreting the available data, but does not reflect the ‘true’ uncertainty, as there might be a bias in the dating (e.g. if the data do not resolve all the years).
Multi-parameter dating. Counting of annual layers is performed on deconvoluted δD (or δ18O), dust, NO3–, Ca2+ (high-pass, deconvoluted and raw) and NH4 + . Black dots represent certain annual layers, whereas open dots indicate uncertain annual layers. All the series are given the same amount of dots, based on a common interpretation of the cycles in the different parameters. The dots on the NH4 + profile constitute the ‘master’ series. Regarding the Ca2+ series, the dots are put on the deconvoluted and high-pass filtered data only, but the interpretation is based on all three Ca2+ variants. The units on the dust and NO3– profiles are arbitrary.
The counting was first performed on the sections where all the data were available (i.e. in the intervals where the stable isotopes have been measured), aiming at finding an overall agreement between the series. Thereafter, the rest of the Bølling–Allerød period was counted, using the experience gained from intervals containing stable-isotope profiles.
The onset of the Bølling (GI 1e) and the termination of the Allerød (GI 1abc) are defined based on sharp shifts seen in the deuterium-excess profile (personal communication from T. Popp, 2004) in the North Greenland Icecore Project (NorthGRIP) ice core (Reference Dahl-JensenDahl-Jensen and others, 2002). These depths are transferred to GRIP depth by matching profiles of electrical conductivity measurements (ECM), dielectric properties (DEP), Ca2+, NH4 + (and δ18O) from the two ice cores (Reference Fuhrer, Neftel, Anklin and MaggiFuhrer and others, 1993, Reference Fuhrer, Neftel, Anklin, Staffelbach and Legrand1996; Reference TaylorTaylor and others, 1993; Reference JohnsenJohnsen and others, 1997; Reference RöthlisbergerRöthlisberger and others, 2000; Reference Dahl-JensenDahl-Jensen and others 2002; Reference BiglerBigler, 2004; North-GRIP members, 2004). Deuterium excess, which reflects conditions in the source area for the moisture (Reference Merlivat and JouzelMerlivat and Jouzel, 1979; Reference Johnsen, Dansgaard and WhiteJohnsen and others, 1989), is characterized by abrupt shifts at transitions from one climate period to another. Hence, this parameter is useful for defining the onset and terminations of the climate periods. The deuterium excess is not available from the depth of interest in the GRIP core. The transitions between the Bølling and the Older Dryas and between the Older Dryas (GI 1d) and the Allerød are defined using δD and δ18O in the GRIP ice core (see Table 1 for these depths). The depths of the onset of the Bølling and the termination of the Allerød differ slightly from those defined in Reference JohnsenJohnsen and others (1992), which were based on ECM, and from those defined by Hammer (in press); however, the Older Dryas depths were not stated in those papers.
Results
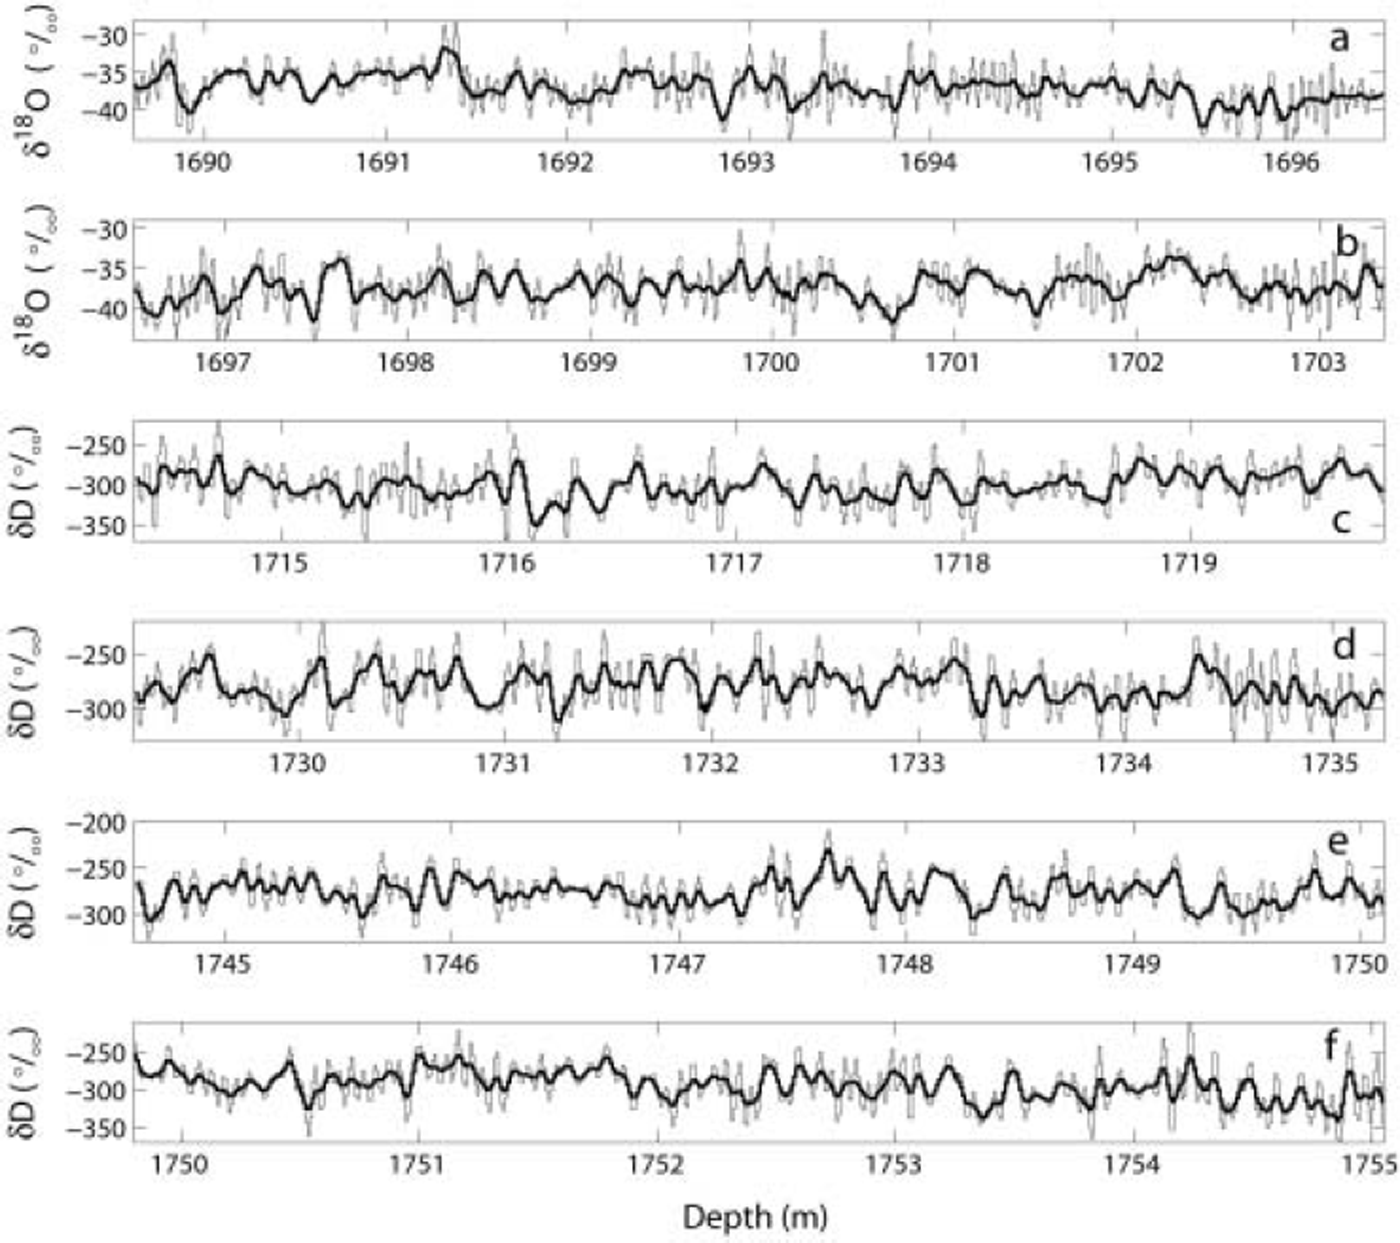
Figures 3 and 4 show all the intervals of the new high-resolution stable-isotope data from the Bølling–Allerød in the GRIP ice core. The δ values are relative to the V-SMOW–SLAP scale. In Figure 3 the raw and deconvoluted data are plotted together. The intervals are labelled δD intervals I–III and δ18O intervals I and I I , according to Table 1 . The stable-isotope profiles cover a total depth of 36.85 m, of which 1.1 m is an overlap between δ18O interval II and a part of δD interval III. This overlapping section is displayed in Figure 4a and b, which plot the raw data and the deconvoluted data respectively. The overlapping δD and δ18O series are from two different cuttings of the ice and were measured separately.
Intervals of high-resolution isotope profiles from the Bølling–Allerød in the GRIP ice core. Thick lines show measured data. Thin lines show deconvoluted data where the initial isotope profile has been reconstructed (back-diffusion). The reconstructed annual signal is used for dating by counting summer peaks of high isotope values. The depth scales on the panels are different. All δ values are relative to the V-SMOW–SLAP scale. (a, b) δ18O interval I; (c) δD interval I; (d) δD interval I I ; and (e, f) δD interval III. See Figure 4 for δ18O interval I I .
δD and δ18O in the overlapping section in the early Bølling. (a) Raw data. (b) Back-diffused data. Thick lines show δD from part of δD interval III. Thin lines show δ18O interval II. The δ18O values are multiplied by 8. There is good agreement between the two different isotope profiles, which were measured separately on different cuttings of the ice.
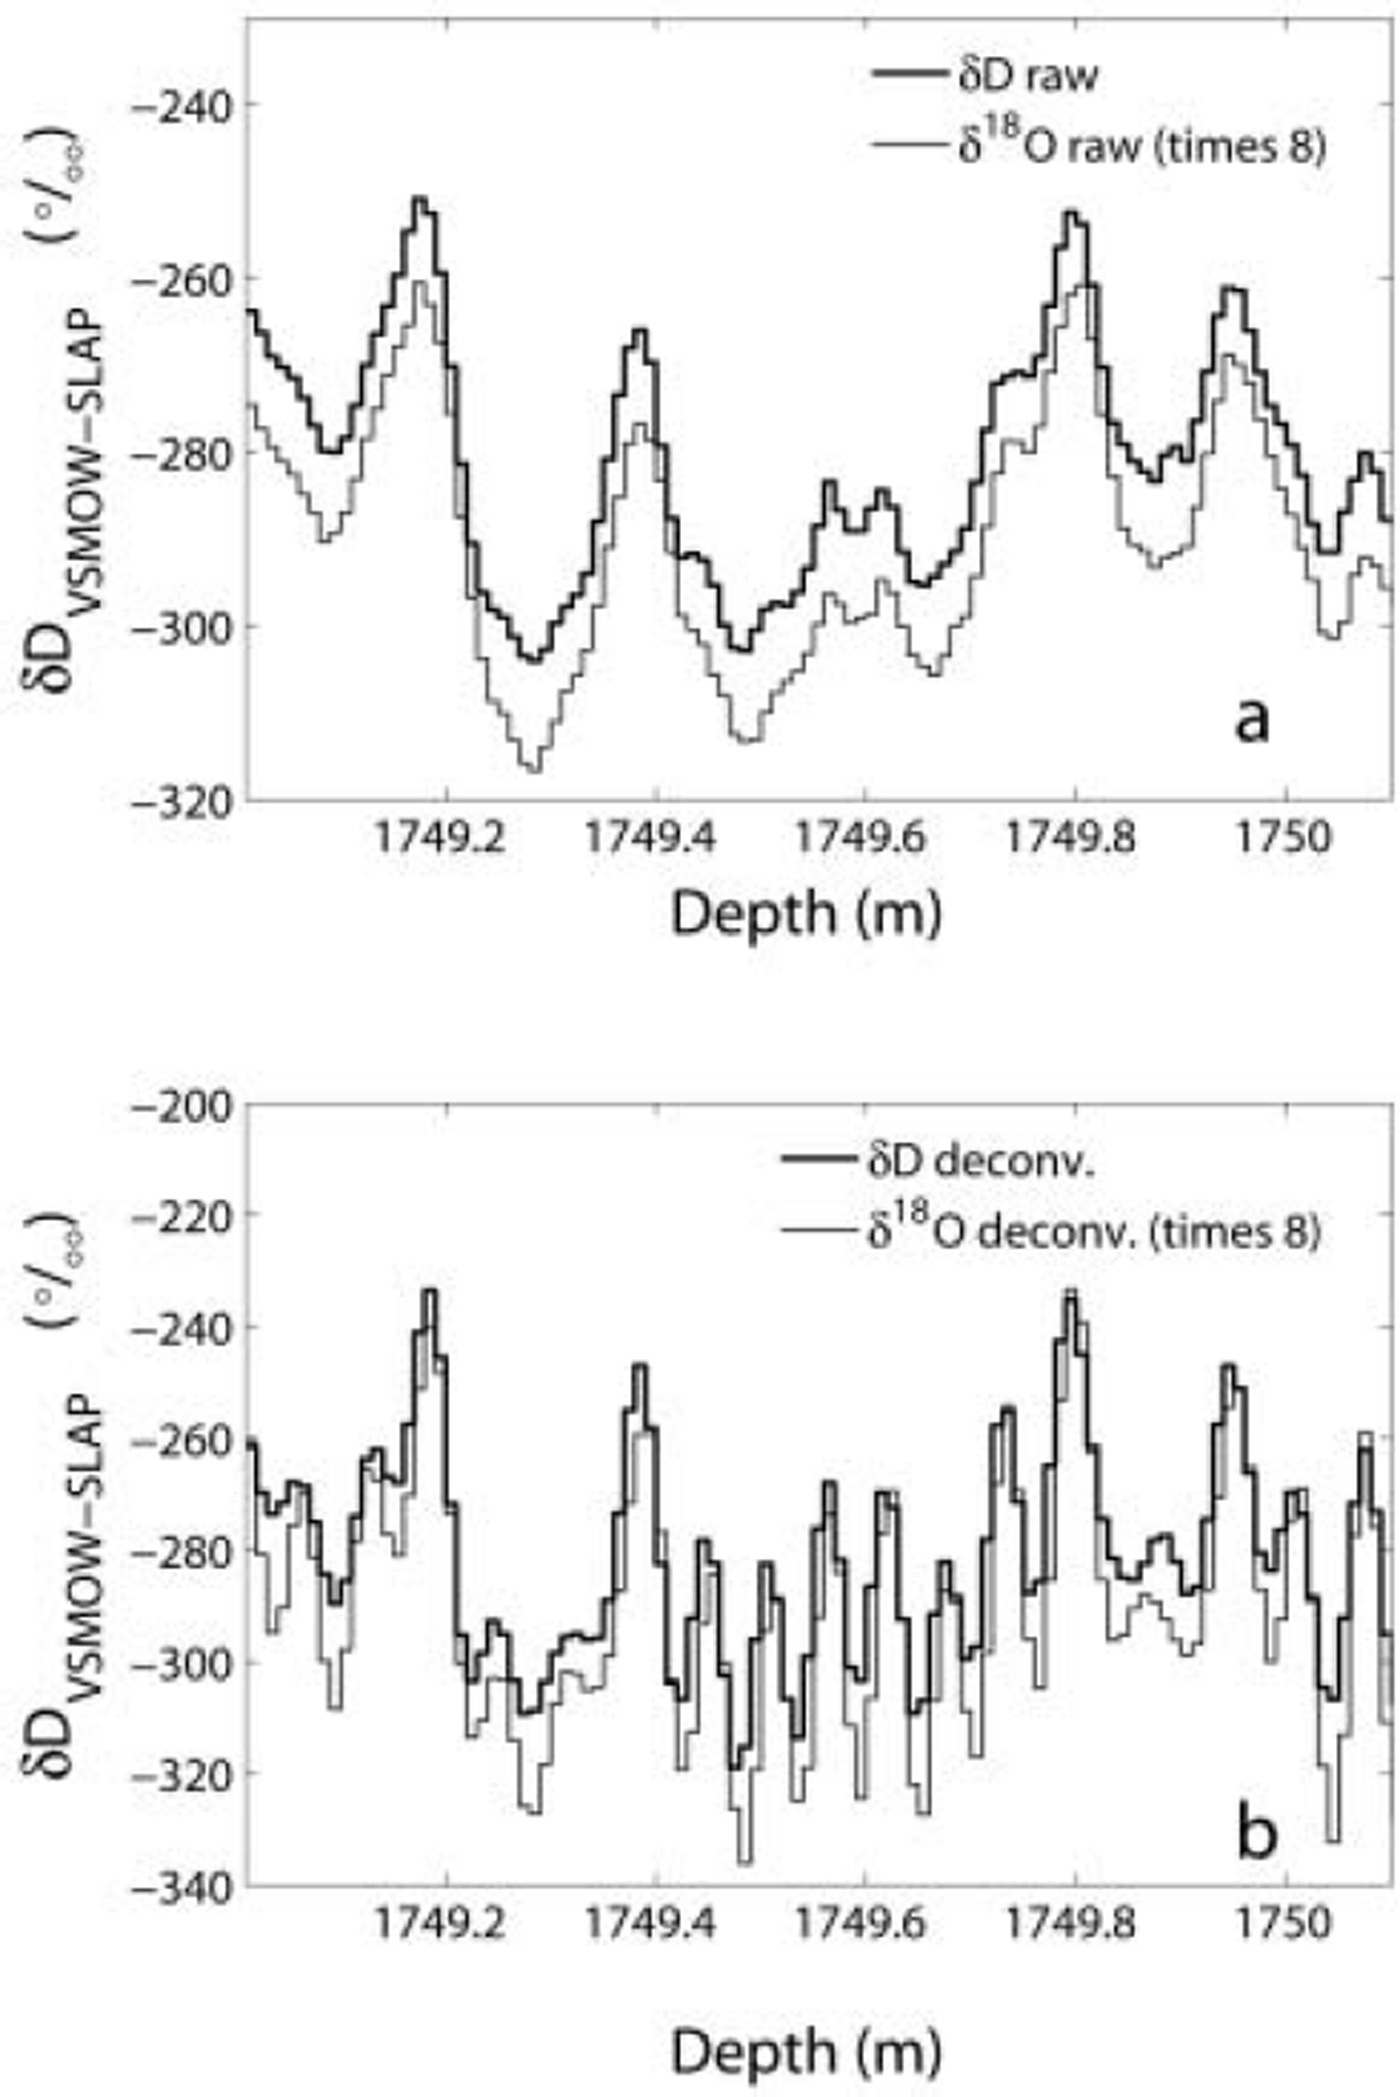
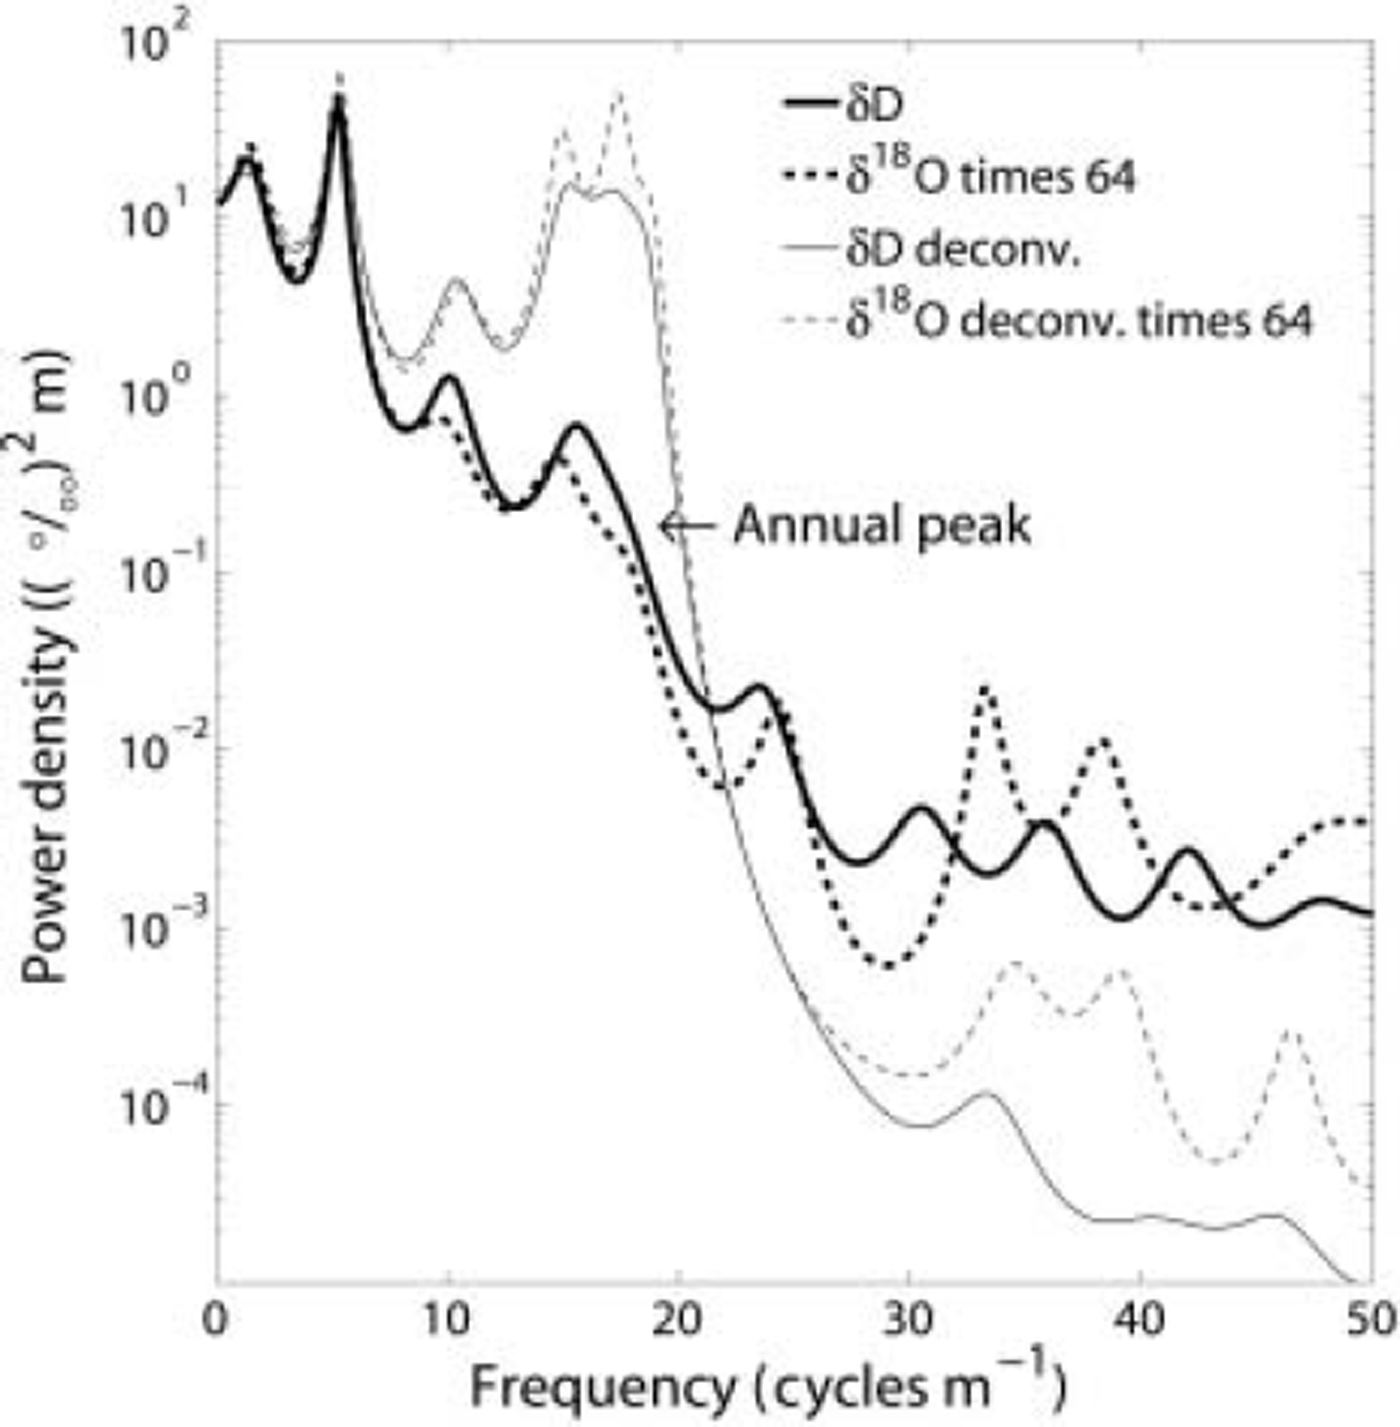
Figure 5 displays the MEM power spectra for δ18O interval II and for the section of δD interval III that overlaps with the δ18O data. The spectral densities of the δ18O profile have been multiplied by 64 to facilitate the comparison with the spectral densities of the δD section. The power spectra of the raw data (thick lines) show how the amplitudes of high frequencies have been diminished by the diffusion in the firn and ice. The spectral densities in the high-frequency domain have been lowered, so that they are indistinguishable from the nearly flat level (white noise) that represents the measuring error (see Table 2). The arrow indicates what is considered to be the annual peaks in the power spectra. Both of the spectra for the raw data reveal an annual peak around 14–19 cycles m–1, which corresponds to a layer thickness of 5–7 cm. The annual peak is not very pronounced and is situated close to the noise level and therefore close to the cut-off frequency. By comparing the spectra of the raw δD and δ18O in a band around the annual peak, it is observed that the power of δD is higher than for δ18O, relative to that at lower frequencies. This means that the annual signal of the δD has experienced less damping than the annual signal in the δ18O. The thin lines in Figure 5 are the power spectra of the back-diffused series. These spectra show how all the frequencies below a certain limit (determined by the cut-off frequency) are amplified to correct for the diffusion. The power density of the annual cycle, which is of interest for dating, has been increased. Table 2 lists specifications on parameters that have been used in the MEM spectral analysis and deconvolution of the stable-isotope data. The diffusion length a and the cut-off frequency fmax are used for the inverse transfer function exp(0.5k2er2), where k = 2πf is the wavenumber. The choice of cut-off frequency is a best compromise between excluding the noise at higher frequencies and including the annual peak. An fm ax of ∼ 2 0 cycles m–1 seems to fulfil these conditions for the stable-isotope profiles in the Bølling-Allerød. This means that back-diffused data are capable of resolving annual layers of a thickness ≥5 cm. The power spectra shown in Figure 5 are typical for all the isotope intervals, although the annual peak is more blurred-out for the longer intervals such as δ18O interval I in the Allerød, where the variability in the layer thickness is likely to be higher, due to the presence of more climatic shifts.
MEM spectral densities for δ18O interval II (dotted lines) and part of δD interval III (solid lines) in the overlapping section in the early Bølling (see Fig. 4). Thick lines show raw data. Thin lines show back-diffused data. Autoregressive order m is 20, fmax is 19 and cr is 0.0185 m (δD) and 0.021 m (δ18O). The annual peak is seen around 14-19 cycles m–1 , which equals an annual-layer thickness of 5-7cm. The spectral densities of δ18O are multiplied by 64 to make the comparison with the spectral densities of δD easier. For wavenumbers around the annual peak, the damping is smaller for δD than for δ18O.
One set of the Ca2+ data was deconvoluted to correct for mixing in the apparatus. The transfer function was exp(0.1 f), where f is frequency. The cut-off frequency was 30 cycles m–1, so the data are able to resolve years of a thickness down to 3.3 cm. It should be mentioned that the deconvolution corrects only the amplitudes of the cycles, not their relative phases. Another set of Ca2+ was filtered through a smooth Gaussian high-pass filter.
Looking at the seasonal cycles in all the parameters (e.g. Fig. 2), there is an overall agreement between the parameters. NO3 – is the parameter that deviates most, generally showing fewer cycles than the other parameters. However, in some periods NO3 – agrees well with the other parameters. The dust profile often has more peaks than the other parameters. Under present-day conditions, NH4 + and NO3 – have maxima during summer, like δD and δ18O, while dust and Ca2+ normally peak during spring. This is also the main feature during the Bølling–Allerød, though there are periods when this is not the case. The parameters are often out of their usual phasing, especially in the Allerød. Hence, the seasonality pattern seems to have had a higher variability than for present-day conditions.
The depth scales of dust and NO3 –, which were measured simultaneously, have been shifted a few places within the investigation interval. This is done because of indications of holes in the data or discrepancies in the depth of characteristic peaks observed in both Ca2+ and dust. The adjustment of the depth scales was aimed at synchronizing these distinct peaks, under the assumption that characteristic peaks in Ca2+ and dust reflect the same deposition events. The range of shift was between -70 and +50 mm, where the latter amount of displacement was the most common.
The annual-layer counting based on seasonal variations in δD, δ18O, NH4 +, Ca2+ dust and NO3– gives estimated lengths of 588 ± 16 years for the Bølling, 70 ±4years for the Older Dryas and 971 ±31 years for the Allerød. The uncertainty reflects the inconsistency between the series and the difficulty of interpreting the peaks and shoulders. The uncertainty does not take into account any bias in the counting. The corresponding mean annual-layer thicknesses of the three periods are 5.9, 5.1 and 5.4 cm respectively.
Discussion
The counting method is based on a common interpretation of all the data series, first in the intervals containing stable isotopes and then in the rest of the Bølling-Allerød period. The result is highly dependent on the resolution and the internal consistency of the data series. The dust profile generally has more peaks than the other parameters, favouring the highest number of years, while the stable isotopes and the NO3– generally put a lower limit on the number. The Ca2+ and NH4 + generally serve as good dating tools. The effective resolution of these profiles is 3-4 cm, so they can resolve cycles up to this wavelength. As previously mentioned, dust can have more than one peak within some years. The exclusion of dust peaks which are considered as ‘double peaks’ has been decided by comparison with the seasonal cycles in the stable isotopes, Ca2+, NH4 + and NO3–. Hence, it is crucial that these parameters can resolve all the years. Within certain periods this is definitely not the case for NO3–, because the profile is too smooth. Within these intervals, no weight has been put on the NO3– in the interpretation. When it comes to δD and δ18O, it is evident that the annual cycles are present in the stable-isotope profiles from this interstadial. The power spectra reveal a peak around 14-19 cycles m–1 for both δD and δ18O, which indicates that there is power left in the annual signal in both of the stable-isotope series, and that they can be used for dating purposes. That this peak reflects a true seasonal signal is confirmed by the good agreement between δD and δ18O in the overlapping section in Figure 4. If the peaks in the spectral densities represented noise only it would not be possible to create such a compelling agreement between the back-diffused δD and δ18O data, as the noise in the two profiles is uncorrelated. Hence, it is unquestionable that there is power left in the annual amplitude of the stable-isotope profiles. What remains to be answered is whether all the years are resolved. The method of using stable isotopes for dating is certainly at the limit at this depth, where the ice is 14-15 kyr old. The MEM power spectra of the raw data show that there is little power left in the annual cycle and that the annual peak is close to the noise level. This indicates that some years of low accumulation (high frequency) may not have been revealed by the deconvolution, as they are hidden in the noise and thereby ruled out by the cut-off frequency. With a cut-off frequency of ∼20 cycles m–1, annual layers less than ∼ 5 cm thick will not be resolved. This is supported by the fact that shoulders are seen on flanks of δ peaks when other parameters have peaks (or clear shoulders). If some years are lost in the stable-isotope profiles, this will lead to a too low estimation of the duration of the periods.
In the section where the δD and the δ18O profiles overlap, it is observed that the damping of the signal is stronger for δ18O than for δD. This is due to less diffusion of molecules containing 2H compared to molecules containing 18O and is in accordance with earlier results and theory (Reference Johnsen, Clausen, Cuffey, Hoffmann, Schwander, Creyts and HondohJohnsen and others, 2000). The lower damping of the δD signal suggests that δD is slightly better for dating when working with ice where the amplitude of the annual signal of the stable isotopes is close to the limit of detection.
According to data from Reference Dahl-Jensen, Johnsen, Hammer, Clausen, Jouzel and PeltierDahl-Jensen and others (1993), the mean accumulation rate (based on δ18O) at GRIP during the Bølling was 0.23 ± 0 . 0 2 m a-1 , while it was 0.15 ± 0 . 0 2 ma–1 during the Older Dryas and 0.18 ± 0.02 m a-1 during the Allerød. As 0.20ma-1 is considered as the minimum accumulation rate under present-day conditions for the annual cycle to survive (Reference JohnsenJohnsen, 1977), it is interesting that it is possible to detect the annual amplitude within the stable-isotope series from the Older Dryas and the Allerød. This can be explained either by higher accumulation rates than those derived from δ18O, or by lower temperatures than at present. δ18O-derived paleotemperatures (Reference Johnsen, Dahl-Jensen, Dansgaard and GundestrupJohnsen and others, 1995) from the GRIP ice core show that it was only 1˚C colder during the Bølling than today, while it was 5-12˚C colder during the Older Dryas and the Allerød. Lower temperatures may have slowed down the process of diffusion in the firn and ice.
Compared to the Bølling interval, the data in the Older Dryas and the Allerød are more difficult to interpret. The seasonal variability is higher, the parameters are often out of phase and the agreement between the data is less compelling. The mean annual-layer thickness in the Bølling agrees well with the value found by Reference Dahl-Jensen, Johnsen, Hammer, Clausen, Jouzel and PeltierDahl-Jensen and others (1993), of 5.8 ± 0 . 6 cm. However, the mean annual-layer thicknesses within the Older Dryas and the Allerød are greater than those found by Reference Dahl-Jensen, Johnsen, Hammer, Clausen, Jouzel and PeltierDahl-Jensen and others (1993). They estimate a mean annual-layer thickness of 4.0 ± 0.3 cm and 4 . 9 ± 0 . 7 cm in the Older Dryas and the Allerød, respectively, with minima of 3-3.5 cm. This could indicate that some of the annual layers within the Older Dryas and the Allerød are too thin to be resolved properly by the data used in the multi-parameter dating.
Table 3 displays other estimates of the duration of the Bølling, Older Dryas and Allerød periods in Greenland ice cores. Compared with the previous stratigraphical dating on the GRIP ice core (Hammer, in press), the number of years is substantially lower for the multi-parameter approach. The Older Dryas was not specified in the work by Hammer, and the definitions of the onset and terminations differed slightly from those used in this study (see Tables 1 and 3). Using the depths from Hammer (in press), the corresponding estimates for the multi-parameter approach are 585 ± 17 years for the Bølling and 1028 ± 34 years for the Allerød. These estimates are ∼ 2 0% and ∼ 3 0% shorter than those found by Hammer. This huge deviation can be explained by different approaches to the layer counting. The dating accomplished by using dust concentrations only, without guidance from other parameters, may have overestimated the number of years, by including too many ‘double peaks’. On the other hand, the method used in this study may have underestimated the duration of the climate periods, as the ‘restricting’ data cannot resolve annual layers of low thickness, especially in colder parts of the periods, where the accumulation rates have been lower. Compared to the modelled timescale ss09sea (Reference JohnsenJohnsen and others, 2001), which is based on a Dansgaard-Johnsen flow model and δ18O-derived accumulation rates, the new estimates from the multi-parameter counting are ∼9%, ∼24% and ∼17% shorter, for the Bølling, Older Dryas and Allerød, respectively.
Estimates of the duration of the Bølling (B), Older Dryas (OD) and Allerød (A) from Greenland ice cores. The GISP2 ice core (Reference Grootes, Stuiver, White, Johnsen and JouzelGrootes and others, 1993) is situated 28km west of GRIP, and the NorthGRIP ice core (Reference Dahl-JensenDahl-Jensen and others, 2002) is located 325 km northwest of GRIP
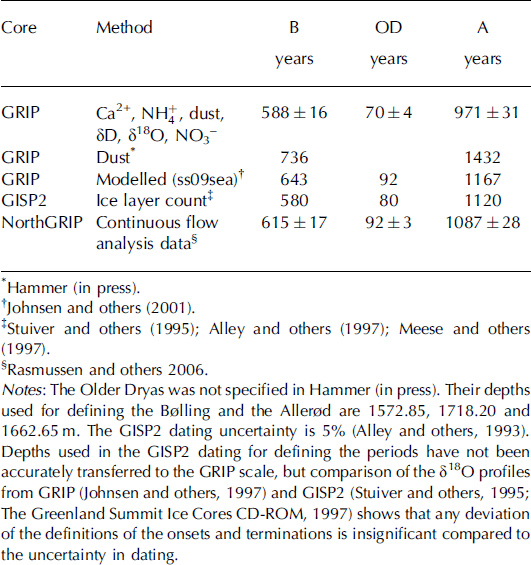
The estimated length of the Bølling agrees well with the number of years found by annual-layer counting of the Greenland Ice Sheet Project 2 (GISP2) ice core (Reference AlleyAlley and others, 1993, Reference Alley1997; Reference Stuiver, Grootes and BraziunasStuiver and others, 1995; Reference MeeseMeese and others, 1997). The estimated durations of the Older Dryas and the Allerød are ∼ 1 3% shorter than those from the GISP2 layer counting.
The NorthGRIP ice core (Reference Dahl-JensenDahl-Jensen and others, 2002; NorthGRIP members, 2004) is currently being dated by the members of the NorthGRIP dating group (e.g. Reference RasmussenRasmussen, 2006; Vinther, in press). The stratigraphical dating of this core is made by identification and counting of annual cycles as observed in chemical components measured in a continuous flow system (Reference RöthlisbergerRothlisberger and others, 2000; Reference BiglerBigler, 2004). Compared with new results from the dating of the NorthGRIP core (Reference RasmussenRasmussen and others, 2006), the present estimate of the duration of the Bølling is within 2a of the estimate of the length of the Bølling in the NorthGRIP core. The estimated durations of the Older Dryas and the Allerød are ∼ 2 5% and ∼ 1 1 % shorter than those from the dating of the NorthGRIP core.
To summarize, the durations of the Bølling-Allerød estimated by multi-parameter layer counting in the GRIP ice core are generally shorter than other estimates from ice cores in the same region. The estimate of the Bølling period agrees well with GISP2 annual-layer counting and with the results from the NorthGRIP stratigraphical dating, while estimates of the Older Dryas and the Allerød are significantly shorter than in the other datings listed in Table 3. This indicates that the data used in the multi-parameter approach in the GRIP core can resolve annual layers in the relatively warm Bølling, while some years may have been lost in the colder Older Dryas and Allerød.
Conclusion
Multi-parameter counting has been accomplished in the Bølling-Allerød period (Greenland Interstadial 1) in the GRIP ice core, by using the parameters Ca2+, NH4+ , dust, NO3– and new stable-isotope profiles showing seasonal variations.
New high-resolution data presented in this study show that it is possible to use stable isotopes for stratigraphical dating of glacial ice from Greenland Interstadial 1. The annual cycle is seen in MEM power spectra, and the cycles of the stable isotopes compare well with the annual cycles in the chemical data series and the seasonal variations in dust concentrations. It is, however, necessary to deconvolute the measured isotope profiles to reconstruct the initial isotope signals. By this method the annual cycles are amplified and easier to interpret. The maximum resolution of the deconvoluted stable-isotope data from the Bølling-Allerød is ∼5 cm, so thinner annual layers will not be resolved by these data. This implies that some years are lost in colder periods having lower accumulation rates, especially within the Older Dryas and Allerød periods. Furthermore, this study confirms the findings of Reference JohnsenJohnsen and others (2001) that the damping of the annual amplitude, due to diffusion in the firn and ice, is stronger for δ18O than for δD. This suggests that δD is better suited for dating than δ18O when working on ice where the annual signal in the data is weak.
That the annual amplitudes in the δD and δ18O profiles are detectable suggests that the annual accumulation rate during the Bølling-Allerød period was at least (or close to) 0.20 mice a-1 . With a lower accumulation rate, the annual signal would be less likely to survive the diffusion processes in the firn and ice (Reference JohnsenJohnsen, 1977).
The estimated durations of the Bølling (GI 1e), Older Dryas (GI 1d) and Allerød (GI 1abc) periods based on the multi-parameter layer counting in the GRIP ice core are 5 8 8 ± 1 6 , 7 0 ± 4 and 971 ± 3 1 years, respectively. The uncertainties reflect difficulties in interpreting the available data and do not take into account any bias in the dating. The estimates are considered as lower limits for these climate periods, as some years may not have been resolved by the data in colder periods with lower accumulation, especially within the Older Dryas and the Allerød.
This study underlines the importance of having high-resolution data when performing stratigraphical dating of ice cores, and having a variety of independent parameters showing seasonal variations.
Acknowledgements
We are indebted to V. Pohjola and an anonymous reviewer for helpful review, as well as the scientific editor, E. Isaksson, for fruitful comments. We also thank T. Ebbensgaard Strømfeldt, T. Jürgensen and A. Boas for providing the high-resolution δ18O data, S.O. Rasmussen for providing the program Datetool, the Copenhagen Ice Core Dating Initiative (funded by the Carlsberg Foundation), and the Glaciology Group at the Niels Bohr Institute, University of Copenhagen. The staff at the AMC 14C Dating Centre, Department of Physics and Astronomy, University of Arhus, are also thanked for helpful assistance during the δD analysis.



