INTRODUCTION
Durum wheat [Triticum turgidum L. subsp. durum (Desf.) Husn.] is grown on over 3.2 million ha in the European Union (EU), providing an annual output of around 5.7 million tonnes (European Commission, 2010). The durum crop area is largely concentrated in the Mediterranean countries (Italy, France, Greece and Spain), which together account for 98% of total EU production, and for about 55% of the world production. Italy is the main European producer with about 5 million tonnes per year (European Commission, 2010). Durum wheat provides the raw material for the pasta industry, one of Italy's most renowned products, and an increasingly greater amount is also required for the production of speciality breads and couscous (Nachit, Reference Nachit, Nachit, Baum, Porceddu, Monneveux and Picard1998).
The Mediterranean climate is characterized by hot, dry summers and mild winters; rainfall, which is concentrated in the winter months, is extremely variable from year to year and within the year and can range from 50 to 1200 mm year−1. Most cropland, represented mainly by dryland cereals, not only durum wheat, is however in the 200–600 mm year−1 range (Kassam, Reference Kassam1981). In this area, durum wheat is typically sown in late autumn or early winter and harvested in late spring–early summer. Thus, it is generally assumed that the crop is grown when rainfall and temperature are favourable until anthesis. During the grain filling period, limited rainfall and high temperatures are nonetheless frequent. This affects increasing soil water deficit, the variable presence of which may cause large fluctuations not only in grain yield but also in grain protein content and composition, with considerable effects on the rheological properties of dough (Ercoli et al., Reference Ercoli, Lulli, Mariotti, Masoni and Arduini2008). With few exceptions, the soils of the Mediterranean region are low in organic matter and consequently in total nitrogen reserves, thus setting limitations on growing crops without nitrogen fertilizer or biological nitrogen fixation through legumes (Ryan et al., Reference Ryan, Ibrikci, Sommer and McNeill2009). In the Mediterranean areas, indeed, nitrogen deficiency is the major constraint in dryland cereal farming after drought (Campbell et al., Reference Campbell, Zentner, Selles, McConkey and Dyck1993).
Nitrogen is the major nutrient influencing wheat grain yield (Ehdaie and Waines, Reference Ehdaie and Waines2001) and is a decisive factor in improving grain quality indices mainly by its effect on grain protein concentration and composition (Gooding and Davies, Reference Gooding and Davies1997). Crop responses to nitrogen fertilization depend heavily on soil water availability. There are interactive effects of water deficit and additional nitrogen fertilizers in crop production (Anderson, Reference Anderson1985). It is widely accepted that the early developmental processes in durum wheat, such as tiller proliferation, occurring during early growth, depend on the availability of water and nitrogen in the soil (Simane et al., Reference Simane, Struik, Nachit and Peacock1993). Moreover, combined water and nitrogen shortages around anthesis are known to induce flower abortion resulting in reduced grain number per unit land area (Jeuffroy and Bouchard, Reference Jeuffroy and Bouchard1999). A number of works in the literature refer to the relationship between irrigation regimes and nitrogen supply on durum wheat production (Albrizio et al., Reference Albrizio, Todorovic, Maticb and Stellacci2010, Cossani et al., Reference Cossani, Slafer and Savina2012; Karam et al., Reference Karam, Kabalan, Breidi, Rouphael and Oweis2009). Under rainfed conditions of a Mediterranean environment, crop responses to nitrogen fertilizer depend on rainfall amount and distribution during the crop cycle, to the amount and timing of nitrogen applications as well as initial soil nitrogen levels (Abad et al., Reference Abad, Lloveras and Michelena2004; Basso et al., Reference Basso, Cammarano, Troccoli, Chen and Ritchie2010; Cossani et al., Reference Cossani, Slafer and Savin2009; Lopez-Bellido et al., Reference López-Bellido, Muňoz-Romero, Benítez-Vega, Fernández-García, Redondo and López-Bellido2012). In years with inadequate rainfall, much of the fertilizer nitrogen not absorbed by the crop may remain in the soil as available nitrate to subsequent crops; in years with normal rainfall (generally concentrated in autumn–winter), nitrates may be leached because of their mobility in the soil–plant–atmosphere system, with important consequences on energy-production costs and on the potential contribution to environmental pollution (Ercoli et al., Reference Ercoli, Masoni, Pampana, Mariotti and Arduini2013; Pampana et al Reference Pampana, Masoni, Ercoli, Mariotti and Arduini2013). Late and split nitrogen applications are agronomical strategies to reduce N leaching and improve N utilization, more so through promoting build-up of grain protein content (Ercoli et al., Reference Ercoli, Lulli, Arduini, Mariotti and Masoni2011; Fuertes-Mendizábal et al Reference Fuertes-Mendizábal, Aizpurua, González-Moro and Estavillo2010; Garrido-Lestache et al., Reference Garrido-Lestache, Lopez-Bellido and López-Bellido2005; Lopez–Bellido et al., Reference López-Bellido, López-Bellido and Redondo2005) than by an increase in grain yield (Debaeke et al., Reference Debaeke, Aussenac, Fabre, Hilaire, Pujol and Thuries1996; Sowers et al., Reference Sowers, Miller and Pan1994). Little information on the influence of either early or no split nitrogen application jointly on grain yield, nitrogen efficiency and grain quality of durum wheat under rainfed Mediterranean conditions is available. Furthermore, few attempts (Cossani et al., Reference Cossani, Slafer and Savina2012; Giambalvo et al., Reference Giambalvo, Ruisi, Di Miceli, Frenda and Amato2010; Halitligil et al., Reference Halitligil, Akın, Bilgin, Deniz, Ögretir, Altınel and Işık2000; Lopez-Bellido et al., Reference López Bellido, López-Bellido and López-Bellido2006) have focused to date on defining nitrogen fertilizer efficiency in durum wheat.
The aim of the present study was to evaluate through a systematic study the effect of nitrogen fertilizer rate (an unfertilized control, a dose usually used in the semi-arid Mediterranean area matching the uptake (Todari, Reference Todari, Baldoni and Giardini1989) and a double dose) on grain yield characteristics, on NUE and grain quality in three genotypes to achieve a more sustainable fertilization management of durum wheat in a Mediterranean environment. As responses to nitrogen vary with weather conditions, tests were undertaken in three consecutive years.
MATERIALS AND METHODS
Experimental site
Field experiments were conducted over three growing seasons, 2004–2005, 2005–2006 and 2006–2007 (hereafter season I, season II and season III, respectively) in Sicily, southern Italy (Enna-Barrafranca 37° 26′ N, 14° 14′ E, 600 m a.s.l.), an area in the interior Sicilian uplands where durum wheat cultivation is common. The local climate is semi-arid Mediterranean with mild wet winters and hot, rainless summers. The deep soil was a Typic Xerorthents (USDA, Soil Taxonomy, 1999). A layer, 0.30 m thick (from −0.05 to −0.35 m) was considered for the soil analysis. Analysis made at the beginning of the experiment indicated the following characteristics: 29% clay, 22% silt, 49% sand, 1.12 ‰ total nitrogen, 59.2 kg ha−1 available P2O5 and 384 kg ha−1 exchangeable K2O. The soil pH was 8.5. All soil analyses were performed according to procedures approved by the Italian Society of Soil Science (Società Italiana Scienza del Suolo, 1985).
Experimental design and crop management
In each season, a split-plot design with four replications was adopted, involving three durum wheat genotypes (‘Creso’, ‘Trinakria’ and ‘Line 25’) as the main plots and three N fertilization rates (0, 80 and 160 kg ha−1 of nitrogen, hereafter referred to as N0, N80, N160, respectively) as sub-plots. The three genotypes were chosen to represent the high genotypic variability within durum wheat. ‘Creso’ is a durum wheat genotype that has been widely cultivated in Central Italy for the past 30 years and is still in use. It is characterized by Rht genes that cause a drastic reduction in plant stature and hence an increase in the harvest index (Motzo et al., Reference Motzo, Fois and Giunta2004), and by moderate but constant yield and medium grain quality. ‘Trinakria’ is a genotype that has been widely cultivated in Sicily for the past 30 years; it is characterized by moderate productivity, good adaptability to environments characterized by scarce water and nutrient resources and good pasta-making quality. ‘Line 25’ is a genotype developed by University of Catania, within a breeding program starting from Trinakria × Valnova; it is characterized by high yield and grain quality, above all for its high protein content and good quality protein.
Seeds were sown at a density of 400 viable seeds m−2 on 23 January 2005, 31 December 2005 and 28 December 2006, using a 12-row planter. The size of each plot was 4 m by 6 m and consisted of 20 rows, each 6 m long, spaced at 0.20 m. Tillage consisted of a 40 cm depth ploughing followed by harrowing in October. The experiment was in a field where the previous crop was faba bean in seasons I and III and vetch-oat lawn in season II. Fertilization with P was done before sowing, incorporating into the top 40 cm soil layer 120 kg ha−1 P2O5 as triple superphosphate (46% P2O5). Soil available K was adequate to crop requirements and so K fertilizers were not supplied. N was applied in the plots, two-thirds at sowing as urea (46% N) and the remaining one-third at full tillering (stage 25; Zadoks et al., Reference Zadoks, Chang and Konzak1974) as ammonium nitrate (27% N). Both urea and ammonium nitrate were incorporated into the soil. Top dressing N fertilization was done on 4 April, 23 March and 21 March, in seasons I, II and III, respectively. In each season, weeding was performed with glyphosate before sowing and MCPA at first detectable node (stage 31; Zadoks et al., Reference Zadoks, Chang and Konzak1974). No pesticides were used to control plant pests. Plants from ten adjacent rows of 1 m length corresponding to a 2.0 m2 area per plot were harvested at full ripeness (stage 92 Zadoks et al., Reference Zadoks, Chang and Konzak1974) during the last ten days June in the three seasons. Plants were harvested with a plot combine and were separated into culms, leaves, chaff and grain.
Pheno-morphological and agronomical traits
Heading and full ripeness stages were recorded, respectively, when about half the plants showed emerging spikes (stage 50; Zadoks et al., Reference Zadoks, Chang and Konzak1974) and very hard kernels and completely dry plants (stage 92; Zadoks et al., Reference Zadoks, Chang and Konzak1974). Plant height (excluding spike) was measured during the intermediate milk maturation (stage 75; Zadoks et al., Reference Zadoks, Chang and Konzak1974). Grain yield was determined on 11.2 m2 per plot (4 central metres of 14 middle rows) to avoid border effects and was expressed at 13% moisture level. The grain moisture level was measured in a 300 g sample from each plot in a thermo-ventilated oven at 60°C until constant weight was reached. Yield components were assessed for each plot: number of spikes per square meter, number of kernels spike−1, thousand-kernel weight (1000-kernels weight). The latter was calculated as the mean weight of three sets of 100 kernels from each plot.
Grain quality parameters
Test weight was measured on a 250 g sample with a Schopper chondrometer equipped with a 1 l container (TR Turoni, Italy); results are reported as kg hl−1 without reference to the moisture content. Vitreous kernel count was determined by inspecting three samples of 100 kernels sliced with a Pohl grain cutter. Shrivelled kernel was determined by counting the not-fully filled kernels on three samples of 100 kernels.
A sample of grains was milled to flour using a laboratory mill A 11 Basic Analytical Mill (Seneco, Milan, Italy). Protein content, dry gluten content and Sodium Dodecyl Sulfate (SDS) volume sedimentation test (SDS test) were determined on flour. Protein content was calculated after multiplying Kijeldhal nitrogen determinations by 5.7. Dry gluten concentration was determined using the Glutomatic System (Perten Instruments, Huddinge, Sweden), following the standard method ICC no 137 (ICC, 1986). The SDS test (height of sediment in ml) was performed as an indicator of gluten strength according to Dick and Quick (Reference Dick and Quick1983).
Nitrogen efficiency indices
The efficiency of N was calculated in terms of NUE and agronomic nitrogen efficiency (NAE). NUE was calculated as the ratio of grain yield per unit of available N in the soil. Available nitrogen was the sum of mineral N (NO3-N and NH4-N) in the 0–0.40 m soil layer at sowing, plus the N released through mineralization during the growing season, plus the N supplied through fertilization (Moll et al., Reference Moll, Kamprath and Jackson1982). The initial mineral nitrogen content of the soil profile (0–0.40 m) was set at about 1% of total N, determined by the Kjeldahl method. N soil mineralization per month was calculated according to Gariglio et al. (Reference Gariglio, Pilatti and Baldi2000), from total N content corrected by an N mineralization factor as a function of soil temperature. On the basis of this procedure, the quantity of available mineral nitrogen in the soil for the crop cycle was equal to 29.8 kg ha−1 for season I, 26.2 kg ha−1 for season II and 31.0 kg ha−1 for season III. The NAE represents the incremental efficiency of applied N as compared to unfertilized test. It was calculated according to the following equation: NAE = (YN–Y0)/NF (Novoa and Loomis, Reference Novoa and Loomis1981), where YN represents grain yield of N fertilized plot (expressed as kg ha−1), Y0 is grain yield of the N unfertilized plot (control) and NF represents the amount of N applied (expressed as kg ha−1 in fertilized plots).
Statistical analysis
Data collected were first submitted to Bartlett's test to check the homoscedasticity, then analysed through a three-way (nitrogen rate × genotype × growing season) factorial analysis of variance (ANOVA). Provided that the F- test was significant, means were separated on the basis of the least significant difference (LSD) test. All calculations were performed using CoStat version 6.003 (Cohort Software, Monterey, Ca, USA).
Weather conditions
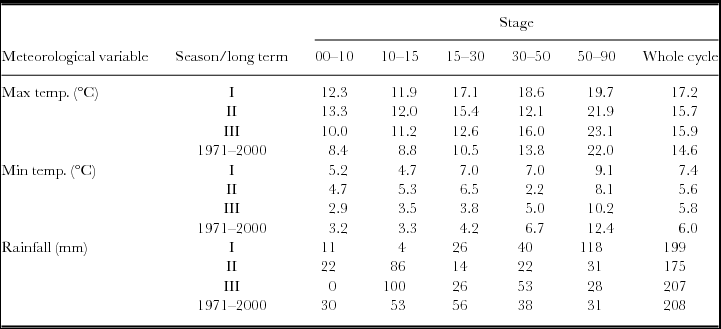
Weather conditions (maximum and minimum air temperature, relative humidity, rainfall) were monitored during the experiments by a meteorological station (Mod. Multirecorder 2.40; ETG, Firenze, Italy) sited at the experimental field. Table 1 shows the time trend of mean maximum and mean minimum temperatures and the accumulated rainfall recorded during whole-wheat cycle split into the main growth periods in the three seasons of the experiment and over the long-term 1971/2000. For the long-term, the periods in which the main phenophases normally occur in the area of the experiment were considered (Tuttobene et al., Reference Tuttobene, Lombardo, Abbate and Foti1985).
Mean maximum and minimum air temperatures and total rainfall for season I, II and III and long term 1971–2000 average during the whole wheat cycle and main growth periods. Growth stages are defined following Zadok's scale (00 sowing, 10 emergence, 15 fifth leaf unfolded stage, 30 pseudo stem erection, 50 heading, 92 full ripeness).

Mean maximum and minimum temperatures during the whole cycle from sowing to full ripeness (from 0– to 92, Zadoks et al., Reference Zadoks, Chang and Konzak1974) were higher in season I than in season II (+1.5°C and +1.8 °C, respectively), than in season III (+1.3°C and +1.6 °C) and than the long-term 1971/2000 (+2.6°C and +1.4 °C). Differences were particularly evident from the fifth leaf unfolded stage to heading (from 15 to 50, Zadoks et al., Reference Zadoks, Chang and Konzak1974). Total rainfall during the whole cycle of each crop ranged between 175 (season II) and 207 mm (season III) and was similar to the 30 year (1971–2000) mean rainfall (208 mm) for the area (Table 1). Rainfall distribution varied considerably among seasons; from sowing to the fifth leaf unfolded stage (from 0 to 15, Zadoks et al., Reference Zadoks, Chang and Konzak1974), it was very low (15 mm) in season I, but higher in season II and III (about 100 mm) accounting for about 50% of total rainfall. From the fifth leaf unfolded stage to heading (from 15 to 50, Zadoks et al., Reference Zadoks, Chang and Konzak1974) rainfall was higher in seasons I (66 mm) and III (79 mm) than in season II (36 mm). From heading to full ripeness (from 50 to 92, Zadoks et al., Reference Zadoks, Chang and Konzak1974), it was about 120 mm in season I, accounting for more than 50% of total rainfall and only about 30 mm in seasons II and III.
The weather trends during the three seasons resulted in accordance with those reported by Aschman (Reference Aschman, Di Castri and Mooney1973) as typical of the Mediterranean climate.
RESULTS
Pheno-morphological traits
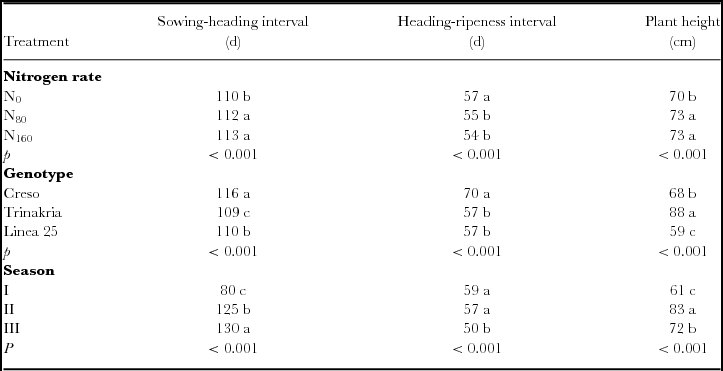
The measured pheno-morphological traits were influenced by the main factors (nitrogen rate, genotype and season), but not by their interactions. The application of either N80 or N160, compared to the control (N0), resulted in slight, but significantly so, longer time intervals between sowing and heading (113 vs. 110 days) as well as a shorter duration between heading to ripeness (54 vs. 57 days) (Table 2). Creso showed both a significantly longer time between sowing to heading and heading to ripeness (116 and 70 days, respectively) compared to Trinakria and Linea 25 (on average 110 and 57 days, respectively). In season I, plants showed the shortest time from sowing to heading and the longest time between heading and ripeness; whereas in season III, plants showed the longest time sowing to heading and the shortest time heading to ripeness; in season II, plants showed intermediate values.
Pheno-morphological traits of durum wheat as affected by nitrogen rate, genotype and season.

Different letters within main factors indicate significance at LSD test (p ≤ 0.001).
Plant height increased significantly with nitrogen application whether N80 or N160 as compared to the control (73 vs. 70 cm). The tallest cultivar was Trinakria, the shortest Linea 25; Creso was intermediate. Plants, on average, were tallest in season II, and shortest in season I (Table 2).
Grain yield and components
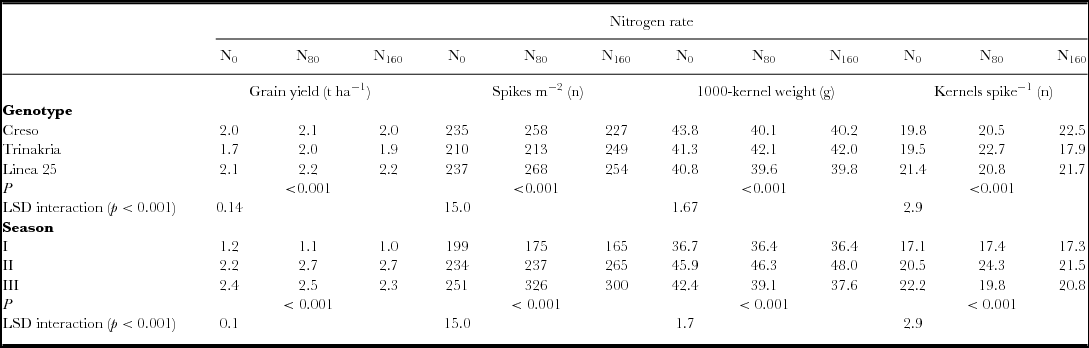
The significant ‘Nitrogen rate × genotype’ and ‘Nitrogen rate × season’ interactions showed how nitrogen effects on grain yield were genotype and season dependent. Grain yield, passing from N0 to N80, increased to a greater and more significant degree in Trinakria (+19%) than in Line 25 (7%) and Creso (5%), while following a further nitrogen increase, from N80 to N160, yield decreased more for Trinakria (−13%) than Line 25 (−5%) and Creso (−3%) (Table 3). Without nitrogen fertilization (N0), Creso and Linea 25 gave a 21% higher grain yield (about 2 t ha−1) compared to Trinakria. In seasons II and III, nitrogen fertilization, especially at rate N80, significantly increased the grain yield. By contrast, in season I, nitrogen especially at rate N160, showed a depressive effect on grain yield (Table 3).
Yield components of durum wheat as affected by the interactions ‘nitrogen rate × genotype’ and ‘nitrogen rate × season’.

The positive effects of nitrogen rate (N80) on grain yield were due mainly to a higher number of spikes m−2 in Creso and Linea 25 and to a higher number of kernels spike−1 in Trinakria (Table 4). For this latter genotype, the higher rate (N160) led to a marked and significant decrease in the number of kernels spike−1. The better yield performance of nitrogen fertilization in season II was brought about largely by the number spikes m−2 and 1000-kernel weight (N160) and number of kernels spike−1 (N80) (Table 3). In season III, only supply of 80 kg ha−1 of nitrogen increased the number spikes m−2.
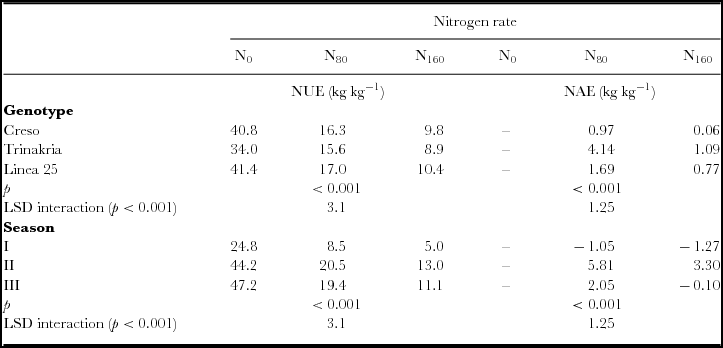
Nitrogen efficiency indices of durum wheat as affected by the interactions ‘nitrogen rate × genotype’ and ‘nitrogen rate × season’.

Nitrogen efficiency
The negative effect of high nitrogen rate on NUE was marked. It, significantly decreased overall as the N supply increased from N0 to N160. The decrease was more evident in both Creso and Linea 25 than in Trinakria (Table 4). Nevertheless, in the absence of nitrogen fertilization (N0), Trinakria showed a lower NUE (34 kg kg−1) than Creso and Linea 25 (on average about 41 kg kg−1) (Table 4). As the N supply increased from N80 to N160, the NAE, significantly decreased, but this decrease was higher in Creso (−94%) than in Trinakria (−74%) and the decrease in the latter was greater than in Line 25 (−54%) The low nitrogen rate N80 significantly improved NAE especially in Trinakria (4.14 kg kg−1). The values of the NAE showed that NAE was higher in season II than in season III, whereas NUE values were similar in seasons II and III. Further, regardless of nitrogen rate, NUE in both season II and III was about double that of season I (on average about 46 vs. 25 kg kg−1) (Table 4).
Grain quality
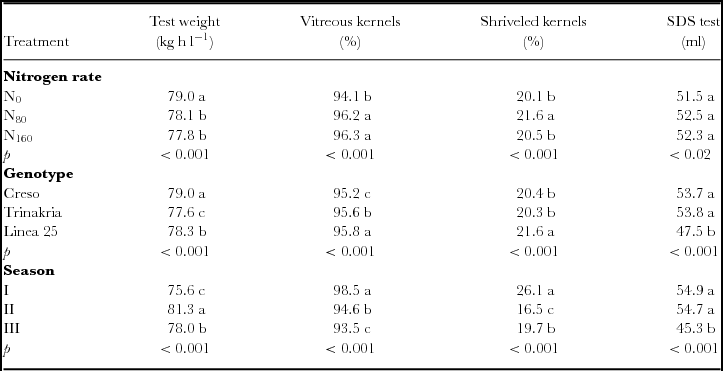
Some quality variables such as test weight, vitreous kernel, shriveled kernel and SDS test were almost always influenced by the main factors (nitrogen rate, genotype and season), but not by their interactions. Regardless of the other factors, N80 or N160 irrespectively compared to N0, determined a slight but significant decrease in test weight (78 vs. 79 kg hl−1) and a significant increase in the percentage of vitreous kernels (94 vs. 96%). Compared to Creso and Trinakria, Line 25 showed the highest percentage of vitreous and shriveled kernel and the lowest SDS test, whereas Creso showed the highest test weight and the lowest percentage of vitreous kernel. With respect to seasons, season I led to the lowest test weight and the highest percentage vitreous kernel and shriveled kernel compared to seasons II and III (Table 5).
Test weight, vitreous kernels, shriveled kernels and SDS test sedimentation of durum wheat as affected by nitrogen rate, genotype and season.

Different letters within main factors indicate significance at LSD test (p < 0.001).
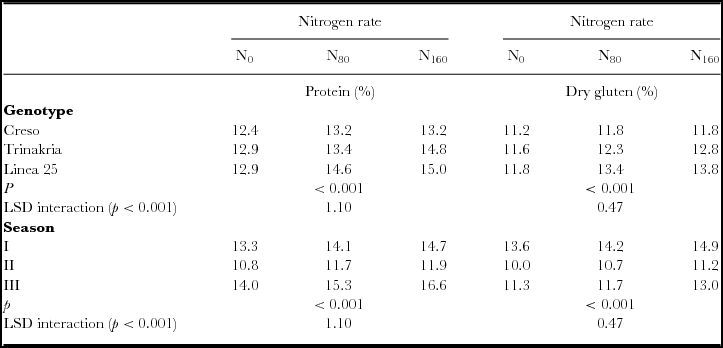
The significant ‘Nitrogen rate × genotype’ and ‘Nitrogen rate × season’ interactions showed how nitrogen effects on protein and gluten content were genotype- and season-dependent. Nitrogen fertilization up to N160 increased the protein and dry gluten content, but more markedly in Line 25 and Trinakria than in Creso (Table 6). For both protein and dry gluten content, the increase in response to N fertilization up to N160 was more evident in season III than in seasons I and II (Table 6).
Grain protein and dry gluten content of durum wheat as affected by the interactions ‘nitrogen rate × genotype’ and ‘nitrogen rate × season’.

DISCUSSION
Nitrogen fertilization has proved an effective means of improving grain yield and quality of durum wheat in the Mediterranean environment. Grain yield from 1.9 t ha−1 in the unfertilized plot (N0) increased up to 2.1 t ha−1 in response to 80 kg N ha−1 applied; a similar response of grain yield to N fertilization has been reported by other authors in rainfed conditions of a Mediterranean environment (Caliandro et al., Reference Caliandro, Cavazza, Marzi and Pacucci1981; Ercoli et al., Reference Ercoli, Lulli, Arduini, Mariotti and Masoni2011; Garrido-Lestache et al., Reference Garrido-Lestache, Lopez-Bellido and López-Bellido2005). Increasing nitrogen rate resulted in a decrease in NAE and NUE. Moreover, we found lower values of NUE at both the two studied N rates, compared to values with similar doses of N and in similar environments by Cossani et al. (Reference Cossani, Slafer and Savina2012), Lopez-Bellido et al. (Reference López-Bellido, López-Bellido and Redondo2005 and Reference López Bellido, López-Bellido and López-Bellido2006). This was likely due to a low soil-water availability in our experiment, rainfall in the three seasons being about 180 mm in comparison to about 280 mm in Cossani et al. (Reference Cossani, Slafer and Savina2012), and 300 and 550 mm in Lopez-Bellido et al. (2006).
The response of grain yield and N use efficiency to N fertilizer rate was genotype-dependent. Both Creso and Linea 25, without supplemental nitrogen fertilization, showed better performances than Trinakria in terms of grain yield (about 2.0 vs. 1.7 t ha−1) and NUE (about 40 vs. 34 kg kg−1). However, Creso and Trinakria seem to have the same capacity to take up nitrogen from the soil; indeed at N80 and N160, they had similar yields and NUE, in agreement with Motzo et al. (Reference Motzo, Fois and Giunta2004), who found that among cultivars belonging to intermediate (Trinakria) and modern (Creso) breeding eras the total nitrogen uptake is not significantly different.
A major response to N fertilization was noted in the lower yielding genotype ‘Trinakria’, instead, which proved more able to maximize NAE especially at N80. NAE represents the incremental efficiency of applied N as compared to the unfertilized test and is indicative of the cost-benefit ratio from investment in N inputs (Ierna et al., Reference Ierna, Mauro and Mauromicale2012). The positive effects of N fertilization on grain yield were mainly due to a higher number of spikes m−2 in Creso and Linea 25 in agreement with Albrizio et al. (Reference Albrizio, Todorovic, Maticb and Stellacci2010) and Caliandro et al. (Reference Caliandro, Cavazza, Marzi and Pacucci1981) and to a higher number of kernels spike−1 in Trinakria in agreement with Karam et al. (Reference Karam, Kabalan, Breidi, Rouphael and Oweis2009).
‘Trinakria’ was the only variety with higher yields in season III than in season II, likely due to the greater rainfall from the fifth leaf unfolded stage to heading in the former (79 vs. 36 mm), which allowed N to act upon the main components of the yield (number of spikes m−2 and grain with high 1000-kernel weight) (data not shown). Indeed, in tests made over several years in the same environment characterized by varying rainfall, ‘Trinakria’ responded to nitrogen fertilization (N80) only in those years in which the aridity index measuring rainfall and mean temperatures were higher and the rainfall was concentrated in the period before heading (Lombardo and Tuttobene, Reference Lombardo and Tuttobene2000).
The response of grain yield and N use efficiency to N fertilizer rate was season-dependent, concurring with the weather conditions of each season, given that the available N in the soil in the three different years was similar, namely 29.8, 26.2 and 31.0 kg ha−1 for the three seasons. In season I, owing to both higher temperatures and irregular rainfall which was absent or nearly so until heading and mainly concentrated from heading to full ripeness, nitrogen fertilization did not have any effect on grain yield. In addition, in that season sowing date was delayed by about one month, compared to seasons II and III, and this meant a reduction in the growth cycle (140 vs. 180 days). Therefore, in rainfed conditions in a Mediterranean environment, nitrogen fertilization should be commensurate to the sowing date and rainfall distribution. When sowing date is late and water is the limiting factor for plant growth, it is not appropriate to supply N fertilizers because root growth is restricted and fertilizer is not effectively dissolved in the soil water, so applied N will not be absorbed efficiently and may, if unused by the crop, be damaging to the environment.
In seasons II and III, nitrogen fertilization, especially at rate N80, significantly increased grain yield due to ideal weather conditions (optimal temperature and well-distributed rainfall) throughout the cycle. In particular, rainfall was high (about 100 mm) in the two seasons, accounting for about 50% of total rainfall. It was intermediate accounting for about 30% of total rainfall from the fifth leaf unfolded stage to heading and was low accounting for about 16% of total rainfall from heading to full ripeness. This rainfall distribution enabled a positive impact of the applied N, expressed in season II with an increase in the number of kernels spike−1 (N80) and number of spikes m−2 and 1000-kernel weight (N160) and in season III, with an increase in the number of spikes m−2 (N80). Nitrogen fertilization showed greater efficiency in season II than in season III, as the higher values of NAE demonstrate. This may be attributed to the negative effect of higher rainfall from the fifth leaf unfolded stage to heading, equal to 38% (season III) compared to 20% (season II), which probably stimulated a tiller proliferation (Simane et al., Reference Simane, Struik, Nachit and Peacock1993), leading to a higher number of spikes m−2 but not accompanied by an adequate number of kernels spike−1 and 1000-kernel weight. Nitrogen application at N80 or N160 reduced test weight compared to No in agreement with Garrido-Lestache et al. (Reference Garrido-Lestache, Lopez-Bellido and López-Bellido2005), though it was always above the minimum acceptable level (76 kg h l−1) and increased vitreous kernel percentage, in accordance with Abad et al. (Reference Abad, Lloveras and Michelena2004), Anderson (Reference Anderson1985), Ryan et al (Reference Ryan, Nsarellah and Mergoum1997). The percentage of vitreous kernels by far exceeded the quality standards for most commercial agreements, which is 80% (Mahaut, Reference Mahaut1997). Vitreous kernels together with grain protein content, are recognized as being influenced mainly by N application (Oweis et al., Reference Oweis, Pala and Ryan1999), but also by cultivar, due to different uses of available soil N and by season, due to variability in weather trends. The SDS test, an indicator of gluten strength, was not influenced by the nitrogen fertilization, but by genotype as observed previously (Boggini et al., Reference Boggini, Doust, Annichiarico and Pecetti1997). Other authors found only little variation of SDS with N fertilization (Lerner et al., Reference Lerner, Seghezzo, Molfese, Ponzio, Cogliotti and Rogers2006).
Nitrogen fertilization had a positive effect on both grain protein and dry gluten content, increasing on average by 14.3 and 12.8% respectively in response to 160 kg N ha−1 applied. Grain protein and dry gluten response to N fertilization was similar to that reported by other authors in rainfed Mediterranean environment conditions (Garrido-Lestache et al., Reference Garrido-Lestache, Lopez-Bellido and López-Bellido2005). They found a satisfactory yield response up to 100 kg N ha−1, but higher N input was necessary to achieve good quality standards. We also found a different pattern of response of grain yield and grain protein content to N fertilization: up to 80 kg N ha−1 both grain yield and grain protein increased in parallel, but from 80 to 160 kg N ha−1 grain protein content continues to increase, while grain yield decreased. This differential response of grain yield and grain protein content to fertilizer N may be attributed to competition between vegetative and reproductive growth, and also to the shortage of water and to the typically high temperatures of Mediterranean areas during the grain filling stage, which can reduce grain carbohydrate accumulation rather than N accumulation (Gooding and Davies, Reference Gooding and Davies1997).
The response of grain protein and dry gluten content to N fertilization rate was genotype- and season-dependent.
In unfertilized control, compared to Trinakria, Creso showed a lower content of protein (12.4 vs. 12.9%) and consequently of gluten (11.2 vs. 11.7%), in agreement with Motzo et al. (Reference Motzo, Fois and Giunta2004) and Fois et al (Reference Fois, Schlichting, Marchylo, Dexter, Motzo and Giunta2011) that report a clear trend of decreasing average protein content from old to modern cultivars, presumably owing to the dilution effect caused by their heavier grains. Both Linea 25 and Trinakria were able to exploit N fertilization to improve grain quality: the former up to N80, the second up to N160, whereas Creso did not usefully use nitrogen fertilization in this study, to improve both grain yield and quality. This knowledge on the differential response of genotypes to use N fertilizers and available soil N is crucial for choosing genotypes in relation to various agricultural systems: with zero, low or high N fertilizer input and with the priority towards very high quality grain. The choice therefore falls on the modern Creso when it is preferred not to use N fertilization and the quality is not a priority; vice versa, Trinakria and Linea 25 are better choices when N fertilization up to 160 kg ha of N can be applied and the aim is high grain quality.
Grain protein and dry gluten content respond to progressively increasing N rate from N0 to N160 in the three growing seasons, consistently with findings of Ercoli et al. (Reference Ercoli, Lulli, Arduini, Mariotti and Masoni2011), Garrido-Lestache et al. (Reference Garrido-Lestache, Lopez-Bellido and López-Bellido2005) and Labuschagne et al. (Reference Labuschagne, Meintjes and Groenewald2006), but with a greater increase from N0 to N80 than from N80 to N160. Grain protein and dry gluten content are important quality parameters for durum wheat, as the former is widely used as a criterion in determining premium prices and the latter as an indicator of gluten strength for pasta quality. According to UNI EN ISO 9001 quality management system, a threshold of 11.5% for protein content as the lower limit for class 3 grain is indicated and a threshold of 12% for dry gluten to ensure acceptable pasta quality (Landi, Reference Landi, Di Fonzo, Kaan and Nachit1995). In this experiment, N fertilization at N80 would be necessary to accomplish the limit for protein content in the season II and to accomplish the limit for dry gluten in the season III, thus proving an important strategy to improve the grain quality of durum wheat.
Apart from the dose of nitrogen, the timing is also important to optimize wheat quality under rainfed Mediterranean conditions, given that it is recognized that application between tillering and stem elongation is more efficacious (Ercoli et al., Reference Ercoli, Lulli, Arduini, Mariotti and Masoni2011; Fuertes-Mendizàbal et al., Reference Fuertes-Mendizábal, Aizpurua, González-Moro and Estavillo2010). What is vital is not to apply the nitrogen later than stem elongation and to avoid the typical water stress period in spring in Mediterranean conditions (Lopez-Bellido et al., Reference López-Bellido, López-Bellido and Redondo2005). With split N fertilizer applications, smaller N rates than usual can be used (Fuertes-Mendizàbal et al., Reference Fuertes-Mendizábal, Aizpurua, González-Moro and Estavillo2010), resulting in better translocation of pre-anthesis assimilates to the grain and in decreasing N losses from the soil–plant system, which may have important consequences for energy-production costs and on the potential reduction of environmental pollution.
Given the high variability in weather conditions, especially with rainfall in the Mediterranean environment, and the differential response of genotypes to nitrogen fertilization and weather conditions, further research will be necessary in our environment to evaluate the effect of timing, splitting and rate of N, including less than 80 kg ha−1 which is the normal dose used.
CONCLUSION
Nitrogen fertilization has proved to be effective in improving grain yield and quality of durum wheat. In comparison to unfertilized plots, N80 was able to maximize the yield performances of the crop up to 2.1 t ha−1, keeping the NUE index at an acceptable level (16.3 kg kg−1); whereas N160 further improved grain quality measured through grain protein (up to 14.3%) and dry gluten content (up to 12.8%), but had a detrimental effect on grain yield and nitrogen efficiency. Genotypes responded differently to N fertilization in our experiment. Creso proved wholly unresponsive to nitrogen both for grain yield and quality, Trinakria showed the greatest potential to use nitrogen fertilizer both in terms of grain yield and NUE at 80 kg ha−1 of N and grain quality at 160 kg ha−1 of nitrogen, while ‘Line 25’ used the 80 kg ha−1 well, for yield but above all for the much improved quality. This knowledge on the ability of the different cultivars to use N could be used to choose the cultivar in relation to the agricultural systems: with zero, low or high N fertilizer input and with the priority towards very high quality grain.
However, the effect of N fertilization on grain yield and N use efficiency depended on weather conditions during the crop cycle, in particular rainfall distribution. The best responses in terms of yield and efficiency of use was when about 80% of total rainfall occurred from sowing to heading and no effect instead when rainfall was very low in this first period and abundant from heading to full ripeness.
Overall, in seasons with regular rainfall in quantity and distribution, our data show that combining no more than 80 kg ha−1 of nitrogen fertilization with genotypes characterized by a more efficient response to nitrogen fertilization, is a useful tool to improve the agronomic and qualitative performances of the crop, ensuring a more environment-friendly nitrogen fertilization at the same time.