Introduction
The Quaternary lacustrine sediments deposited at the Dead Sea basin (Fig. 1A) record the hydroclimatic conditions in the Dead Sea watershed and, in turn, that of the central Levant region (Neev and Emery, Reference Neev and Emery1967; Begin et al., Reference Begin, Ehrlich and Nathan1974; Stein, Reference Stein2001). The paleoclimate is recorded partly by annually deposited primary aragonite and silt laminae, both during the late Holocene (Heim et al., Reference Heim, Nowaczyk, Negendank, Leory and Ben-Avraham1997; Migowski et al., Reference Migowski, Stein, Prasad, Negendank and Agnon2006) and the last glacial Lake Lisan (e.g., during Marine Isotope Stage 2 [MIS 2; ~30–17.4 ka]; Prasad et al., Reference Prasad, Vos, Negendank, Waldmann, Goldstein and Stein2004). The sedimentology of the lacustrine deposits of the ancient water bodies filling the Dead Sea basin (i.e., the mineralogy and sedimentology such as aragonite, gypsum, salt, and fine detritus) records the paleohydrology in the watershed of the basin (Stein et al., Reference Stein, Starinsky, Katz, Goldstein, Machlus and Schramm1997; Bartov et al., Reference Bartov, Goldstein, Stein and Enzel2003; Enzel et al., Reference Enzel, Bookman, Sharon, Gvirtzman, Dayan, Ziv and Stein2003, Reference Enzel, Amit, Dayan, Crouvi, Kahana, Ziv and Sharon2008; Torfstein et al., Reference Torfstein, Gavrieli and Stein2005; Haliva-Cohen et al., Reference Haliva-Cohen, Stein, Goldstein, Sandler and Starinsky2012). In turn, the sedimentology and inferred paleohydrology reflect the impacts of global and regional climate forcing, in part related to the North Atlantic Ocean (Bartov et al., Reference Bartov, Goldstein, Stein and Enzel2003; Haase-Schramm et al., Reference Haase-Schramm, Goldstein and Stein2004; Kushnir and Stein, Reference Kushnir and Stein2010; Stein et al., Reference Stein, Torfstein, Gavrieli and Yechieli2010; Kiro et al., Reference Kiro, Goldstein, Lazar and Stein2016) or solar activity (Prasad et al., Reference Prasad, Vos, Negendank, Waldmann, Goldstein and Stein2004). This mainly reflects the activity of the Mediterranean cyclones that cause most of the rain precipitation in the central and northern parts of the Dead Sea watershed (Ziv et al., Reference Ziv, Dayan, Kushnir, Roth and Enzel2006; Zipori et al., Reference Zipori, Rosenfeld, Shpund, Steinberg and Erel2012). Yet, in several time intervals (e.g., during the peak of the last interglacial period [MIS 5e]), there are hypotheses for the potential importance of the contribution of moisture from southern sources (Waldmann et al., Reference Waldmann, Torfstein and Stein2010; Torfstein et al., Reference Torfstein, Goldstein, Kushnir, Enzel, Haug and Stein2015).
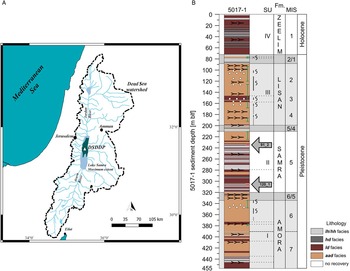
(color online) (A) Location map showing the natural Dead Sea (green area); Lake Samra’s maximum extent estimated based on the −420 m below sea level contour (after Waldmann et al., Reference Waldmann, Starinsky and Stein2007) (marked as light blue area); deep core 5017 location in the lake’s center (white triangle, Dead Sea Deep Drilling Project [DSDDP]); and the watershed of the Dead Sea as dashed black line. (B) Core lithology and facies according to Neugebauer et al. (Reference Neugebauer, Brauer, Schwab, Waldmann, Enzel, Kitagawa and Torfstein2014): aad, alternating aragonite and detritus; hd, halite and detritus; ld, laminated detritus; lh/hh, layered halite/homogenous halite. “Fm.” stands for the associated formations documented in the current onshore exposures. Gray arrows mark locations for sections 91_2 and 120_1 that were studied in this work. m blf, meters below lake floor; MIS, Marine Isotope Stage; SU, sediment unit (see Neugebauer et al., 2014).

The lacustrine sediments of the last glacial period and the middle to late Holocene (the Lisan and Ze’elim Formations, respectively) were studied in exposures and cores drilled along the shores of the lake (Stein, Reference Stein2014 and references therein). Sedimentary sequences of earlier interglacial periods deposited during low lake stands are not well exposed at the lake’s margins, and their characteristics are unknown. A ~450-m-long core (the Dead Sea Deep Drilling Project [DSDDP]) drilled during 2010 at the deeps of the Dead Sea (water depth of ~300 m), recovered the past 220 ka lake history (Neugebauer et al., Reference Neugebauer, Brauer, Schwab, Waldmann, Enzel, Kitagawa and Torfstein2014; Torfstein et al., Reference Torfstein, Goldstein, Kushnir, Enzel, Haug and Stein2015) including the sediments representing interglacial periods MIS 1, MIS 5, and late MIS 7 (Fig. 1B). These interglacial sediments contain long sequences of halite, unknown from any of the exposures. Of all the halite sequences recovered in the core, we focus here on a sequence comprising layered halite (in thin beds) intercalating with laminae of fine detritus.
Modern halite began depositing in the Dead Sea basin when the lake level dropped in the twentieth century (during the 1970s) to levels less than 400 m below sea level (Gavrieli and Oren, Reference Gavrieli and Oren2004). Therefore, the well-bedded halite facies present an opportunity to study in high resolution the hydroclimatic variability in the Levant (through the Dead Sea watershed) during one of the most arid intervals of the last interglacial period (Torfstein et al., Reference Torfstein, Goldstein, Kushnir, Enzel, Haug and Stein2015; Kiro et al., Reference Kiro, Goldstein, Lazar and Stein2016). We apply detailed petrographic, chemical, and statistical tools to characterize the depositional environments of the layered facies, identify high-resolution cycles of halite deposition, and then discuss and propose the global and regional implications of the climate forcing during these intervals.
Methods
Selecting the sequences
Different halite facies were documented in the DSDDP core (Neugebauer et al., Reference Neugebauer, Brauer, Schwab, Waldmann, Enzel, Kitagawa and Torfstein2014; Kiro et al., Reference Kiro, Goldstein, Lazar and Stein2016). Here, we focus on the layered halite, termed either lh (layered halite; Neugebauer et al., Reference Neugebauer, Brauer, Schwab, Waldmann, Enzel, Kitagawa and Torfstein2014) or sh (striped halite; Kiro et al., Reference Kiro, Goldstein, Lazar and Stein2016). The facies comprises thin layers of very fine halite crystals that intercalate, at the subcentimeter scale, with fine- to very fine-detritus laminae (Fig. 2A). The lh facies comprises 8% of the total recovered halite in the DSDDP core and primarily appears in the core interval associated with the last interglacial period (Kiro et al., Reference Kiro, Goldstein, Lazar and Stein2016). We identified five sequences of continuous, well-layered, and undisturbed (by major secondary growth of crystals, slumps, changing facies, etc.) sequences of the lh and lh subfacies in the core that presented similar qualities of high-resolution micro-X-ray fluorescence (μXRF) measurements (details given subsequently).
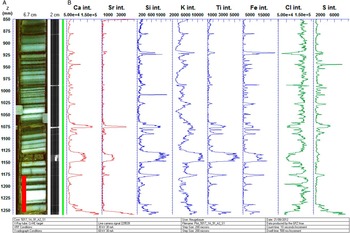
(A) Layered halite (lh facies; Neugebauer et al. Reference Neugebauer, Brauer, Schwab, Waldmann, Enzel, Kitagawa and Torfstein2014) from Inter-Continental Drilling Project core 5017, section 1_A_91_2_1. White beds are halite (see text); dark beds contain fine detritus and some authigenic minerals (see text). The Z column is the depth in the core section in millimeters. (B) High-resolution micro-X-ray fluorescence (μXRF) measurements showing Ca, Sr, Si, K, Ti, Fe, Cl, and S elemental intensities; the plot was done using “ReadyCore.” The red bar represents where the thin section was taken from (see Fig. 3). Each couplet of white and brown laminae represents annual deposition, where the brown layer contains elements that were carried to the lake by floods (e.g., Si). For references to color in the figure, see the online version of this article.

Two of these five core sections were chosen for time-series analyses as they presented the longest sequences: (a) a 40-cm-long core section recovered from 233 m below the lake floor (tagged 5017_1_A_91_2_1 in the core repository and referred to here as 91_2) and (b) a 60-cm-long core section from 307 m below the lake floor (tagged 5017_1_A_120_1_1 and referred to here as 120_1) (Figs. 1B and 2A). We note that section 120_1 contains several intercalations between gypsum and fine detritus rather than halite and fine detritus (discussed subsequently). They were specifically selected because section 120_1 represents the onset of MIS 5e at ~130 ka, and section 91_2 represents the end of MIS 5e at ~116 ka, according to the age-depth model of the core dated by Torfstein et al. (Reference Torfstein, Goldstein, Kushnir, Enzel, Haug and Stein2015).
Thin section analysis
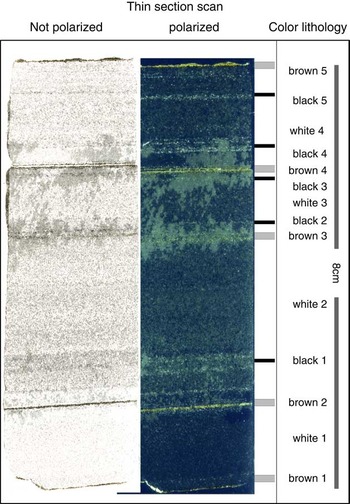
More than 30 thin sections from the halite sections, each 5–10 cm long and prepared using two-component epoxy glue, were analyzed under a microscope. An example is an 8-cm-long thin section from the lh facies core section 91_2 (Fig. 3). These thin sections were analyzed, by polarized light microscope, for microfacies lithology, morphology of halite crystals, layer contacts and boundaries, and the presence of other minerals and their respective internal structures. The thin sections were also used to exemplify the counting of sublayers and for determining their exact thickness.
(color online) Selected thin section from core section 1_A_91_2_1 sampled at 233 m core depth (i.e., at ~950 m below sea level). The thin section consists of four white, five brown, and five black layers marked in the color lithology column.

μXRF scanning
The elemental composition of the entire 5017-1 (DSDDP) core was analyzed by an ITRAX µXRF core scanner (Croudace et al., Reference Croudace, Rindby and Rothwell2006) at 1 mm/1 s intervals at GFZ Potsdam (Neugebauer et al., Reference Neugebauer, Brauer, Schwab, Waldmann, Enzel, Kitagawa and Torfstein2014). A Chromium tube was utilized, which is particularly sensitive to lighter elements, producing a 30 kV voltage and a 30 mA current (e.g., section 91_2 scan at Fig. 2B)
As we realized that the previously described scanning resolution was not sufficient for our purposes, additional high-resolution µXRF measurements (200 μm intervals, 10 s reading duration) were taken from 18 sections presenting various facies of halite and fine detritus (Supplementary Material [Data Repository 2]). These measurements present greatly improved total counts of Si, S, Cl, K, Ca, Ti, Fe, Br, Sr, and Zr. The data obtained by the μXRF are expressed as net intensities of elements (in counts per second). We used the intensities of eight elements (Cl, Al, Ti, S, K, Ca, Sr, and Si) to characterize the chemistry and deduce, with the support of the thin sections, the most common and indicative minerals in the sequence (halite, gypsum, aragonite, Al-silicates, quartz, and calcite). Principal component analysis (PCA; using JMP 9.0.0) detected the covariations of the large set of elements obtained (Davis and Sampson, Reference Davis and Sampson1986); it was also essential in determining the exact submillimeter-scale boundaries of the respective lithologies along the layered halite.
The elemental intensities, in turn, indicate variations in the controlling depositional processes and environmental conditions in the basin that control halite deposition and fine-detritus input. The µXRF data, along with microscopic analysis at the tens of micrometers scale, assisted in correlating the elemental readings with the detailed petrography of the thin sections.
Environmental scanning electron microscope imaging
In addition, section 91_2 was analyzed by an environmental scanning electron microscope (ESEM; Quanta 200 from FEI Inc., equipped with an EDAX energy dispersive X-ray spectrometry system) at the Hebrew University. The results from the ESEM assist in identifying the minerals undetected by the polarized microscope.
Results
The lh facies
The lh (or sh) facies studied here at high resolution is one of the different halite facies in the DSDDP core (Neugebauer et al., Reference Neugebauer, Brauer, Schwab, Waldmann, Enzel, Kitagawa and Torfstein2014; Kiro et al., Reference Kiro, Goldstein, Lazar and Stein2016). This facies was hypothesized to represent arid intervals with extreme dry conditions, with a stratified water column and occurrences of occasional floods; also, proximity to the shore where high energy would break the rafts into smaller cumulates was suggested for this facies (Kiro et al., Reference Kiro, Goldstein, Lazar and Stein2016). It consists of layered, consolidated white-to-gray fine-grained halite crystals intercalated with thin laminae (~0.25 mm; Table 1) of mainly clay-size detritus, which were proposed to represent annual deposition cycles (Neugebauer et al., Reference Neugebauer, Brauer, Schwab, Waldmann, Enzel, Kitagawa and Torfstein2014) (Figs. 2A and 3). The top of section 120_1 contains gypsum in addition to halite intercalating with the detritus. We refer to this subfacies as part of the lh facies. A depositional cycle is defined here as the observed couplet of salt or gypsum and detritus laminae deposited under the seasonal climatic forcing in the Dead Sea basin and its watershed (e.g., wetter or colder winters and drier and warmer summers).
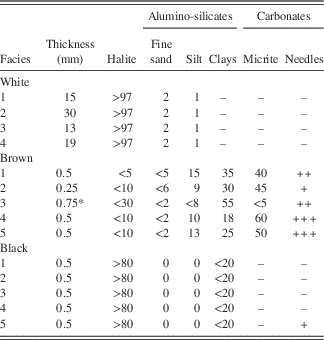
Properties of layers. Numbers are estimates in %. Symbols: a few grains were identified (+); numerous grains were identified (++); countless grains were identified (+++); no grains were identified (–); coupling of two layers (*).

Note: Method of estimations is as follows. A Nikon polarized light microscope was used to analyze the thin section. Thickness was measured using mm paper (attached scan) and measuring the laminas in ×40 magnified view. Percentage estimations were done along each layer, evaluating the area visible in several locations. Identifying fine sand from silt fractions was done using ×100 magnified view, counting the grains larger than 50–60 μm. The identification of silt from clay was done using ×200 and ×400 magnifications by estimating the amount larger than 4–5 μm. Micrite facies was recognized by its high birefringence colors. Halite crystals all show cubic euhedral habits.
In finer detail, the lh facies comprises three types of layers/laminae, termed here according to their appearance as white, brown, and black (Fig. 3), which are described subsequently. The three types present distinct chemical and mineralogical compositions (see following sections) as detected by the µXRF intensities. Selected features of the various beds, such as thicknesses, mineralogy, orientations, and crystal and grain sizes and shapes, are summarized in Table 1.
The white layers
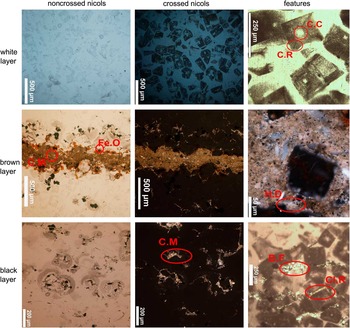
The white halite layers are very common and prominent, and they occur repeatedly (at least four times) in the lh facies in the thin section of 91_2 (Figs. 3 and 4) and in others. The white layers are 13–30 mm thick (Table 1) and comprise mainly well-preserved cubic halite crystals with traces of fine-detritus grains (Fig. 4). The white layers as a whole, not the individual crystals, are occasionally dotted with darker silt-size grains. These grains do not form continuous layers, nor are they gathered in any organized structure within the white layer; instead, they are scattered throughout the layer. Hence, the white layer is dominated by halite (i.e., by high chlorine intensities; Fig. 2) with varying amounts of potassium, but distinctly low intensities of all other elements. The individual halite crystals are 200–250 μm thick and euhedral, lack dissolution surfaces, and are zoned with clear centers and cloudy rims, caused by the presence of numerous fluid inclusions (Fig. 4). Some overgrowth of halite is noted in the layer between the crystals. The uniform size and similar morphology of the crystals strongly indicate uniform precipitation conditions and simultaneous growth. There is no preferential orientation for the halite crystals; they appear to be scattered all over the layers without a noticeable pattern. The cubic crystals composing these halite sequences resemble hopper halite crystals that form below the brine–air interface (Supplementary Figure 1 [Data Repository 1]) and later sink to the lake’s floor (Dellwig, Reference Dellwig1955; Lowenstein and Hardie, Reference Lowenstein and Hardie1985; Kiro et al., Reference Kiro, Goldstein, Lazar and Stein2016). The halite crystals forming the white layers precipitated rapidly while capturing numerous brine inclusions and later continued growing at a slower rate at deeper depths, where clear crystals are filling the voids. These layers probably represent episodes of a high rate of halite deposition, presumably under net increased evaporation or colder temperatures that bring the brine to oversaturation (Sirota et al., Reference Sirota, Arnon and Lensky2016).
Light microscope view of the three layer types, white, brown, and black, as seen by regular and polarized lights. B.F, basin fill; C.C, clear center; Cl.R, clastic rim; C.M, clastic material; C.R, cloudy rims; Fe.O, Fe oxides; H.D, halite dissolution. In the white layer, the center of all the crystals is clear, probably marking slower growth during settling in the oversaturated for halite water column or at the bottom of the Dead Sea. The brown layer shows halite crystals that are in contact with this layer present dissolution features at their surfaces. This indicates a slight contact with somewhat fresher water and, therefore, water inflow to the lake, most probably by flooding; whereas, in the black layer, the halite crystals show neither dissolution features at their surfaces nor any other characteristic of a brown layer. The fine detritus in the rims probably formed near the brine–air interface. The pockets of fine detritus sank to the bottom alongside the halite crystals. Thus, we suggest that it is an eolian deposition of dust. For references to color in the figure, see the online version of this article.

We measured the thickness of all individual white laminae of core sections 91_2 and 120 _1. These two sections show different mean thicknesses of white laminae of 1.06 cm and 2.18 cm, respectively (Supplementary Figure 2 [Data Repository 1]). We discuss these differences and use the thickness to calculate the time series of the lh facies using fast Fourier transform (FFT) analysis.
The brown laminae
Thin brown laminae alternate with white halite layers (Figs. 3 and 4). They are characterized by a relatively uniform thickness (0.25–0.5 mm) and mineralogical composition (Table 1). According to the ESEM analyses, the brown laminae are enriched with Al-Si grains, organic matter, Fe oxides, and carbonate grains. Few aragonite needles were seen, and individual halite crystals were embedded in the layer. A few individual salt crystals containing high readings of K and Mg were identified in association with these thin brown fine-detritus laminae (Supplementary Figure 3 [Data Repository 1]). These could have formed in association between the brine and the clays. Dissolution surfaces were identified in these salt crystals, and mild dissolution was observed in the halite crystals from below and above the brown laminae (Fig. 4; Table 1). The brown laminae are characterized by higher counts of K, Ti, Ca, and Fe. In addition, higher counts of S indicate the presence of gypsum, and occasional higher Sr counts may indicate the presence of aragonite. To precipitate gypsum and aragonite from the Dead Sea brine composition, an external source for the sulfate and bicarbonate, respectively, is needed, indicating at least some water inflow into the lake (Stein et al., Reference Stein, Starinsky, Katz, Goldstein, Machlus and Schramm1997; Torfstein et al., Reference Torfstein, Gavrieli and Stein2005, Reference Torfstein, Gavrieli, Katz, Kolodny and Stein2008). It appears that the brown laminae were deposited during short episodes or events of fresher water inputs to the continually halite-depositing lake, carrying the fine detritus and the necessary anions to form the gypsum and aragonite. The presence of freshly produced aragonite by modern freshwater and sediment plumes entering the lake following floods was recently documented by Belmaker and Bookman (Reference Belmaker and Bookman2016).
The black laminae
Vague thin laminae appear in the thin sections as black lines but are transparent to the naked eye. Five of them are recognized in the example in Figures 3 and 4. These laminae present high contents (>80%) of halite crystals (Fig. 4) with occasional clay-size detritus as inclusions at the rim of the crystals (Fig. 4). However, most of the clay-size grains in these layers are sporadic pockets trapped between the halite crystals (Fig. 4). Apparently, halite crystal growth did not stop during the deposition of the fine detritus, nor did we find dissolution surfaces on the halite crystals associated with fresher water inputs, potentially suggesting dry deposition of the detritus.
We propose that during dust storms, the settling grains are trapped between and within the unaltered halite crystals that later precipitate to the lake floor. Occasionally, some fine dust grains are incorporated on the surface of the salt crystals while these are still growing at or near the lake surface (Fig. 4; Supplementary Figure 1 [Data Repository 1]). Therefore, these particles appear to conform to the crystal habits.
In our microscopic and ESEM observations, we did not identify any dissolution pits in the lh facies. This indicates that the section was never exposed, nor was it close to the surface. Even when the fine-grained clastic units were deposited, the lake was probably oversaturated with respect to halite. This is in accord with the findings of Kiro et al. (Reference Kiro, Goldstein, Lazar and Stein2016).
Chemical compositions
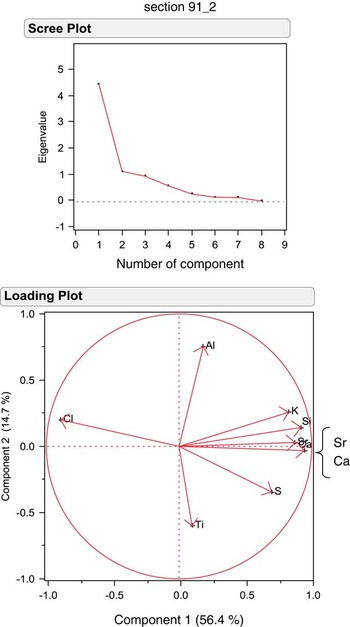
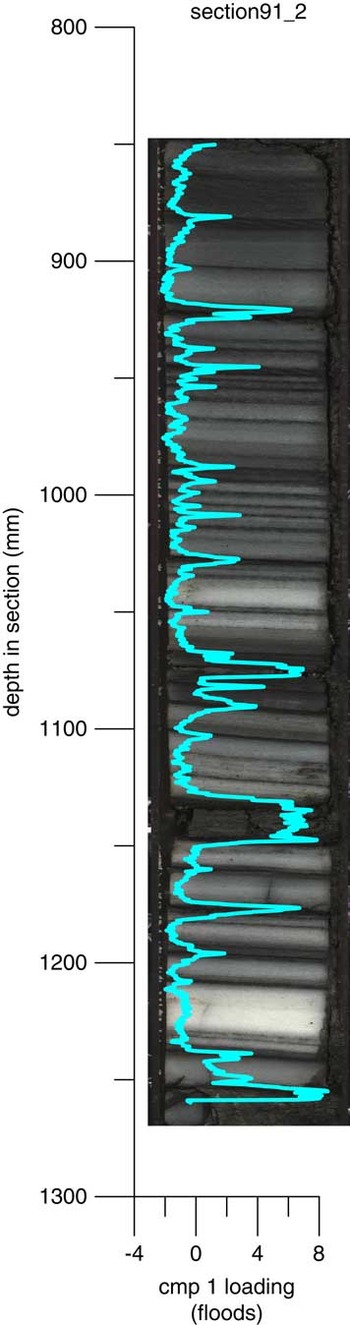
The detailed μXRF analysis was conducted on five sequences totaling ~2 m length of lh facies, including sections 120_1 and 91_2. The results were processed using PCA of the element counts along these sequences. The first principal component (PC1) explains >50% of the elemental composition variance in all five lh sequences analyzed (e.g., the PCA results of sections 91_2 and 120_1; Fig. 5 and Supplementary Figure 4 [Data Repository 1], respectively). PC1 closely follows the brown laminae (e.g., 91_2 and 120_1; Fig. 6 and Supplementary Figure 5 [Data Repository 1], respectively). Ca, Sr, Si, and K intensities compose this first component and present in the brown layers.
(color online) Principal component analysis of the micro-X-ray fluorescence readings from core section 1_A_91_2_1. The scree plot indicates that the first component is the last one found to be influential on the variance of the elemental counts (top). The loading plot depicts which elements are positive or negative, with the first component on the x-axis and the second component on the y-axis (bottom).

Compilation of the first component of the principal component analysis from core section 1_A_91_2_1 with the core image. The blue line is the loading of the first component, where it is low in the white layers and high in the brown layers. cmp 1 indicates the first component of the principal component analysis. For references to color in the figure, see the online version of this article.

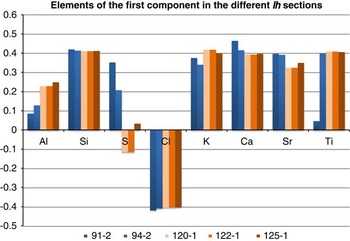
The brown layers in the two sequences, deposited at the end of the last interglacial period (i.e., core sections 91_2 and 94_2), show higher intensities of S when compared with the early last interglacial halite sequences (i.e., core sections 120_1, 122_1, and 125_1). The brown layers in the three sequences from the beginning of the last interglacial period are characterized by a higher content of K and Al (Fig. 7). This suggests that gypsum was deposited in association with the brown layers at the top sections (91_2 and 94_2).
The significance of elements in the first component of the principal component analysis, the eigenvalues (y-axis), in five representative layered halite (lh) sequences. The blue bars mark the sequences from the younger period, ~116 ka, and the orange bars mark the sequences from the older sequences, ~130 ka. Sulfur presence in the younger sections indicates gypsum precipitation during this period (in the brown layers). Also, there is somewhat more presence of Sr with Ca, which suggests the precipitation of aragonite. Taken together with the different Al and K readings, we suggest that the floods of 116 ka were more enriched with bicarbonate and sulfate than those of 130 ka (see text for details). For references to color in the figure, see the online version of this article.

Most of the white layers in section 120_1 are identical to the white layers of section 91_2, comprising only halite crystals. In some white layers in section 120_1, toward the top of the section, pronounced amounts of gypsum are noted alongside the halite crystals (Supplementary Figure 6 [Data Repository 1]).
The other principal components vary among the different sequences, each reflecting a relatively low percentage of the variance, and, at this point, they do not add to the interpretation of the lh sequences; therefore, they are not discussed here.
Discussion
The excellently preserved halite sequences in the DSDDP core allowed the identification of the temporal patterns of halite deposition and the influx of fine detritus into the deep part of the lake during the last interglacial period, when lake levels were relatively low (Waldmann et al., Reference Waldmann, Stein, Ariztegui and Starinsky2009; Torfstein et al., Reference Torfstein, Goldstein, Kushnir, Enzel, Haug and Stein2015; Kiro et al., Reference Kiro, Goldstein, Lazar and Stein2016; Neugebauer et al., Reference Neugebauer, Schwab, Waldmann, Tjallingii, Frank, Hadzhiivanova and Naumann2016). The lh facies sequences comprise white salt layers and brown detritus laminae that represent seasonal deposition. Neugebauer et al. (Reference Neugebauer, Brauer, Schwab, Waldmann, Enzel, Kitagawa and Torfstein2014) and Kiro et al. (Reference Kiro, Goldstein, Lazar and Stein2016) have suggested this is attributable to summer evaporation and winter flooding, but recently, it was shown that the saturation of the modern lake with respect to halite is also controlled by the temperature: during winter, the entire water column precipitates halite; whereas during summer, the epilimnion is undersaturated with respect to halite, which precipitates only in the hypolimnion (Sirota et al., Reference Sirota, Arnon and Lensky2016). The lh facies includes some black laminae possibly related to direct dry deposition of fine detritus in the lake during dust storms. We suggest that the brown laminae were deposited by flood plumes floating on the uppermost water layer because of its relatively lower density with respect to the saline lake water. Such fine-grained flood sediments can reach several kilometers into the lake and later sink to the deep basin (e.g., Stiller et al., Reference Stiller, Gat and Kaushansky1997). We did not find evidence for multiple flood events in a single brown layer; this indicates a single event reaching the center of the lake, corroborating the notion of a dry interval. Thus, the couplets of brown and white laminae of the lh facies are regarded as an annual deposition pattern under a common low lake level, depositing halite crystals with a seasonal influx of settling fine detritus.
Annual sedimentation characterizes the Dead Sea basin during various climatic episodes. For example, primary aragonite and silty detritus compose parts of the last glacial Lisan Formation, representing annual deposits (e.g., Machlus et al., Reference Machlus, Enzel, Goldstein, Marco and Stein2000; Prasad et al., Reference Prasad, Vos, Negendank, Waldmann, Goldstein and Stein2004). Similar sequences of fine-detritus and aragonite couplets or silty-detritus, aragonite, and gypsum triplets compose the late Holocene Ze’elim Formation and were interpreted as annual deposits (Migowski et al., Reference Migowski, Stein, Prasad, Negendank and Agnon2006). A conceptual model (Supplementary Figure 7 [Data Repository 1]) based on the preservation of mass during compaction of the depositing halite further supports the interpretation of the layered halite in the deep basin as annually deposited. In the following, we discuss the frequencies of evaporates and fine-detritus deposition in such well-bedded halite/gypsum intervals. We hypothesize that, accepting halite layers as seasonal deposits, they should record meaningful periodicities related to known decadal-scale variability affecting climate in the Levant.
The two layered halite sequences: similarities and differences
We selected two halite sequences for detailed analysis (120_1 and 91_2). They were deposited during two short specific intervals: one during the beginning of MIS 5e and the other just after the end of MIS 5e, centering at ~130 ka and ~116 ka, respectively (the chronology is based on the age-depth model of Torfstein et al. [Reference Torfstein, Goldstein, Kushnir, Enzel, Haug and Stein2015]). Although the two sequences come from different intervals of the last interglacial period, both are similar in their chemical composition, mineralogy, and characteristic facies, except for the appearance of gypsum in the white layers at the top of section 120_1. In both sequences, the PC1 follows the appearance of the brown laminae (Fig. 6; Supplementary Figure 5 [Data Repository 1]) and has similar characteristics (Fig. 7).
The white layers (i.e., those composed of halite) of the two sections have quite different mean layer thicknesses, which warrants explanation. If halite deposition is directly and only related to the evaporation of brines from the overlying water column that is saturated for halite, the double thickness of the halite layers would suggest a double evaporation rate of the Dead Sea brine. However, observations and models reveal that annual evaporation rates can be expected neither to be doubled nor to be halved (Stanhill, Reference Stanhill1994; Lensky et al., Reference Lensky, Dvorkin, Lyakhovsky, Gertman and Gavrieli2005). Therefore, halite layer thickness must reflect other environmental, limnological, or depositional changes in the lake such as temperature (Sirota et al., Reference Sirota, Arnon and Lensky2016) or amount of freshwater influx (Kiro et al., Reference Kiro, Goldstein, Lazar and Stein2016). The beginning of MIS 5e is characterized by white layers that are twice as thick as those at the end of MIS 5e (Supplementary Figure 2 [Data Repository 1]). This observation may result from different environmental conditions favoring enhanced halite deposition in the deep basin at ~130 ka.
In both sections of the core, the brown laminae are similar in appearance and thickness, but they too present minor and probably important differences in elemental characterization (Fig. 7). The brown layers of the lh facies at the end of MIS 5e (~116 ka) are richer in bicarbonates and sulfates than the section from the beginning of MIS 5e (~130 ka). The brown layer from the end of the interglacial period has higher intensities of S, which, together with Ca, indicates the presence of gypsum (Fig. 7). On the other hand, the brown layers within the lh facies from the beginning of MIS 5e have relatively higher Al counts, indicating more detritus sediments. It appears that toward the end of the interglacial period, the gypsum was deposited in association with flood events.
Time series of halite deposition and clastic input
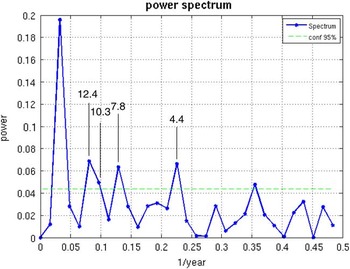
The variability in the thickness of the halite layers was used for time series analysis. First, we applied the analysis to each of the two selected sections (91_2 and 120_1 and with ~30–32 layers in each section). Then, because of their close resemblance, we combined the two data sets into one longer time series, even though they are separated in time. The two sections combined show 62 cycles of halite layers and detritus laminae (Supplementary Figure 2 [Data Repository 1]). To combine them into one series, each white layer thickness composed of halite or gypsum (Supplementary Figure 2 [Data Repository 1]) was scaled by division to the respective sequence mean thickness. Individual sections, and the combined and scaled thicknesses, were analyzed using FFT (Frigo and Johnson., Reference Frigo and Johnson.1998; Trauth et al., Reference Trauth, Gebbers and Marwan2007). This spectral analysis transforms sequential data (i.e., the scaled thickness) to reveal dominant frequencies, which are indicated by higher power (Fig. 8). We assume that if there is no apparent annual deposition and/or periodicity in the record, combining the two sequences should show weaker periodicities. This was not the case; the periodicities were strengthened.
(color online) Fast Fourier transform analysis, which gives the most dominant frequencies in a time series, of the white layer scaled thickness (see text) of two laminated halite core sections (e.g., 120_1 and 91_2). The x-axis values are given as 1/year. The strongest peak, on the left-hand side, is an artifact of the analysis representing the data set (62 yr). The second and third peaks (12.4 yr and 10.3 yr) represent one peak at ~11 yr. The fourth peak indicates a periodicity of 7.8 yr, and the fifth peak shows a periodicity of 4.4 yr. We suggest that these periodicities are annually controlled, as found in modern regional records (Hubeny et al., Reference Hubeny, King and Santos2006; Feliks et al., Reference Feliks, Ghil and Robertson2010). The dashed line at about 0.044 indicates the 95% confidence level of the frequencies (dominant power).

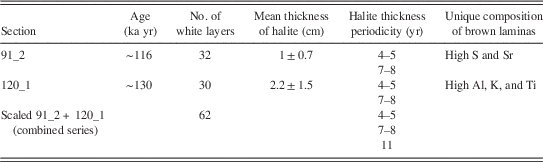
These analyses revealed two significant periodicities of 7–8 yr and 4–5 yr in each of the two unscaled (and scaled) sections. In the combined and scaled series, these two cycles appeared stronger, and a third periodicity of ~11 yr (combined of 12.4 and 10.3 peaks) appeared as well (Fig. 8; Table 2). These are the most common cycles observed in modern and ancient records from the Levant, the eastern Mediterranean, and Europe (discussed previously); they are expected to emerge only from annual records and annually layered sequences. Hence, we claim that layered sediments showing intercalation of evaporates and fine detritus in the Dead Sea are strongly affected by annual variability. In our case, it is the lh facies that present the variability in its halite layer thickness.
Characterization of the two best layered halite facies sequences and their fast Fourier transform results as year periodicities.

Solar activity, North Atlantic, and Levant annual periodicities
These subdecadal to decadal periodicities may suggest an influence of the North Atlantic Ocean on the sedimentation in the Dead Sea. The North Atlantic Oscillation (NAO) is the dominant mode of interannual atmospheric variability in the Northern Hemisphere and drives the climate and weather in the North Atlantic realm (e.g., Hurrell, Reference Hurrell1995; Wallace, Reference Wallace2000; Cini Castagnoli et al., Reference Cini Castagnoli, Bonino, Taricco and Bemasconi2002; Kodera, Reference Kodera2002). The periodicity of ~11 yr resembles the 11 yr solar activity cycle (Gnevyshev, Reference Gnevyshev1967), while the 7–8 yr cycle is also related to sunspot activity (e.g., Paluš and Novotná, Reference Paluš and Novotná2011) and shows phase coherence with the NAO index and near-surface temperature in Europe and atmospherically downstream areas (see also Loon and Meehl, Reference Loon and Meehl2014; Maliniemi et al., Reference Maliniemi, Asikainen and Mursula2014).
The appearance of these cycles and the way in which climatic signals at these frequencies are recorded at the Dead Sea lacustrine sediments is not a simple question to answer. This is especially so as some studies show a low correlation between wintertime rains in Israel and the NAO (e.g., Ziv et al., Reference Ziv, Dayan, Kushnir, Roth and Enzel2006). On the other hand, the NAO is better correlated with the temperature (rather than the precipitation) in the Levant (Mann, Reference Mann2002); thus, we speculate that some of the variability that we observe in the layered halite in the core may be related to winter temperatures as well. Other regional evidence suggests a link between the Dead Sea hydroclimate and the North Atlantic (e.g., Kushnir and Stein, Reference Kushnir and Stein2010): the instrumental archive of precipitation in Jerusalem, tree rings in the Golan Heights, and the Nile discharge volumes all show similar periodicities to those we found of 7–8 yr and 4–5 yr (Feliks et al., Reference Feliks, Ghil and Robertson2010). These records and others (Jeffrey, Reference Jeffrey1984; Cook et al., Reference Cook, Darrigo and Briffa1998; Da Costa and Verdiere, Reference Da Costa and Verdiere2002) are suggested to be linked to the NAO through the position of the Gulf Stream front as determined by sea surface temperatures. Several studies have pointed out that the 11 yr solar cycle affects the modern NAO and the Arctic Oscillation (AO) and is commonly detected in paleoclimate records from around the North Atlantic. The NAO and the AO are related, and the NAO teleconnection pattern can be viewed as the regional expression of the AO in the North Atlantic Ocean sector (Wallace, Reference Wallace2000). In support of the solar-NAO-AO association, Kodera (Reference Kodera2002) showed that the positive and negative phases of the solar cycle produce different spatial structures of the NAO and the AO, resulting in different effects on areas marginal to these phenomena. During the solar maximum phases, the NAO has a larger extent both vertically and spatially, extending into the stratosphere, similar to the AO; whereas, during the minimum phase, the NAO is confined to the eastern Atlantic Ocean sector in the troposphere (Kodera, Reference Kodera2002). As a result, during solar cycle minima, more cold air can be advected from the Arctic, resulting in colder winters in large parts of Europe (e.g., Brugnara et al., Reference Brugnara, Brönnimann, Luterbacher and Rozanov2013), even including southeastern Europe. That is, this different NAO response to solar variability potentially transfers the solar cycle into the cyclic records in Eurasia (i.e., surface cryosphere) (Kodera, Reference Kodera2002; Ogi et al., Reference Ogi, Yamazaki and Tachibana2003).
Even though we do not see a direct link between precipitation in the Levant and the NAO, we suggest that these cyclic records are possibly evident also in the Levant through lake deposits. More periodicity studies of sediments in the Levant, with longer time scales, are needed to establish such a connection.
Thus, the 11 yr periodicity reflects the solar cycle, which, as discussed previously, can be translated to the sediments of the Dead Sea through the NAO. The 7–8 yr and the 4–5 yr periodicities also reflect NAO influence on the Levant region. The dominant control of the North Atlantic Ocean on the hydrology of the Dead Sea region was demonstrated to operate at various time scales (Enzel et al., Reference Enzel, Bookman, Sharon, Gvirtzman, Dayan, Ziv and Stein2003; Haase-Schramm et al., Reference Haase-Schramm, Goldstein and Stein2004; Prasad et al., Reference Prasad, Vos, Negendank, Waldmann, Goldstein and Stein2004; Kushnir and Stein, Reference Kushnir and Stein2010; Torfstein et al., Reference Torfstein, Goldstein, Stein and Enzel2013). Moreover, performing a time series analysis on a ~10,000 yr long laminated section of the upper member Lisan Formation (~28–17.4 ka), Prasad et al. (Reference Prasad, Vos, Negendank, Waldmann, Goldstein and Stein2004) detected solar periodicities and a correlation to the Greenland ice core record. Here, we demonstrate that the NAO possibly dictated short-term, high-frequency cycles of hydroclimatic changes (e.g., temperature) in the Dead Sea basin during the overall dry last interglacial period. Hence, similar periodicities were identified during both the period of the last glacial high stand in Lake Lisan (Prasad et al., Reference Prasad, Vos, Negendank, Waldmann, Goldstein and Stein2004) and the penultimate interglacial low lake-level stand (this work), paced by the solar and NAO phenomenon that affected the hydroclimatic regime of the Dead Sea watershed during different regional and global climate regimes.
Summary
The layered halite sequences, which constitute 8% of the halite sequences recovered in the 5017-1-A Dead Sea core, represent three depositional processes all operating during distinctly low lake levels: (a) pure halite (white layers), (b) fine detritus with some gypsum deposited during wet seasons (brown laminae), and (c) fine detritus incorporated into and between halite crystals, probably indicating dry deposition during dry seasons (black laminae).
The lh facies document an annually deposited halite sequence. In such a case, the time series of the thickness of the halite layers is a time series inventory of halite accumulation during the selected intervals. In turn, this time series provides information on high-frequency variability in the lake’s limnology, which is directly related to the regional hydroclimatology, through rainfall and/or temperature. Specifically, it provides the variability of inflow/temperature during an interglacial phase, when the lake was hypersaline and supersaturated to halite. Statistical analyses, via FFT, of these laminated sequences indicate ~11, 7–8, and 4–5 yr cycles of droughts in the lake watershed.
Similar periodicities were identified in the last glacial period and in modern climate archives, suggesting a common mechanism affecting the regional climate. These periodicities are probably related to the effects of solar radiation and North Atlantic Ocean atmospheric circulation (through NAO) on the Levant hydroclimate.
Acknowledgments
Funding was provided by the Center of Excellence ISF grant no. 1736/11 to Y. Erel and Y. Enzel, the German Science Foundation (DFG; grant BR 2208/10-1), and DFG-Trilateral PALEX (BR 2208/13-1). This study is a contribution to the Helmholtz Association (HGF) climate initiative REKLIM Topic 8: rapid climate change derived from proxy data. We thank the Centre for Geobiology (University of Bergen, Norway) for supporting N. Waldmann’s DSDDP research. Further, we would like to thank V. Gutkin for ESEM technical support and E. Morin and Ofer Shamir for advising on the statistical analyses (all from the Hebrew University of Jerusalem), F. Ott and S. Wulf (both of GFZ Potsdam) for help during the µXRF measurements, and M. Köhler (MK Factory, Potsdam) for preparing thin sections. We thank B. Charlotte Schreiber from the University of Washington, Seattle, and Yael Kiro from the Lamont Doherty Earth Observatory for improving the paper with helpful reviews.
Supplementary material
For supplementary material/s referred to in this article, please visit https://doi.org/10.1017/qua.2016.10