Introduction
Declining soil fertility has for many years posed a serious challenge to the agriculture sector of developing countries, especially, those in sub-Saharan Africa (SSA). Replenishing lost soil nutrients has been reported as a crucial step to poverty alleviation (Place et al., Reference Place, Barrett, Freeman, Ramisch and Vanlauwe2003), via an increase in productivity. This is very crucial since agricultural activities are predominantly agrarian—employing a vast majority of rural households who are mostly poor. High rates of soil fertility decline, and consistently lower crop yields, therefore, necessitate increased use of fertilizer. This can only be possible by investing in the restoration of depleted soils (Ali et al., Reference Ali, Awuni and Danso-Abbeam2018).
Over the last few years, there has been an emphasis on fertilizer application as a solution to declining soil nutrients. This emphasis has particularly been resounding after the 2006 African Fertilizer Summit in Abuja (Sheahan et al., Reference Sheahan, Black and Jayne2013). This notwithstanding, several factors like cost, availability and credit constraints have threatened to derail such efforts (Liverpool-Tasie, 2016). This led to the introduction of fertilizer subsidy programs in several African countries, including Ghana (Ali et al., Reference Ali, Awuni and Danso-Abbeam2018). In Ghana, the fertilizer subsidy program covers inorganic fertilizers, and it has benefitted both large- and small-scale farmers (Fearon et al., Reference Fearon, Adraki and Boateng2015). The fertilizer subsidy program has led to higher adoption/application of fertilizer in Ghana (Fearon et al., Reference Fearon, Adraki and Boateng2015). Increased fertilizer application is the most important determinant of increasing agricultural productivity and farmers' income while at the same time helping to achieve food security (Jayne and Rashid, Reference Jayne and Rashid2013; Sheahan et al., Reference Sheahan, Black and Jayne2013).
In Ghana, vegetable production has gained a lot of attention in recent years and have become a major source of livelihood to smallholder farmers (Amoah et al., Reference Amoah, Debrah and Abubakari2014; Amfo and Ali, Reference Amfo and Ali2020). Vegetable production contributes positively to Ghana's economy and helps resolve the problem of poverty, hunger and malnutrition (Mohammed, Reference Mohammed2011). Although vegetable farming is predominantly small scale, majority of the production in Ghana takes place in the urban areas due to poor roads linking urban and rural areas (farming communities), lack of storage facilities in farming communities, and high demand among urban dwellers (Boateng, Reference Boateng2018).
Due to the continuous decline in soil fertility (Place et al., Reference Place, Barrett, Freeman, Ramisch and Vanlauwe2003), fertilizer application is key in increasing agricultural productivity (Jayne and Rashid, Reference Jayne and Rashid2013; Sheahan et al., Reference Sheahan, Black and Jayne2013). However, the adoption of fertilizer for crop production in Ghana is pretty low due to low-income levels of farmers. Therefore, a number of studies have been conducted on fertilizer adoption/application. Recent studies have focused on understanding the relationship between fertilizer adoption and crop yield (Sheahan et al., Reference Sheahan, Black and Jayne2013; Liverpool-Tasie, Reference Liverpool-Tasie2016; Ragasa and Chapoto, Reference Ragasa and Chapoto2017; Martey, Reference Martey2018; Burke et al., Reference Burke, Frossard, Kabwe and Jayne2019). Others investigated a wide range of issues related to fertilizer application and crop productivity in Ghana and West Africa as a whole (Burke et al., Reference Burke, Jayne and Black2017; Ali et al., Reference Ali, Awuni and Danso-Abbeam2018; Yeboah et al., Reference Yeboah, Amengor, Oteng-Darko and Ribeiro2019). These studies dealt with issues related to factors determining farmers' fertilizer adoption potentials, constraints of fertilizer usage, and impact of fertilizer use on profit maximization. Studies like Liverpool-Tasie (Reference Liverpool-Tasie2016) adopted a more specific approach by assessing the effects of inorganic fertilizer on maize production. They observed that inorganic fertilizer (nitrogen) use rate in Nigeria is often between 150 and 170 kg per hectare. The study further found that inorganic fertilizer application enhances productivity and profitability of farmers. However, low marginal physical product and high transportation costs significantly reduce the profitability of fertilizer use. Martey (Reference Martey2018), examined the welfare impact of organic fertilizer application in Ghana. He noted that while the use of organic fertilizer increases impacts of productivity and crop income by 1.43% and US$132, respectively, it reduces total household expenditure, food expenditure and poverty by US$174, US$58 and 8%, respectively.
The previous studies either focused on organic or inorganic fertilizers. Adopting a slightly different approach compared with those in existing literature, our study focuses on both organic and inorganic fertilizer application in Ghana. Our study, therefore, seeks to examine the interaction between organic and inorganic fertilizers and vegetable productivity in Ghana. To achieve this broad objective, specific objectives were carved out and further transformed into the following research questions. (1) What is the share of vegetable farmers who apply organic and inorganic fertilizers? (2) What is the difference in vegetable productivity among farmers who apply organic and inorganic fertilizers? (3) What is the causal interaction between the application of organic and inorganic fertilizers, and vegetable productivity in Ghana? (4) Which factors influence the application of organic and inorganic fertilizers, and vegetable productivity? Given that vegetable farmers are faced with decision making choice regarding which fertilizer to use or whether to combine both, it is imperative to examine these interactions, and how they affect productivity. Answering these questions is crucial to understand how these interactions contribute to the sustainable growth of the vegetable sector in Ghana. Also, understanding these interactions within farmers' socioeconomic context is vital in developing better and effective policies that can help improve the future of vegetable production in the country.
Methodology
Study location and sampling
The study was conducted in Kintampo North Municipal in the Bono East Region of Ghana. The municipal has an area of about 5108 km2. It has a population of about 95,480 (49.54% males and 50.46% females). The mean annual rainfall is between 1400 and 1800 mm. The municipal has two farming seasons: minor (April to July) and major (September to November). The vegetation, soil and climatic conditions favor the production of crops, including vegetables such as pepper, cabbage and lettuce. Agriculture is the predominant occupation in the municipal. Out of the 19,330 households in the municipal, 11,632 (60.2%) are into agriculture. About 91.4% of agricultural households are into crop production. Vegetables are major crops produced by farming households in the municipal (GSS, 2013).
Primary data were obtained from 300 pepper, cabbage and lettuce producers. This is because these three vegetables are produced by majority of vegetable-producing households in the municipal. Multistage sampling was used. In stage one, 20 villages were randomly selected from a list of 65 major farming villages obtained from Kintampo North Municipal Ministry of Food and Agriculture office. In stage two, vegetable producers were stratified into pepper, cabbage and lettuce farmers. Stage three involved the selection of respondents from the villages. In each village, 15 respondents were randomly selected: five each of pepper, cabbage and lettuce producers. Therefore, 100 each of pepper, cabbage and lettuce producers were interviewed. A semi-structured questionnaire was used to gather data through a personal interview in the local dialect of the study area in August, 2019.
Analytical framework
To correct for self-selection bias, Heckman selection model—two-step estimates (regression model with sample selection) was employed to determine the factors affecting organic and inorganic fertilizer adoption. Due to endogeneity, three-stage least-squares (3SLS) regression was subsequently used to assess the causal interaction between organic and inorganic fertilizer application, and vegetable productivity.
Heckman selection model
To determine the use of fertilizer for vegetable cultivation, we assume that producers make binary decisions, whether to apply, or not to apply organic and inorganic fertilizers, depending on their characteristics. This decision is made by comparing the expected utility from fertilizer application $( {U_i^A } ) , \;$ and the expected utility from not applying fertilizer $( {U_i^N } )$
 . A vegetable producer decides to apply organic or inorganic fertilizer if:

where $FA_i^\ast$ denotes fertilizer application. Equation (1) infers that producers use fertilizer for vegetable cultivation if the utility difference is greater than zero (positive); that is if the utility she/he derives from fertilizer application is greater than the utility derived from not applying. Nevertheless, $FA_i^\ast$
 cannot be directly observed as it is a latent variable. Rather, the actual decision by a vegetable producer to apply organic or inorganic fertilizer is what can be observed. Hence, this is specified as a function of observable producer characteristics as follows:

where FA i is a binary variable; and FA i = 1 if a vegetable producer applied organic or inorganic fertilizer, and FA i = 0 if otherwise. Z is a vector of producer characteristics postulated to affect vegetable producers' decision (see Table 1). δ is a vector of parameters that capture the direct influence of exogenous observable characteristics in Z, and they are coefficients to be estimated. ɛi is the error term, with zero mean and variance, δ 2. Not all vegetable producers apply organic or inorganic fertilizers leading to sample selection bias. We addressed this problem by estimating the Heckman selection model (Heckman, Reference Heckman1979). Heckman selection model involves two stages: (1) the decision to apply organic or inorganic fertilizer, (2) the quantity of fertilizer applied per acre. The first stage (selection equation) is:

where $FA_i^\ast$ is an unobserved latent variable representing a vegetable producer's decision to apply organic or inorganic fertilizer; X i represents the predictor variables (Table 1); X i represents parameters to be estimated, and ɛi represents the error term. The observed binary variable is given in Equation (2). The second stage (substantive equation) is:

where λi is an inverse Mills ratio (IMR) used as an additional predictor variable to correct for self-selection bias in Equation (2) (Greene, Reference Greene2012). δ i is the coefficient of the IMR.
Variables in the Heckman selection model (two-step estimates) and 3SLS regression

Note: n.a. denotes not applicable. GHȻ (Ghana cedis) is the currency of Ghana, US$1 = GHȻ5.77.
3SLS regression model
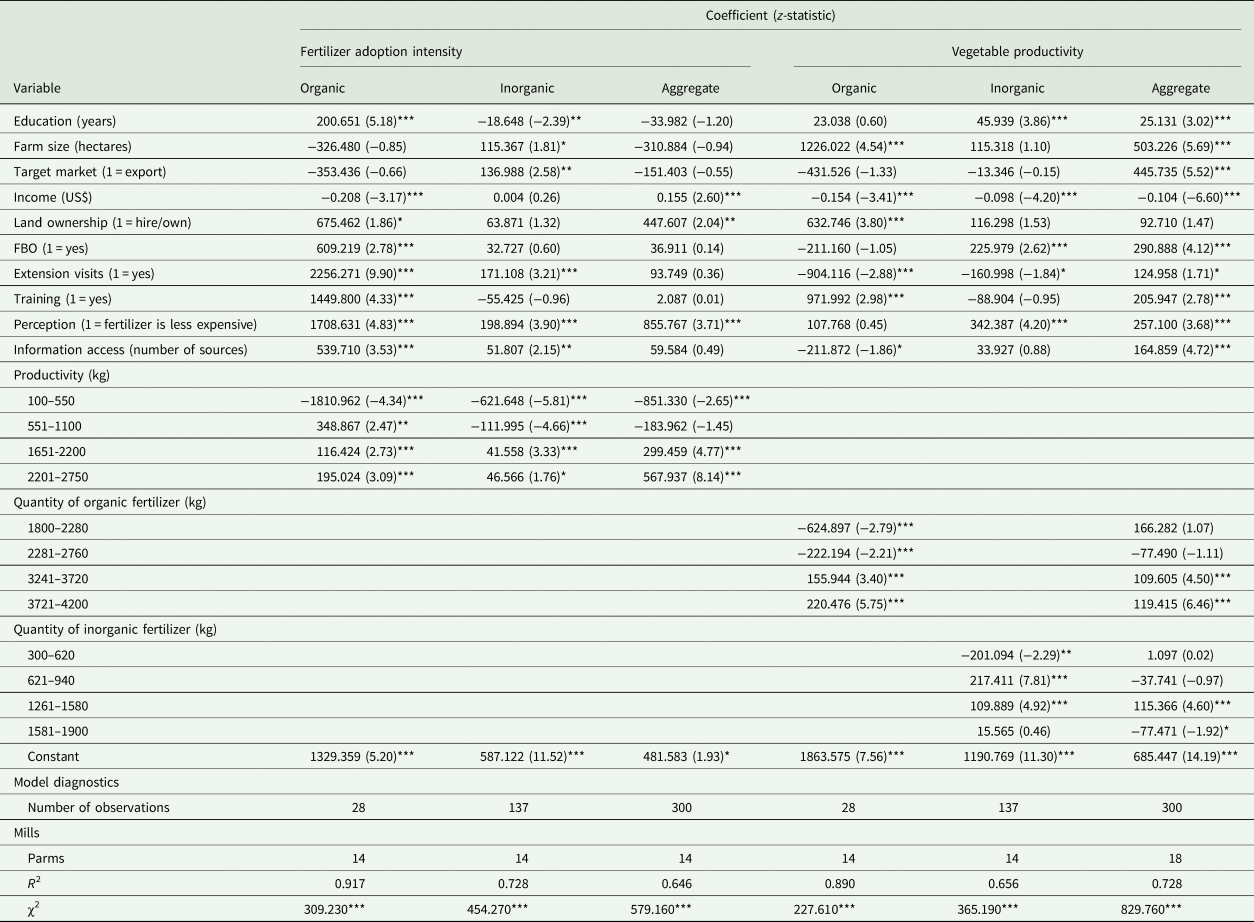
The potential influence of fertilizer application and productivity on each other leads to endogeneity/simultaneity. We applied the 3SLS regression to simultaneously determine the influence of organic and inorganic fertilizer application on vegetable productivity, and that of vegetable productivity on organic and inorganic fertilizer application. Following StataCorp (2015); Greene (Reference Greene2012), the 3SLS is given as:


where y is the outcome variables (y 1 is the quantity of organic or inorganic fertilizer applied per acre, and y 2 is vegetable productivity); Z is the endogenous and exogenous predictor variables; β represents parameters to be estimated, and Ò is the error term. The error terms of the two equations are correlated so that:

where the error terms are further assumed to have an expected value of 0; E(Ò) = 0. 3SLS estimates equations where some of the predictor variables are endogenous. The endogenous predictor variables are outcome variables from other equation(s). This makes the outcome variables endogenous, and correlate with the error terms in the equations. The remaining variables are exogenous, and uncorrelated with the error terms (Greene, Reference Greene2012).
To thoroughly investigate the causal interaction between fertilizer application and productivity, vegetable productivity and quantities of organic and inorganic fertilizers applied per acre were grouped into five categorical variables each and used as predictor variables in the 3SLS estimation. To avoid collinearity, the median category (category 3) for each was excluded. The field survey revealed that productivity of vegetable producers ranged from 100 to 2750 kilograms (kg), and the five categorical variables created are 100–550, 551–1100, 1101–1650, 1651–2200 and 2201–2750. Also, the quantity of organic fertilizer applied per acre ranged from 1800 to 4200 kg; and the five categorical variables created are 1800–2280, 2281–2760, 2761–3240, 3241–3720 and 3721–4200. Furthermore, that of inorganic fertilizer ranged from 300 to 1900 kg; and the five categorical variables are 300–620, 621–940, 941–1260, 1261–1580 and 1581–1900. Hence, quantities of organic and inorganic fertilizers applied per acre, and vegetable productivity served as the endogenous variables, and the remaining variables (in Table 1) were exogenous. Nevertheless, the study did not list the type of organic and inorganic fertilizers, and their chemical composition/contribution, though these would obviously vary, and affect the quantity applied per unit area. The selection of predictor variables was based on observations from the field survey, and existing literature.
Results and discussion
First, descriptive statistics of the variables are briefly discussed. Second, the proportion of vegetable producers who apply organic and inorganic fertilizers are reported. Third, we illustrate the differences in vegetable productivity among producers who applied organic and inorganic fertilizers. Fourth, we establish the causal interaction between the application of organic and inorganic fertilizers and vegetable productivity. Lastly, empirical estimations from the Heckman and 3SLS regressions are discussed.
Descriptive statistics
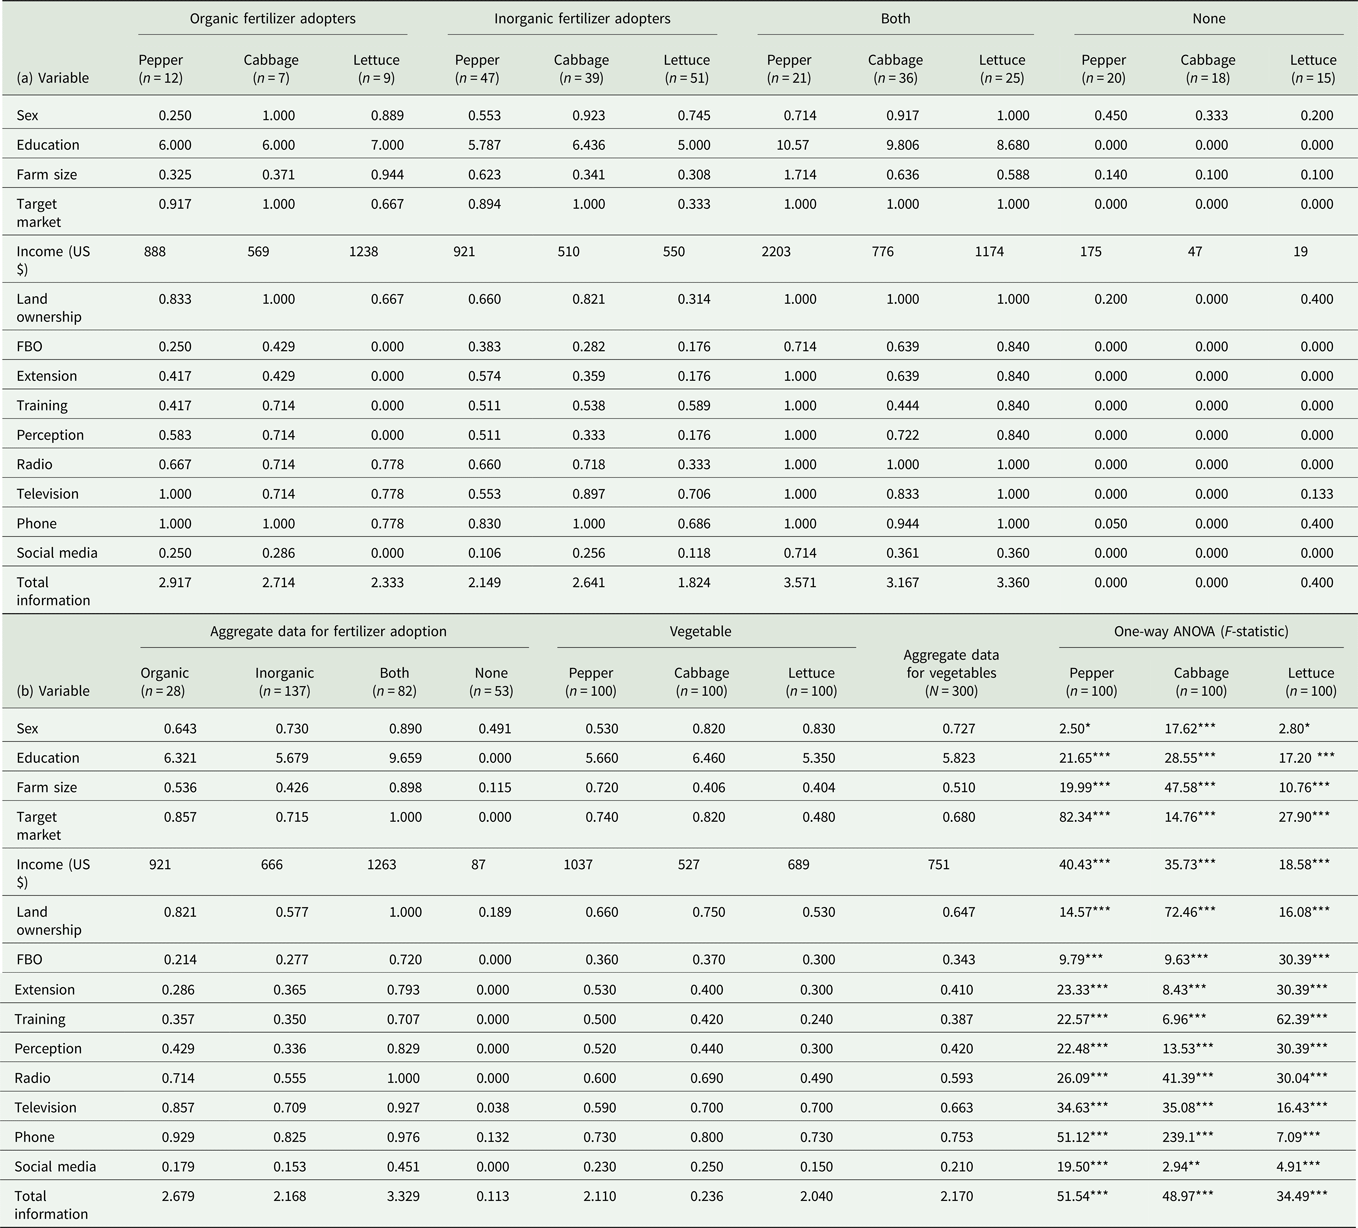
Tables 2a and 2b encapsulate the characteristics of vegetable producers. Table 2a shows that more male producers applied organic and inorganic fertilizers, or both than females in each of the three vegetables, except organic pepper producers. Years of formal education for producers who applied organic and inorganic fertilizers were the same (6 years). For lettuce, organic producers had higher years of formal education than conventional producers. Producers of the three vegetables who applied both organic and inorganic fertilizers had higher years of formal education than those who applied only organic or inorganic fertilizers. Inorganic pepper producers had bigger farms than organic producers, but organic cabbage and lettuce producers had bigger farms than inorganic producers. However, pepper and cabbage producers who applied both fertilizers had bigger farms than those who applied either; but organic lettuce producers had bigger farms than their other counterparts. In all the three vegetables, producers who applied neither had the smallest farms.
Vegetable producers' characteristics.

Note: n is the number of observations.
Note: n is the number of observations. *, ** and *** denote statistical significance at 10, 5 and 1% respectively. The one-way ANOVA (F-statistics) illustrates the statistical differences among each of the three vegetable producers who applied organic or inorganic fertilizers, both or none.
About 90% of organic and inorganic pepper farmers produce for export. All organic and inorganic cabbage farmers produce for export. More organic lettuce farmers produce for export than inorganic lettuce farmers. All vegetable producers who apply both fertilizers target the international market. Inorganic pepper producers had a higher income than organic producers. In contrast, organic cabbage and lettuce producers recorded a higher income than inorganic producers. However, pepper and cabbage producers who applied both organic and inorganic fertilizers recorded higher income than those who applied either, but organic lettuce producers had a higher income than their other counterparts. In all the three vegetables, producers who applied neither of the two fertilizers recorded the lowest income. For all the three vegetables, there were more organic producers who farmed on hired or purchased (own) lands than inorganic producers. More inorganic pepper and lettuce producers belonged to Farmer Based Organizations (FBOs), had extension contacts, and benefited from vegetable production training than organic producers. However, the reverse is true for cabbage producers. No organic lettuce producer belonged to an FBO, had extension contact, or benefited from the training.
The proportions of organic pepper and cabbage producers who had the perception that fertilizer is less expensive compared with its influence on yield and profit were more than inorganic producers who thought the same. However, a greater proportion of inorganic lettuce producers thought otherwise. Ownership/access to agricultural information—radio, television, mobile phone and social media (Facebook and/or WhatsApp)—varied among organic and inorganic pepper, cabbage and lettuce producers. Organic producers had greater access to information than inorganic producers. Producers who applied both fertilizers owned many information sources than those who applied either organic or inorganic fertilizers. It is clear from Table 2a that all pepper, cabbage and lettuce producers who applied neither organic nor inorganic fertilizers were illiterates, produced for domestic markets, did not belong to FBOs, had no extension contacts, had no training, and perceived fertilizer as expensive compared with its influence on profit. Also, all of them did not own radio, television (except 13% of lettuce producers), and were not on social media.
Furthermore, Table 2b shows producers' characteristics aggregated for those who applied organic and inorganic fertilizers, both or none, as well as for the three vegetable producers and the entire sample. Majority of organic or inorganic fertilizer adopters were males. In Ghana, male farmers are more resourceful than female farmers, which enables the former to incur the cost of fertilizer than the latter. Also, men are mostly household heads. This makes them benefit from government fertilizer subsidy programs than women. As household heads, men mostly engage in commercial production, which requires fertilizer application than women. Vegetable farmers who applied organic or inorganic fertilizers had about 6 years of formal education, and all those who applied none had no formal education. Organic producers had larger farms than inorganic producers. Also, producers who applied organic or inorganic fertilizers had larger farms than those who applied none. Many organic vegetable farmers produce for export than inorganic farmers. All farmers who do not apply fertilizer produce for the local market, and all those who apply both produce for export. This means that vegetable producers who are export-oriented are more inclined to apply fertilizer (organic or inorganic). This could be due to the high vegetable standards and quality demanded on the international market in terms of size (weight), among others. It further highlights the increasing demand for organic vegetables on the international market.
Organic vegetable producers had a higher income than inorganic producers. This could be attributed to the premium price attracted by organic vegetables on the international market and some domestic markets. For instance, Owusu and Anifori (Reference Owusu and Anifori2013) reported that price premium on organic vegetables could be more than 50% higher than the price of conventional vegetables. Those who applied both fertilizers had the highest income among the four categories of fertilizer adopters, while those who apply no fertilizer had the lowest. Fertilizer application translates into greater yields of vegetables; and thus, income for producers. Majority of organic and inorganic producers cultivated on hired or their farmlands. Only 19% of producers who did not apply fertilizer cultivated on hired or their farmlands. Producers who are business-minded usually hire or purchase farmlands for production instead of using family lands. Such business-minded producers usually apply fertilizers to boost yield/productivity. The proportions of organic and inorganic vegetable producers who belonged to FBOs, had extension contacts, and benefited from agricultural training programs did not differ substantially between organic and inorganic producers (less than 40% each). However, none of the producers who did not apply fertilizer belonged to FBOs, had extension contacts or benefited from training programs. This highlights the relevance of these three factors in fertilizer adoption.
Less than half of organic and inorganic vegetable producers perceived fertilizer as less expensive compared with its influence on yield/profit (Table 2b). This could be farmers who benefitted from fertilizer subsidy. However, all those who did not apply fertilizer thought otherwise. Perceiving fertilizer as expensive is likely to deter producers from applying fertilizers. Greater proportions of organic vegetable producers owned radio, television, mobile phones, and were on social media than inorganic producers. Vegetable producers who applied organic and inorganic fertilizers owned and accessed agricultural information from three and two sources, respectively. In all the variables discussed above, producers who applied both fertilizers recorded the highest percentages among the four categories of adopters, and those who applied neither had the lowest. Also, organic producers recorded higher percentages in all the variables than inorganic producers, except FBO membership and extension contacts.
The third column in Table 2b illustrates the characteristics of pepper, cabbage and lettuce producers; and the fourth column shows the aggregates. Majority of vegetable producers were males. This agrees with Boateng et al. (Reference Boateng, Amfo, Abubakari and Yeboah2016); Mohammed (Reference Mohammed2011) who reported that men are mostly engaged in vegetable production, while women are mostly engaged in vegetable marketing. The mean number of years in formal education was about 6 years. Farm size of vegetable producers was about half an acre. Close to 70% of vegetable farmers produce for export. Pepper producers recorded the highest average income, and cabbage producers had the lowest. About 65% of vegetable producers cultivate on hired or their farmlands. Less than half belonged to FBOs, had extension contacts, and benefited from agricultural training. About 40% had the perception that fertilizer is less expensive. Vegetable producers owned two sources of agricultural information.
The last column in Table 2b illustrates one-way analysis of variance (ANOVA) used to obtain F-statistics for testing the statistical differences among pepper, cabbage and lettuce producers who applied organic and inorganic fertilizers, both or none. The test indicated that there are statistically significant differences in all the variables among pepper, cabbage and lettuce producers who applied organic and inorganic fertilizers, both or none.
Organic and inorganic fertilizer application for vegetable production
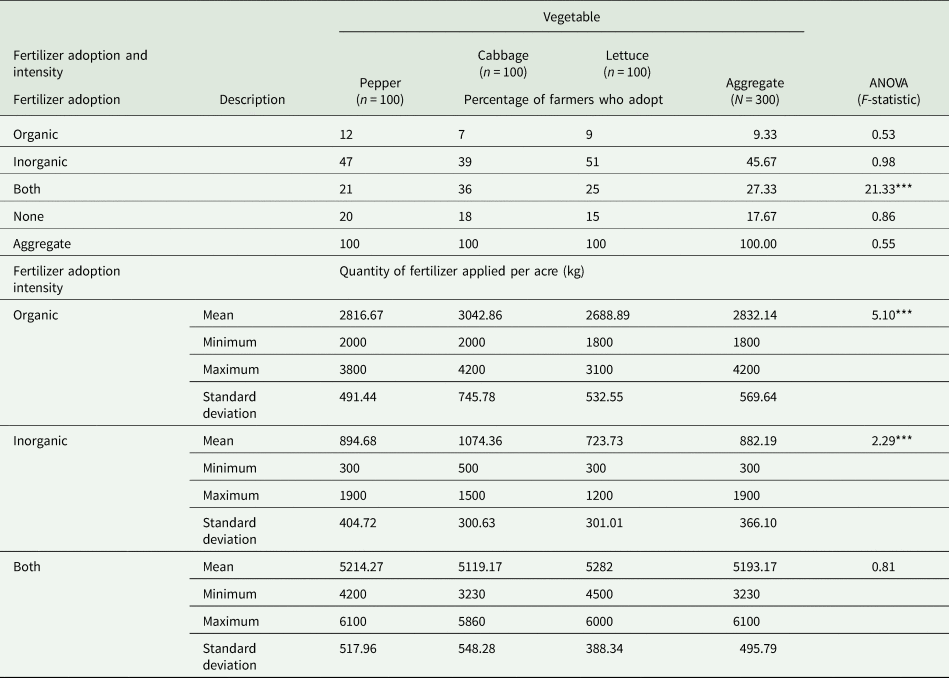
The F-statistic in Table 3 reveals that except farmers who applied both fertilizers, the differences in the proportions of vegetable producers who applied organic or inorganic fertilizers, as well as neither are not statistically significant across the three vegetable producers. In all, the differences in the proportions of the four categories of fertilizers (farmers who applied organic, inorganic, both, none) for pepper, cabbage and lettuce producers are not statistically significant. This suggests that the share of pepper, cabbage and lettuce producers who belonged to the four categories of fertilizer adoption did not vary considerably.
Adoption of organic and inorganic fertilizers for vegetable production

Note: n is the number of observations. *** denotes statistical significance at 1%.
About 10% of vegetable producers applied only organic fertilizers, with pepper producers recording the highest proportion. The commonest organic fertilizers used for vegetable production in Ghana are farmyard manure (FYM), animal droppings and compost. Usually, farmers who keep livestock obtain FYM and animal droppings from their pens and kraals, and those who do not keep livestock buy from other farmers. Some farmers also purchase organic fertilizers from fertilizer companies (shops). The use of organic fertilizers in crop production is highly recommended by environmental activists as a means of enhancing soil fertility with no negative environmental externalities (Avane et al., Reference Avane, Amfo, Aidoo and Osei Mensah2021). The major reasons for the low level of organic fertilizer application could be attributed to constraints like extra labor required and unavailability of organic fertilizers (Paneerselvam et al., Reference Paneerselvam, Halberg, Vaarst and Hermansen2012; Khoy et al., Reference Khoy, Nanseki and Chomei2017; Oyedele et al., Reference Oyedele, Wole-Alo, Owolabi and Okunlola2018); high costs of organic fertilizers (Pandey and Singh, Reference Pandey and Singh2012; Jayanthi and Vaideki, Reference Jayanthi and Vaideki2015); offensive odor and unhygienic nature of certain organic fertilizers (Mugivhisa et al., Reference Mugivhisa, Olowoyo and Mzimba2017). Some farmers also perceive organic fertilizers to give low yield compared with inorganic fertilizers (Paneerselvam et al., Reference Paneerselvam, Halberg, Vaarst and Hermansen2012) which could be a barrier to organic production. However, the premium price offered for organic vegetables could be an incentive for the few who used only organic fertilizers for growing vegetables.
Also, 45% applied only inorganic fertilizers in the production of vegetables, which constituted more than half of lettuce producers and less than half of pepper and cabbage producers. Nitrogen, phosphorus and potassium—NPK (15-15-15)—is the commonest inorganic fertilizer used for vegetable cultivation. There is a high availability of inorganic fertilizers, and less labor required for its application. Unlike organic fertilizers, inorganic fertilizers are readily available and release nutrients quickly for plant use. This could contribute to the high rate of inorganic fertilizer application. Moreover, a little less than 30% of vegetable producers applied both organic and inorganic fertilizers, with cabbage producers recording the highest share. Comparably, Boateng (Reference Boateng2018) reported that 39% of farmers use both natural and synthetic fertilizers for vegetable cultivation. However, close to 20% did not apply fertilizer for vegetable production. This could be producers hindered with financial constraints, and those who cultivated vegetables on fertile (virgin or fallowed) farmlands that did not require fertilizers for vegetable growth.
Table 3 further illustrates the intensity of fertilizer adoption (quantity applied per acre). The F-statistic reveals that differences in the quantities of organic fertilizers applied per acre across the three vegetables are statistically significant. Similarly, the differences in the quantities of inorganic fertilizers are statistically significant across the three vegetables. However, that of producers who applied both fertilizers is not statistically significant. The quantity of organic fertilizers applied per acre by organic vegetable producers ranged from 1800 to 4200 kg, with an average of about 2830 kg. Inorganic vegetable producers applied inorganic fertilizers ranging from 300 to 1900 kg per acre, with a mean of about 880 kg. For vegetable producers who applied both fertilizers, the quantity per acre ranged from 3230 to 6100, with an average of about 5190 kg. Among the three vegetables, cabbage producers applied the highest quantity of organic and inorganic fertilizers per acre. Vegetable producers who adopted both fertilizers applied far higher quantities than those who adopted only organic or inorganic.
Vegetable producers applied different quantities of organic and inorganic fertilizers per acre (Table 3). This disparity could be attributed to variations in nitrogen contents of organic and inorganic fertilizers. For instance, NPK (15-15-15) contains 15% nitrogen. Nevertheless, organic fertilizers like FYM, compost and poultry manure contain 1–4% nitrogen. These infer that compared with organic fertilizers, lower quantities of inorganic fertilizers are required to meet the nutrient requirements of crops, including vegetables (Amanullah et al., Reference Amanullah, Sekar and Muthukrishnan2010; Gao et al., Reference Gao, Liang, Yu, Li and Yang2010). IFOAM (2008) asserted that unlike inorganic fertilizers, organic fertilizers contain insufficient quantities of primary nutrients (NPK); and therefore, large quantities are required for crop growth. This result is consistent with Boateng (Reference Boateng2018) who found that organic vegetable farmers used 2610.63 kg per acre of organic manure compared with 561.75 kg per acre for inorganic vegetable farmers.
Impacts of organic and inorganic fertilizer application on vegetable productivity
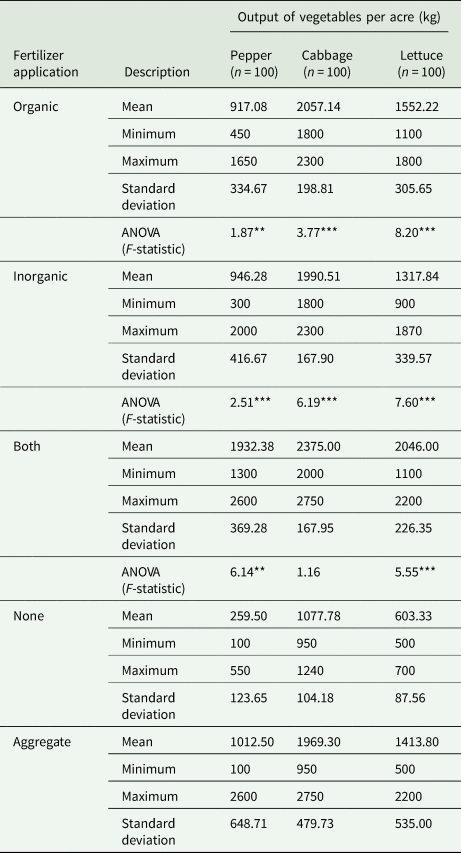
The differences in the productivity of vegetable producers who applied organic and inorganic fertilizers are illustrated in Tables 4 and 5 and Appendices Figs A1–A3. Table 4 encapsulates the productivities of vegetable producers who applied organic and inorganic fertilizers, both or none. The F-statistic reveals that the mean differences in the productivities of pepper, cabbage, and lettuce producers who applied organic fertilizers and those who did not are statistically significant. Also, the mean differences in productivities among producers who applied inorganic fertilizers and those who did not are statistically significant for all the three vegetables. That of producers who applied both organic and inorganic fertilizers is significant for pepper and lettuce. These infer that productivities of producers who applied either organic or inorganic fertilizers and those who did not apply fertilizer varied substantially.
Productivity of vegetable producers in Ghana.

Note: n is the number of observations. ** and *** denote statistical significance at 5, and 1%, respectively.
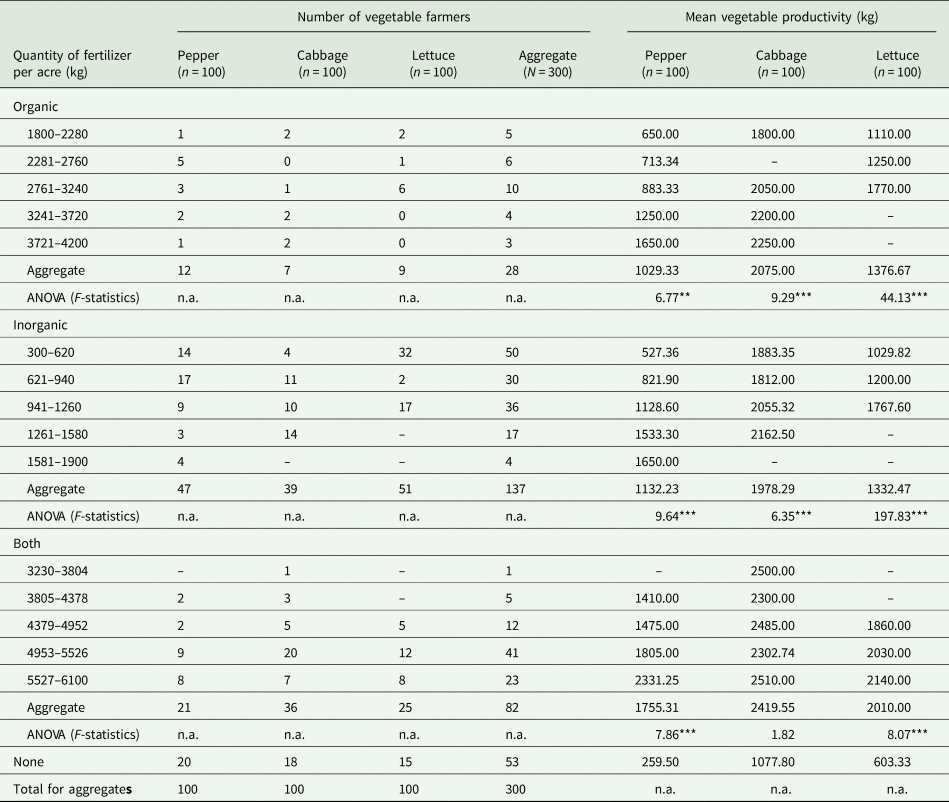
Mean comparison of fertilizer quantities per acre and vegetable productivity

Note: n is the number of observations. ** and *** denote statistical significance at 5 and 1% respectively.
From Table 4, the average productivity of inorganic pepper producers is higher than that of organic pepper producers. However, organic cabbage producers recorded higher productivity than inorganic cabbage producers. Likewise, organic lettuce producers recorded higher productivity than inorganic lettuce producers. In all the three vegetables, producers who applied both fertilizers recorded the highest productivity among the four categories of fertilizer adopters, while those who applied none recorded the lowest. These results suggest that differences in productivities of organic and inorganic pepper, cabbage and lettuce production depend on the type of vegetable. However, vegetable producers who applied either organic or inorganic fertilizers or both recorded higher productivity than those who did not apply fertilizer. This highlights the substantial contribution of fertilizer to vegetable productivity. The aggregate result in Table 4 reveals that the average pepper yield per acre, whether a producer applied fertilizer or not, is 1013 kg, that of cabbage is 1969 kg and lettuce is 1414 kg. The average productivity of organic and inorganic vegetable producers reported in this study are higher for all the three vegetables (except organic pepper) than those reported by Boateng (Reference Boateng2018). Boateng (Reference Boateng2018) found that organic pepper and lettuce growers recorded higher outputs than inorganic growers, but inorganic cabbage growers had higher outputs than organic growers. Martey (Reference Martey2018) noted that the use of organic fertilizer increases productivity by 1.43%.
Furthermore, Table 5 compares the productivity of vegetable producers based on the quantities of organic and inorganic fertilizers applied per acre. The F-statistics suggests that the differences in productivity each of pepper, cabbage and lettuce producers are statistically significant across the various quantities of organic and inorganic fertilizers applied per acre. The same can be said about those who applied both fertilizers for pepper and lettuce producers. The amounts of fertilizer applied per acre were categorized into five (equal ranges), based on the minimum−maximum continuum for each. The share of pepper, cabbage and lettuce growers who belonged to each category varied. Clearly, the results in Table 5 show an increasing trend in vegetable productivity as the quantities of organic or inorganic fertilizers applied increases. This increasing pattern in vegetable productivity also applies to producers who applied both fertilizers for pepper and lettuce production. However, that of cabbage is unclear. Sheahan et al. (Reference Sheahan, Black and Jayne2013) found that fertilizer use intensity increases yield.
The actual quantities of fertilizers applied per acre (without categorization) were used to plot line graphs with productivity for each of the three vegetables (Appendices Figs A1–A3). The graphs reveal that productivity increases with the amounts of organic and inorganic fertilizers applied but in a zig-zag manner. For pepper, productivity increases with organic and inorganic quantities (Appendix Fig. A1). However, productivity drops marginally when the quantity of both organic and inorganic fertilizers increase to a certain level. This consistent with the study of Zhao et al. (Reference Zhao, Li and Jiang2019) who observed that the effect on nitrogen fertilizer on yield growth decrease when application rate exceeds 302 kg N ha−1. For cabbage, productivity increases with the quantity of organic fertilizer applied (Appendix Fig. A2). However, productivity growth is generally zig-zag and unclear in the case of inorganic and both, in which productivity seems slightly stable despite an increase in quantities of inorganic fertilizers or both organic and inorganic. For lettuce, productivity increases with the amounts of organic and inorganic fertilizers applied per acre (Appendix Fig. A3). Nevertheless, the pattern of productivity growth for the amount of both organic and inorganic fertilizers applied is unclear.
Empirical estimations from the Heckman and 3SLS regressions
Estimations from the Heckman two-step selection model for the factors influencing the application of organic and inorganic fertilizers are displayed in Table 6. Also, 3SLS estimates for the causal interaction between organic and inorganic fertilizer application, and vegetable productivity is exhibited in Table 7. The estimations were based on the aggregated dataset for pepper, cabbage and lettuce. The first stage of Heckman estimated fertilizer adoption decision, and the second stage estimated adoption intensity. Censored observations in the first stage of the Heckman regression indicate the number of vegetable producers who did not apply organic and inorganic fertilizers. The uncensored observations show otherwise. The z-values for the IMR (Mill's lambda) in the Heckman two-step estimations for organic (0.39), inorganic (−1.350) and the aggregate (−0.19) are not significant, suggesting that there is no sample selection bias in the model. This is consistent with Fredriksson et al. (Reference Fredriksson, Bailey, Davidova, Gorton and Traikova2017) who used Heckman to estimate farmers' decision to participate in output markets as sellers and how much output is sold. The Wald χ2 is statistically significant in the Heckman regression, inferring that the predictor variables jointly explain variations in the adoption of organic and inorganic fertilizers. Similarly, the χ2 is significant in the 3SLS, suggesting that the predictor variables jointly account for variations in the quantities of organic and inorganic fertilizers applied per acre and vegetable productivity. The R 2 in the 3SLS reveals that the predictor variables contribute about 65–92% of variations in the quantities of organic and inorganic fertilizers applied per acre, and vegetable productivity in the organic, inorganic and the aggregate models. This subsection discusses estimates from the Heckman (Table 6) and 3SLS (Table 7) in tandem.
Heckman selection (two-step) estimates for the factors affecting organic and inorganic fertilizer adoption

Note: *, **, and *** denote statistical significance at 10, 5, and 1%, respectively.
3SLS estimate for the causal interaction between organic and inorganic fertilizer application and vegetable productivity

Note: *, ** and *** denote statistical significance at 10%, 5% and 1% respectively.
Education is significant and positive in the first stage of the Heckman estimation for the inorganic and aggregate models (Table 6). This infers that years of formal education directly influence vegetable producers' decision to apply inorganic fertilizers, and both inorganic and organic fertilizers. Also, education is significant in the 3SLS in the fertilizer adoption intensity model for organic and inorganic fertilizers, as well as the vegetable productivity model for inorganic and aggregate (Table 7). Its coefficient is positively signed, except for inorganic in the fertilizer adoption intensity model. This suggests that the quantity of organic fertilizer applied per acre, and the productivity of vegetable producers who apply inorganic fertilizers and both fertilizers increase with years of formal education. However, education reduces the likelihood that vegetable producers would apply higher quantities of inorganic fertilizers. Education increases vegetable farmers' knowledge of the positive and negative implications of organic and inorganic fertilizer application. Knowing the positive implications of fertilizer on productivity, it is plausible that educated producers have a higher probability of applying inorganic fertilizers or combining organic and inorganic fertilizers for vegetable production relative to uneducated producers. However, educated producers are knowledgeable about the environmental and consumer health risks posed by excessive applications of inorganic fertilizers. Therefore, they are more likely to apply higher quantities of organic fertilizers, and lower quantities of inorganic fertilizers. Furthermore, education enhances farmers' knowledge on the recommended fertilizer application rate and other appropriate agronomic practices that maximize vegetable yield. This is expected to increase the productivity of educated vegetable producers than uneducated producers. This result agrees with Chen et al. (Reference Chen, Zeng, Ying and Fan2018); Tura et al. (Reference Tura, Kenea and Kaso2017), Ajewole (Reference Ajewole2010) who reported that years of formal education increases organic fertilizer adoption. However, it contradicts with Abebe and Debebe (Reference Abebe and Debebe2019) who found that being literate has a negative effect on the use of organic fertilizer.
Farm size is statistically significant and positive in the second stage of the Heckman estimation in the organic, inorganic and aggregate models. This means that farm size increases the quantities of organic and inorganic fertilizers applied. Therefore, as farm size increases, the quantity of fertilizer applied per acre increases. In the 3SLS, farm size is significant and positive in the fertilizer adoption intensity model for inorganic and vegetable productivity model for organic and aggregate. This means that the quantity of inorganic fertilizer applied to vegetable farms increases with farm size. Furthermore, the productivities of vegetable growers who apply organic and both fertilizers increase with farm size. Therefore, both estimations revealed that producers with larger vegetable farms are more likely to apply higher amounts of fertilizers and obtain higher output per acre than those with smaller farms. Mostly, large-scale vegetable producers are more resourceful (high income), profit/business-oriented, and enjoy better access to credits compared with small scale producers. These improve large scale producers' financial capacities to undertake the right agronomic practices that enhance vegetable productivity like the application of the recommended quantities of fertilizers. Bello and Suleiman (Reference Bello and Suleiman2016) reported that adoption of fertilizers depends on farm size. Zhou et al. (Reference Zhou, Yang, Mosler and Abbaspour2010) found that fertilizer adoption reduces with farm size.
In the Heckman regression, the target market is significant and positive in the first stage for inorganic, and in the second stage for organic, inorganic and the aggregate models. This suggests that farmers who produce vegetables for export have a higher probability of applying inorganic fertilizers than those who produce for the local market. Also, production for export increases the probability of applying higher quantities of organic and inorganic fertilizers than production for the local market. Similarly, the 3SLS regression shows that the target market is significant and positive in the fertilizer adoption intensity model for inorganic, and the vegetable productivity model for the aggregate. This implies that the production of vegetables for export is directly related to the amounts of inorganic fertilizer applied per acre, and vegetable productivity for producers who apply both organic and inorganic fertilizers. To meet the high standards of the international market like vegetable size, producers had to apply the recommended quantities of organic and/or inorganic fertilizers. Most foreign countries, especially, the European Union, offer premium prices for organic vegetables which could be the reason why export producers apply high quantities of organic fertilizers. Export producers are likely to be more business/profit-minded than those producing for the local market. This increases the likelihood that export vegetable producers would adhere to agronomic practices that boost productivity, including fertilizer application. Amfo and Ali (Reference Amfo and Ali2020) observed that vegetable farmers who produce for export have a higher likelihood of adopting inorganic fertilizers than those who target local market.
Income is significant but negative in the first stage of the Heckman regression for inorganic and the aggregate models, and in the second stage for inorganic (Table 6). This implies that as an income obtained from the sale of vegetable increases, the probability of applying inorganic, and a combination of organic and inorganic fertilizers decline. Also, the quantity of inorganic fertilizer applied per acre declines with income. In Table 7, the 3SLS estimation reveals that income is significant for organic (negative) and the aggregate (positive) in the fertilizer adoption intensity model. It furthers shows that income is significant but negative in the vegetable productivity model for organic, inorganic and the aggregate. These infer that the application of organic fertilizers declines with income, but the combination of organic and inorganic fertilizers increases with income. Also, vegetable productivity declines with income. The adoption of fertilizer and productivity-enhancing agronomic practices involve cost which high-income vegetable producers could better afford than low-income producers. Nevertheless, the negative coefficient of income could be as a result of reliance on vegetable producers on credit facilities. This results in the use of income from the sale of vegetables for servicing credits instead of investing in production activities like purchase of fertilizers and adoption of productivity-enhancing cultural practices. Furthermore, high-income earners could have secondary occupations in which they invest income from the sale of vegetables rather than ploughing back into vegetable production. Bello and Suleiman (Reference Bello and Suleiman2016) found that income/capital contributes to fertilizer adoption.
From Table 6, land ownership is significant and positive in the Heckman for organic in the first stage and inorganic in the second stage. Therefore, producers who cultivate vegetables on hired (sharecropping) or their lands have a higher likelihood of applying organic fertilizers and higher quantities of inorganic fertilizers than those who cultivate on family lands. Similarly, the 3SLS revealed that land ownership is significant for organic and the aggregate in the fertilizer adoption intensity model, and organic in the vegetable productivity model. Therefore, cultivation of vegetables on hired (sharecropping) or individual farmlands increases the likelihood of applying higher quantities of organic fertilizers, or a combination of organic and inorganic fertilizers, as well as the productivity of organic producers compared with cultivation on family farmlands. In Ghana, farmers cultivate crops (vegetables) under the leasehold (hired), sharecropping, family (inheritance) and individual (own farmland) systems of land ownership. Under the sharecropping, leasehold and individual land tenure systems, farmers consider farmlands and vegetable farms as their private farms and assets. Also, business-minded farmers who do not own farmlands usually hire or purchase farmlands, or go into sharecropping. These farmers are highly enthused to undertake cultural practices that maintain soil fertility and improve productivity like organic and inorganic fertilizer application. This enables them to obtain enough output and thus, income from the sale of vegetable to cover the cost incurred in purchasing or hiring farmlands. However, farmers cultivating on family farmlands often consider such farmlands (and sometimes, the crops) as a family asset. This reduces their enthusiasm to bear the cost of improving such farmlands through fertilizer application.
FBO membership is significant and positive in the first stage of the Heckman regression for organic, inorganic and the aggregate and in the second stage for inorganic. This implies that FBO membership directly influences producers' decision to use organic and/or inorganic fertilizers for vegetable cultivation, as well as the quantity of inorganic fertilizers applied per acre. Likewise, the 3SLS indicates that FBO membership is significant in the fertilizer adoption intensity model for organic, as well as the vegetable productivity model for inorganic and the aggregate. This means that FBO membership directly affects the quantity of organic fertilizer applied per acre, and the productivity of vegetable producers who applied inorganic and a combination of organic and inorganic fertilizers. The forgoing infer that vegetable producers who belong to FBOs are likely to apply organic and/or inorganic fertilizers (and in higher quantities), and obtain higher productivity than those who do not belong to FBOs. Members of FBOs learn from one another. Also, most financial institutions provide agricultural loans to FBOs rather than individuals. Majority of organizations and extension agents disseminate agricultural information and training to farmers through FBOs. These are expected to boost productivity-enhancing agronomic practices like organic and/or inorganic fertilizer application.
The Heckman regression revealed that extension visits significantly and directly influence the application of inorganic fertilizers, as well as a combination of organic and inorganic fertilizers. It is also significantly and directly related to the adoption intensity of organic fertilizers, and a combination of organic and inorganic fertilizers. Moreover, the 3SLS revealed that extension visits are significantly and directly related to the amounts of organic and inorganic fertilizers applied per acre, as well as the productivity of vegetable producers who combine organic and inorganic fertilizers. Nevertheless, extension visits reduce the productivity of vegetable producers who apply only organic or inorganic fertilizers. Extension agents educate farmers on agronomic practices that boost vegetable productivity like the application of organic and inorganic fertilizers. The finding that extension visits reduce productivity could be because vegetable producers who apply only organic or inorganic fertilizers may not adhere to other productivity-enhancing agronomic practices like a timely weed, pests and diseases control. This result is similar with those of Abebe and Debebe (Reference Abebe and Debebe2019); Ali et al. (Reference Ali, Awuni and Danso-Abbeam2018); Tura et al. (Reference Tura, Kenea and Kaso2017), Gelgo et al. (Reference Gelgo, Mshenga and Zemedu2017); Ajewole (Reference Ajewole2010) who observed that access to extension service has a positive influence on the use of organic fertilizer.
Table 6 reveals that training significantly and positively influences farmers' decision to use organic fertilizers for growing vegetables, but negatively influences farmers' decision to apply inorganic fertilizers. Likewise, the 3SLS in Table 7 reports that training significantly and positively affects the amount of organic fertilizer used for vegetable production, as well as the productivity of farmers who use organic fertilizer, and a combination of organic and inorganic fertilizers for vegetable production. Farm management training is expected to educate farmers on cultural practices that enhance productivity like fertilizer application. It is further expected to educate farmers on the environmental and human health risks associated with certain management practices like the application of inorganic fertilizers. Therefore, vegetable farmers who have received farm management training are likely to apply higher amounts of organic fertilizers, and lower amounts of inorganic fertilizers, and obtain higher productivity. Bello and Suleiman (Reference Bello and Suleiman2016) indicated that social participation is key to fertilizer adoption.
The Heckman regression suggests that producers who perceive fertilizer as less expensive compared with its influence on yield and profit have a higher probability of applying inorganic fertilizers (and in high quantities) or combining organic and inorganic fertilizers for vegetable production. Moreover, the 3SLS suggests that producers who perceive fertilizer as less expensive are more likely to use higher quantities of organic and/or inorganic fertilizers for vegetable production, and consequently, obtain higher productivity than those who think otherwise. These imply that despite its impacts on yield, the cost is a critical factor producer consider in the application of fertilizers. Abebe and Debebe (Reference Abebe and Debebe2019); Chen et al. (Reference Chen, Zeng, Ying and Fan2018) Zhou et al. (Reference Zhou, Yang, Mosler and Abbaspour2010) observed that soil fertility is negatively correlated with fertilizer use intensity.
The Heckman regression indicates that access to agricultural information directly and significantly affects the adoption of organic and inorganic fertilizers for vegetable production. However, it is negative in the first stage for those who combine organic and inorganic fertilizers. Also, the 3SLS indicates that access to agricultural information increases the quantities of organic and inorganic fertilizers used for vegetable cultivation, as well as the productivity of producers who apply both organic and inorganic fertilizers. However, access to information reduces the productivity of producers who use only organic fertilizers for growing vegetables. Producers with greater access to agricultural information are likely to be more knowledgeable about organic and inorganic fertilizers, and other production techniques that boost productivity. This enhances adoption. The negative sign could be because some producers with greater information sources may have other constraints that hinder them from acquiring fertilizers, and adhering to productivity-enhancing agronomic practices. Bello and Suleiman (Reference Bello and Suleiman2016) revealed that adoption of fertilizers depends on the availability of information about fertilizers. Amfo and Ali (Reference Amfo and Ali2020) observed that vegetable farmers who have access to multiple sources of information have higher probabilities of adopting inorganic fertilizers.
The main objective for estimating the 3SLS was to assess the causal interaction between organic and inorganic fertilizer application, and vegetable productivity. Results reported in Table 7 indicate that lower categories of productivity negatively and significantly influence the quantity of organic and/or inorganic fertilizers applied per acre. In contrast, higher productivity positively and significantly influences the quantities of organic and/or inorganic fertilizers applied. On the other hand, lower quantities of organic and inorganic fertilizers applied per acre negatively and significantly related to the productivity of organic and inorganic vegetable producers. In contrast, higher quantities of organic and inorganic fertilizers significantly and directly influence the productivity of organic and inorganic vegetable producers. These results clearly indicate that vegetable productivity rises with the quantity of fertilizer applied. However, the aggregate estimate indicates that as the quantity of inorganic fertilizer increases beyond a certain threshold, vegetable productivity declines. Also, the quantity of fertilizer applied increases with vegetable productivity. The causal association between the quantity of fertilizer used for vegetable production and productivity could be because organic and inorganic fertilizers replenish soil fertility for the proper growth and development of vegetables. Therefore, the right quantity of fertilizer used for production is expected to increase output/yield of vegetables, and subsequently, productivity. On the other hand, higher productivity increases producers' income from the sale of vegetables. Therefore, it is expected that vegetable producers with higher productivity can better bear the cost of acquiring the right quantities of fertilizers for production than those with lower productivity. Zhou et al. (Reference Zhou, Yang, Mosler and Abbaspour2010) reported that gains in crop yield are positively correlated with fertilizer use intensity. Ullah et al. (Reference Ullah, Shah, Ali, Naz, Mahar and Kalhoro2015) found that productivity significantly affects farmers' decision to practice organic farming.
Concluding remarks and policy considerations
There were disproportionately more producers who used only inorganic fertilizers (45%) for pepper, cabbage and lettuce production than those who used only organic fertilizers (10%). A little less than one-third applied both organic and inorganic fertilizers, while close to one-fifth did not apply fertilizer. Vegetable producers applied higher quantities of organic fertilizers (2830 kg) per acre than inorganic fertilizers (880 kg), and producers who combined the two applied the highest quantity (5190 kg). Cabbage producers applied the highest quantity of organic and inorganic fertilizers per acre. Differences in productivities of organic and inorganic pepper, cabbage and lettuce production depend on the type of vegetable. Organic cabbage and lettuce producers recorded higher productivity than inorganic producers, but inorganic pepper producers had higher productivity than organic producers. However, it is clear that vegetable producers who applied either organic or inorganic fertilizers, or both, recorded higher productivity than those who did not apply fertilizer. Also, producers who combined the two fertilizers had the highest productivity among the four categories of fertilizer adopters. To achieve the same level of productivity, vegetable farmers needed to apply larger quantity of organic than inorganic fertilizer.
Factors that enhance the use of organic and inorganic fertilizers for vegetable production are education, farm size, production for export, land ownership (leasehold/hired, sharecropping and individual), farmer group membership, extension visits, perception about fertilizer price and information access. Also, factors that improve vegetable productivity are education, farm size, production for export, land ownership, farmer group membership, training and perception about fertilizer price. However, farm income reduces fertilizer application and vegetable productivity. There is a causal association between the quantity of organic and inorganic fertilizers used for vegetable production and productivity. Fertilizer application boosts vegetable productivity, and productivity enhances fertilizer application.
To enhance the application of organic and inorganic fertilizers, and vegetable productivity, private organizations and government should increase extension staff, subsidize fertilizers and make agricultural information available to producers through radio and television programs. They should also train producers on productivity-enhancing agronomic practices. Producers should join farmer groups, and plough back farm income into vegetable cultivation. Future studies should delve into the cost associated with raising the primary nutrient (nitrogen, phosphorus and potassium—NPK) contents of organic fertilizers, and its impacts on organic fertilizer adoption. For instance, will vegetable producers be willing to pay for organic fertilizers with high nitrogen content? Such studies could compare differences in the adoption rates of organic fertilizers with high and low primary nutrient contents.
Appendix
Mean plot for comparison of fertilizer quantity and vegetable productivity.
Impacts of organic and inorganic fertilizer quantities on pepper productivity.

Impacts of organic and inorganic fertilizer quantities on cabbage productivity.

Impacts of organic and inorganic fertilizer quantities on lettuce productivity.