



The age-adjusted suicide rate decreased in almost all World Health Organization (WHO) countries – except in the USA – by 29% between 2000 and 2019, from 13.0 to 9.2 per 100 000 population.1 In the USA, the rate showed an uninterrupted increase from 10.5 per 100 000 population in 1999 to a peak of 14.2 in 2018, decreased to 13.9 in 2019, 13.5 in 2020 and slightly increased to 14.1 and 14.2 in 2021 and 2022, respectively.Reference Hedegaard, Curtin and Warner2–4 Provisional data for 2023 show 49 359 deaths from suicide, an increase of 7.4% compared to 2020.4
Suicide rates may be sensitive to cohort effects. Timing of birth, age effects and differences in lifetime social and developmental experiences may influence biology, behaviour and relationships, which in turn, may differentially affect suicide rates. For example, some scholars had noted that ‘baby boomers’, those born between 1946 and 1964 and reaching middle age after 2000, had unique sociocultural exposures that have been associated with the highest age-group suicide rates.Reference Mcintosh5,Reference Conwell6 However, this assertion was challenged after exploring age and period effects among birth cohorts. By analysing data from 1935 to 2010, PhillipsReference Phillips7 reported that, after controlling for age and period effects, the trend in suicide rates among different birth cohorts followed a U-shaped pattern, and the lowest rates were found in those born between 1915 and 1945. Starting with the baby boom generation, each subsequent cohort has shown progressively higher rates – evident in both men and women, although most marked among men. A recent interpretation of these temporal findings has been the formulation of ‘deaths of despair’ – self-injury mortality (SIM) inclusive of suicide, overdose fatalities and alcohol-related deaths – associated with measures of social, material and educational deprivation.Reference Phillips7–Reference Mueller-Williams12
Current study
While generational experiences of social and material deprivation can manifest as period and cohort effects in suicide rates, recent research has not fully examined the intertwined roles of gender and race. Most studies either quantify age, period and cohort effects within specific gender and racial/ethnic groups or employ diverse methods to assess the impacts on suicide rates.Reference Wang, Yu, Wang, Bao, Gao and Xiang13–Reference Martinez-Ales, Pamplin, Rutherford, Gimbrone, Kandula and Olfson16 Our study aims to examine trends in age-adjusted suicide mortality in the USA, and to identify age, period and cohort patterns and compare these patterns by gender and race. Of note, considering the potentially complex and still uncertain impact of the COVID-19 pandemic and its aftermath on suicide mortality in the USA, we opted to examine data from 1999 to 2019.
Method
Data source
Final data on the underlying causes of death were obtained for the years 1999–2019 from the Wide-ranging ONline Data for Epidemiologic Research (WONDER) (https://wonder.cdc.gov/). These data were broken down by single-year ages, year, gender and race for causes of suicide (X60–X84, Y87.0), as coded in the ICD-10.17 We did not include data on Hispanic populations, as this category was not coded for the full range of birth years included in the study. We aggregated the data into 3-year intervals for age groups, time periods and cohorts, ranging from 16 to 84 years, to provide detailed cohort- and period-specific trends and to circumvent potential overfitting from using single-year age groupings. Ages under ages 16 years were omitted because of the low suicide rate, with the total number of suicides accounting for only 1.5% of all deaths between 1999 and 2019. In addition, ages 85+ were omitted because the population data for those age groups were not available in WONDER. Institutional review board approval was not necessary for this study, as all data were de-identified and publicly available.
Statistical analysis
Mortality rates for males and females, broken down by single year of age, were smoothed using a first-order kernel density smoother with a Gaussian kernel. The smoothing process was necessary to ensure that the original rate values were not presented in the figures, in accordance with Centers for Disease Control and Prevention (CDC) guidelines. Gender-specific rates for each year were then standardised to a rate per 100 000 population, using the 1999 US population as the standard.
We utilised the US National Cancer Institute’s web-based tool to conduct an age–period–cohort (APC) analysis on raw data, aiming to discern the distinct influences of age, period and birth cohort on suicide mortality.Reference Rosenberg, Check and Anderson18 The APC methodology is a frequently used statistical method for evaluating mortality trends.Reference Su, Zou, Hay, Li, Chen and Naghavi19 In this analysis, age effects refer to the impact of individuals’ chronological progression on suicide mortality. Period effects capture the repercussions of external circumstances affecting the entire populace at particular moments. These can encompass economic downturns, wars, health crises, accessibility to means, media effects and societal shifts. For instance, the opioid crisis that emerged in the early 2000s in the USA has correlated with heightened suicide mortality rates over recent decades.Reference Martínez-Alés, Jiang, Keyes and Gradus20 Cohort effects address the influences arising from experiences or exposures unique to specific generational groups.
The APC tool offers an intuitive platform for this analysis, leveraging generalised linear models and weighted least squares techniques to scrutinise Poisson-distributed population data, effectively pinpointing mortality rate trends. The APC model generated several outputs: (a) age-specific mortality rates over specified age groups; (b) period-specific relative risks, indicating consistent time trends in mortality across all ages and cohorts; (c) cohort relative risks, highlighting variances in mortality rates for those born within specific timeframes; (d) local drift measures the age-specific annual percentage change in mortality rates within a given period or birth cohort; (e) net drift measures the overall average annual change in mortality rates, averaged across all ages and cohorts over time. Specifically, local drift and net drift values above zero indicate increasing trends in mortality rates. The period-specific relative risks were calculated with the 2008–2010 span as a reference. The cohort relative risks were calculated with the 1958–1960 birth cohort as a reference. Further, the model incorporated net drift, signifying the comprehensive annual percentage change in mortality, and local drifts, representing annual percentage shifts within distinct age segments. For statistical validation, the Wald χ2 test gauged the significance of estimable parameters and functions, deeming P-values below 0.05 as statistically significant.
Results
From 1999 to 2019, suicides in the USA between ages 16–84 increased by 62.12% from 28 112 to 45 577, and the age-standardised rate increased by 33.08% from 13.3 in 1999 to 17.7 in 2019 per 100 000 population. Fig. 1(a) demonstrates that during this time, the male age-standardised mortality rates were consistently higher than the female rates, with a notable increase in male rates from 2013 to 2018, followed by a slight decrease for both genders from 2018 to 2019. Fig. 1(b) shows the age-standardised mortality rates for the overall population for every 5 years from 1999 to 2019 – depicting an overall rise in the rates along the age curve, with increasingly evident peaks in younger cohorts over time. We explored the age-standardised mortality rates for females and males for every 5-year interval from 1999 to 2019. Fig. 1(c) shows that the peak of mortality rates for females shifted upward along the age curve over time, from the mid-40s to early 50s, with the highest peak occurring in 2014. Fig. 1(d) shows that, for males below age 60, there was a shift in the mortality pattern downward along the age curve over time, with a substantial rise among the 20s cohorts. In addition, there is a clear and rapid increase in mortality rates among males over age 70.
Directly standardised mortality rates for suicide from 1999 to 2019 (a) and smoothed mortality rates for suicide mortality in the most recent five census years (b)–(d) by gender. Figures were smoothed using a linear kernel density smoother with a Gaussian kernel. Note that this study did not include mortality rates for populations aged 15 years and below or aged 85 years and above.

Age–period–cohort effects by gender
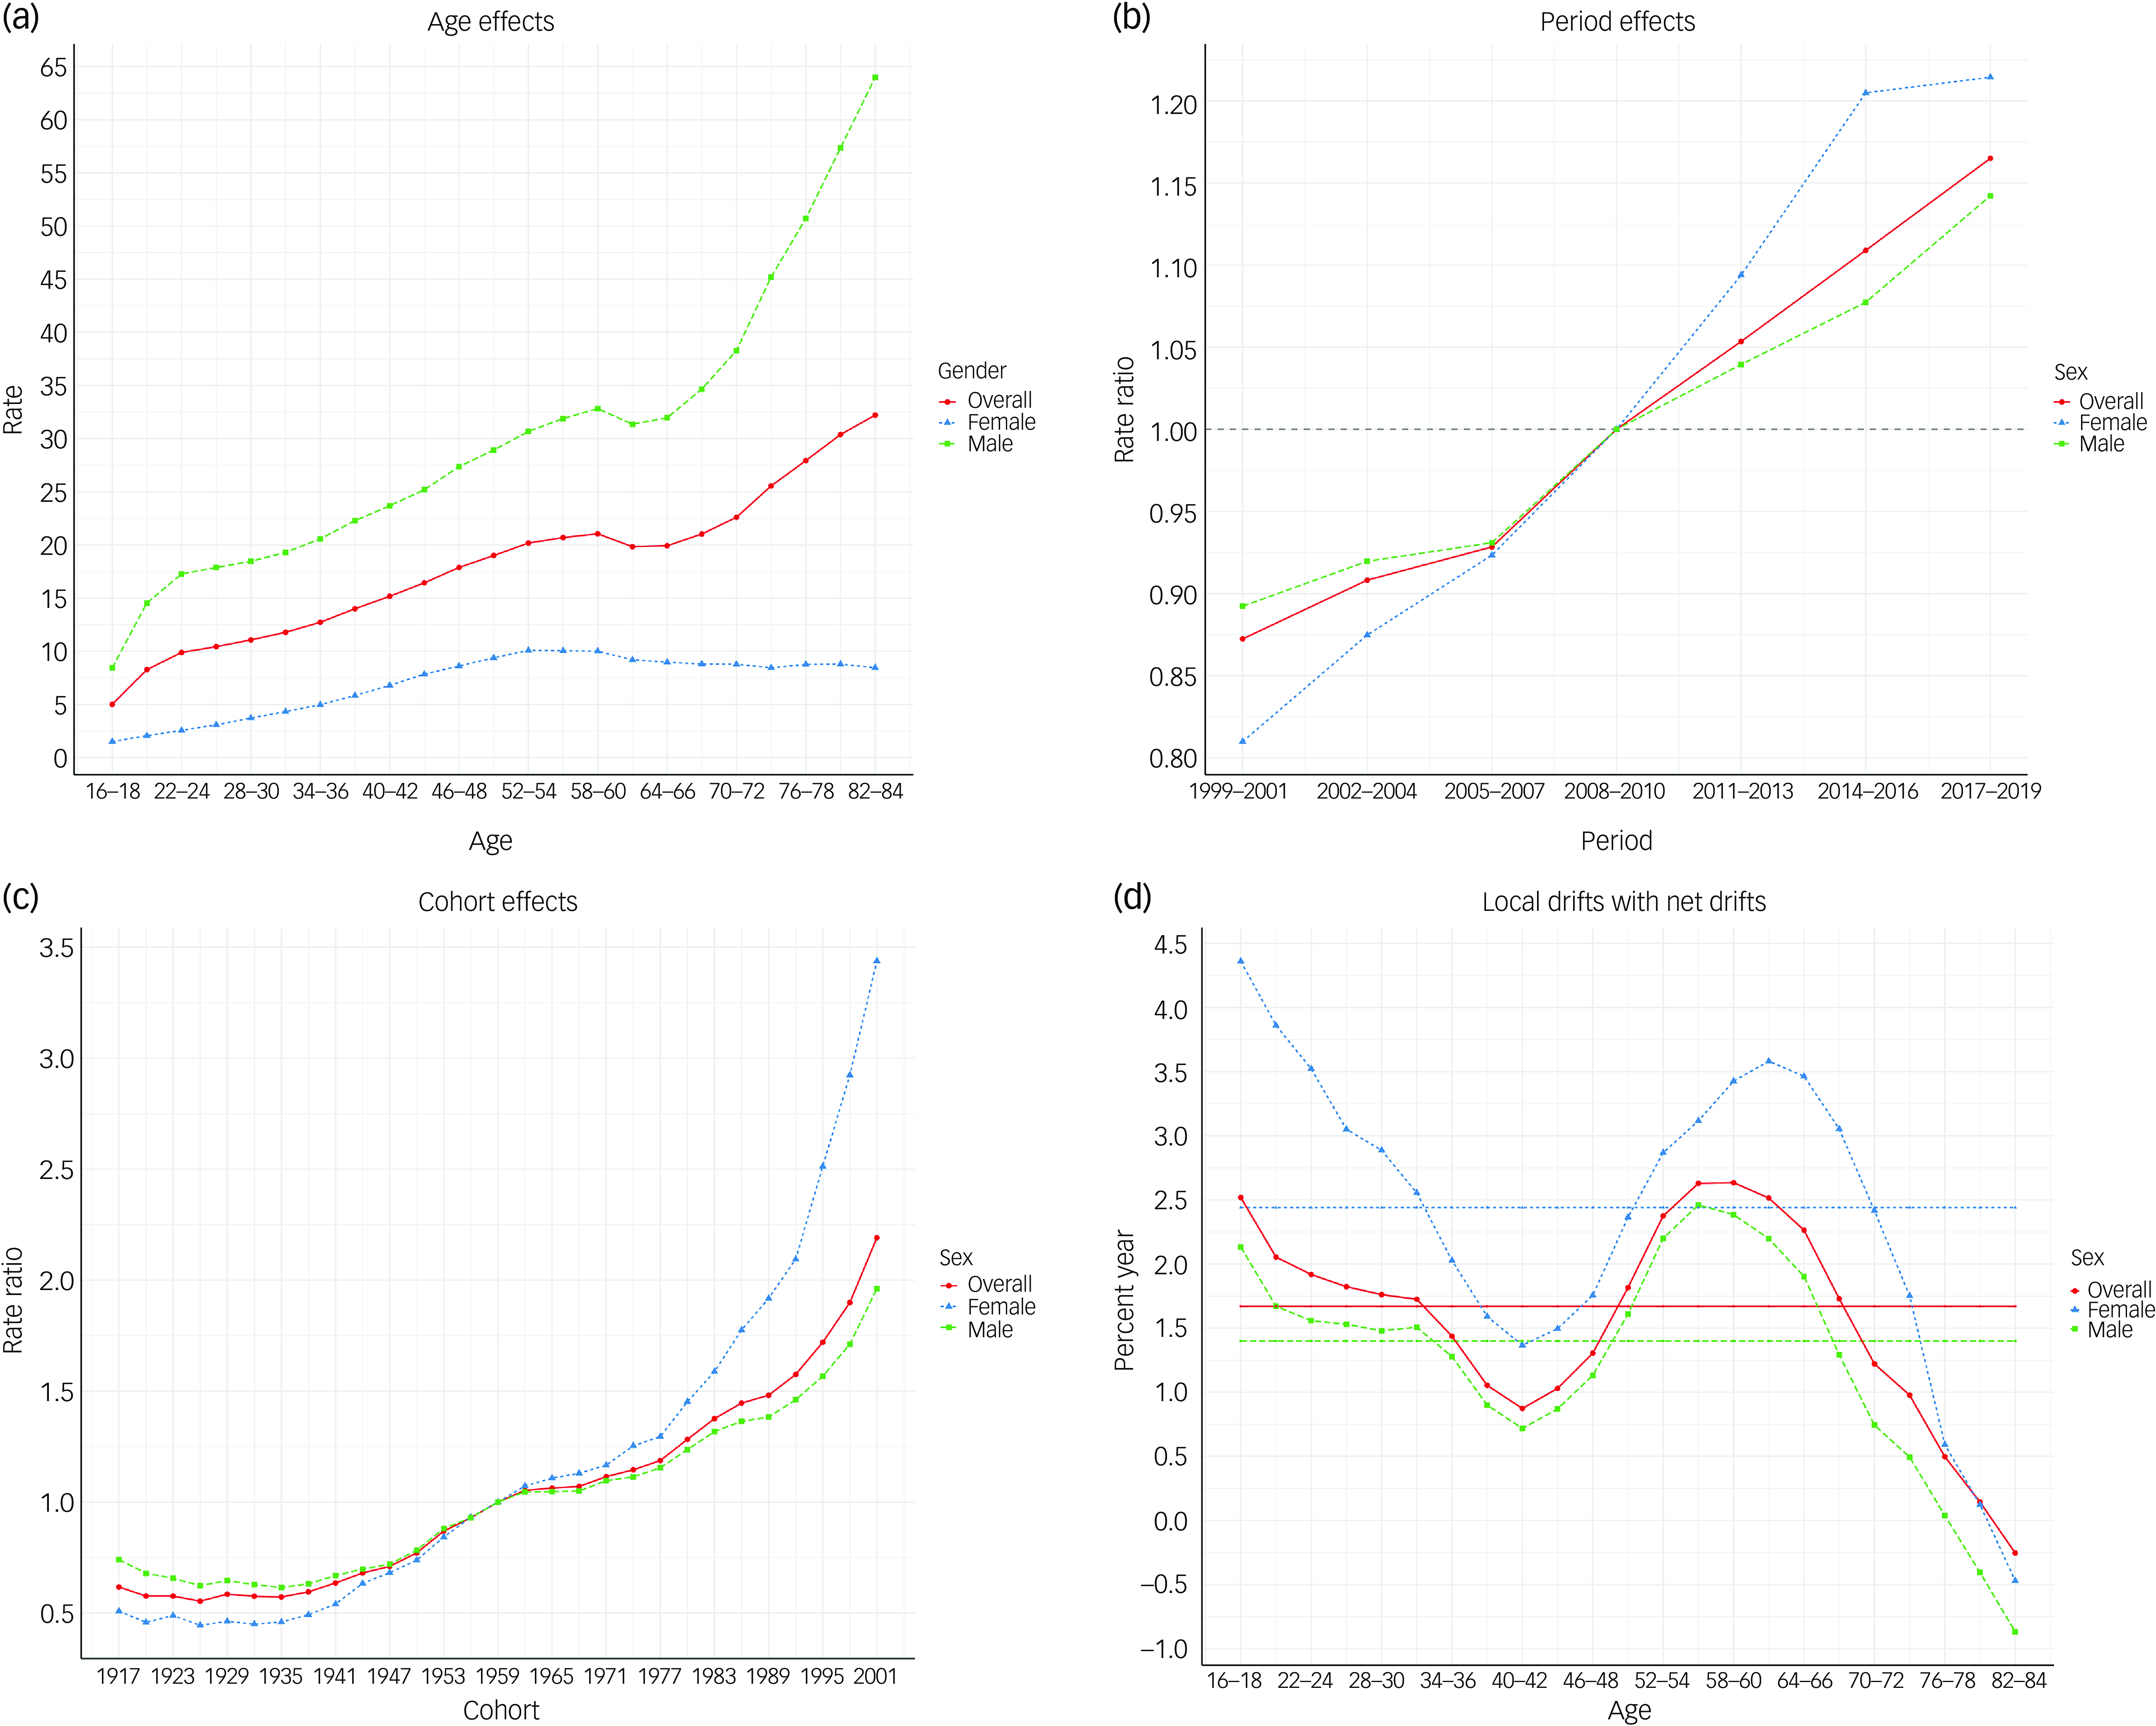
Fig. 2 presents the age, period and cohort effects on gender-specific suicide rates; detailed values are reported in Supplementary Table S1 (supplementary material available at https://doi.org/10.1192/bjp.2025.6). Fig. 2(a) shows that the mortality rates for the overall population increased continuously before age 60, and then decreased slightly between ages 61 and 63, and increased again after age 63. The increase in older population could be attributed to the rapid increase among males aged 64 years and above. Male mortality rates were higher than female rates across all age groups, with male rates increasing before age 60 years, a slightly decreasing between ages 61 and 63, and then increasing sharply. Female mortality rates are hidden in the overall data, heavily outweighed by male rates. In contrast to men, women’s rates gradually increased before age 54 years, were flat until age 60 and then decreased slightly. Fig. 2(b) shows that the period effects increased continuously for both genders and peaked at 2017–2019, with higher relative risk in females post-2010. Fig. 2(c) shows that the mortality risk in cohorts for the overall population before 1977 increased slowly, with a steep increase in those born after 1989, particularly in the 2001 cohort (3.44 in females (95% CI, 3.13–3.78), 1.96 in males (95% CI, 1.76–2.18)); in addition, the post-1959 female cohorts showed greater changes in risk than their male counterparts, with a steep J-shaped pattern in post-1977 cohorts. Fig. 2(d) shows that the net drift was 1.67 (95% CI, 1.57–1.75) in the overall mortality rates from 1999 to 2019, indicating an annual increase of 1.67%. It also shows a notable cosine-shaped local drift distribution by age, in which the rates were higher in ages 58–60 years (2.63 (95% CI 2.39–2.88)) and in 16–18 years (2.52 (95% CI, 2.13–2.91)). Local drift values were above zero for age groups before 76–78 years in females and 79–80 years in males, consistent with increasing trends in suicide mortality. Wald tests indicated statistically significant age, period and cohort effects for the whole population and by gender (Supplementary Table S1). Full results and exact figures are shown in Supplementary Material 2–4.
Suicide mortality by gender in the USA, 1999–2019, by age–period–cohort analysis. (a) Longitudinal age curve of suicide mortality rates (per 100 000 population) in the reference cohort (1959) adjusted for period effects. (b) Period rate ratios for suicide mortality relative to the 2008–2010 period. (c) Cohort rate ratios for suicide mortality (reference group: 1959 birth cohort). (d) Local drift values for suicide mortality rates: age-group-specific annual percent change (%) in suicide mortality rates; 95% confidence intervals are listed in Supplementary Table S1.

Age–period–cohort effects by race
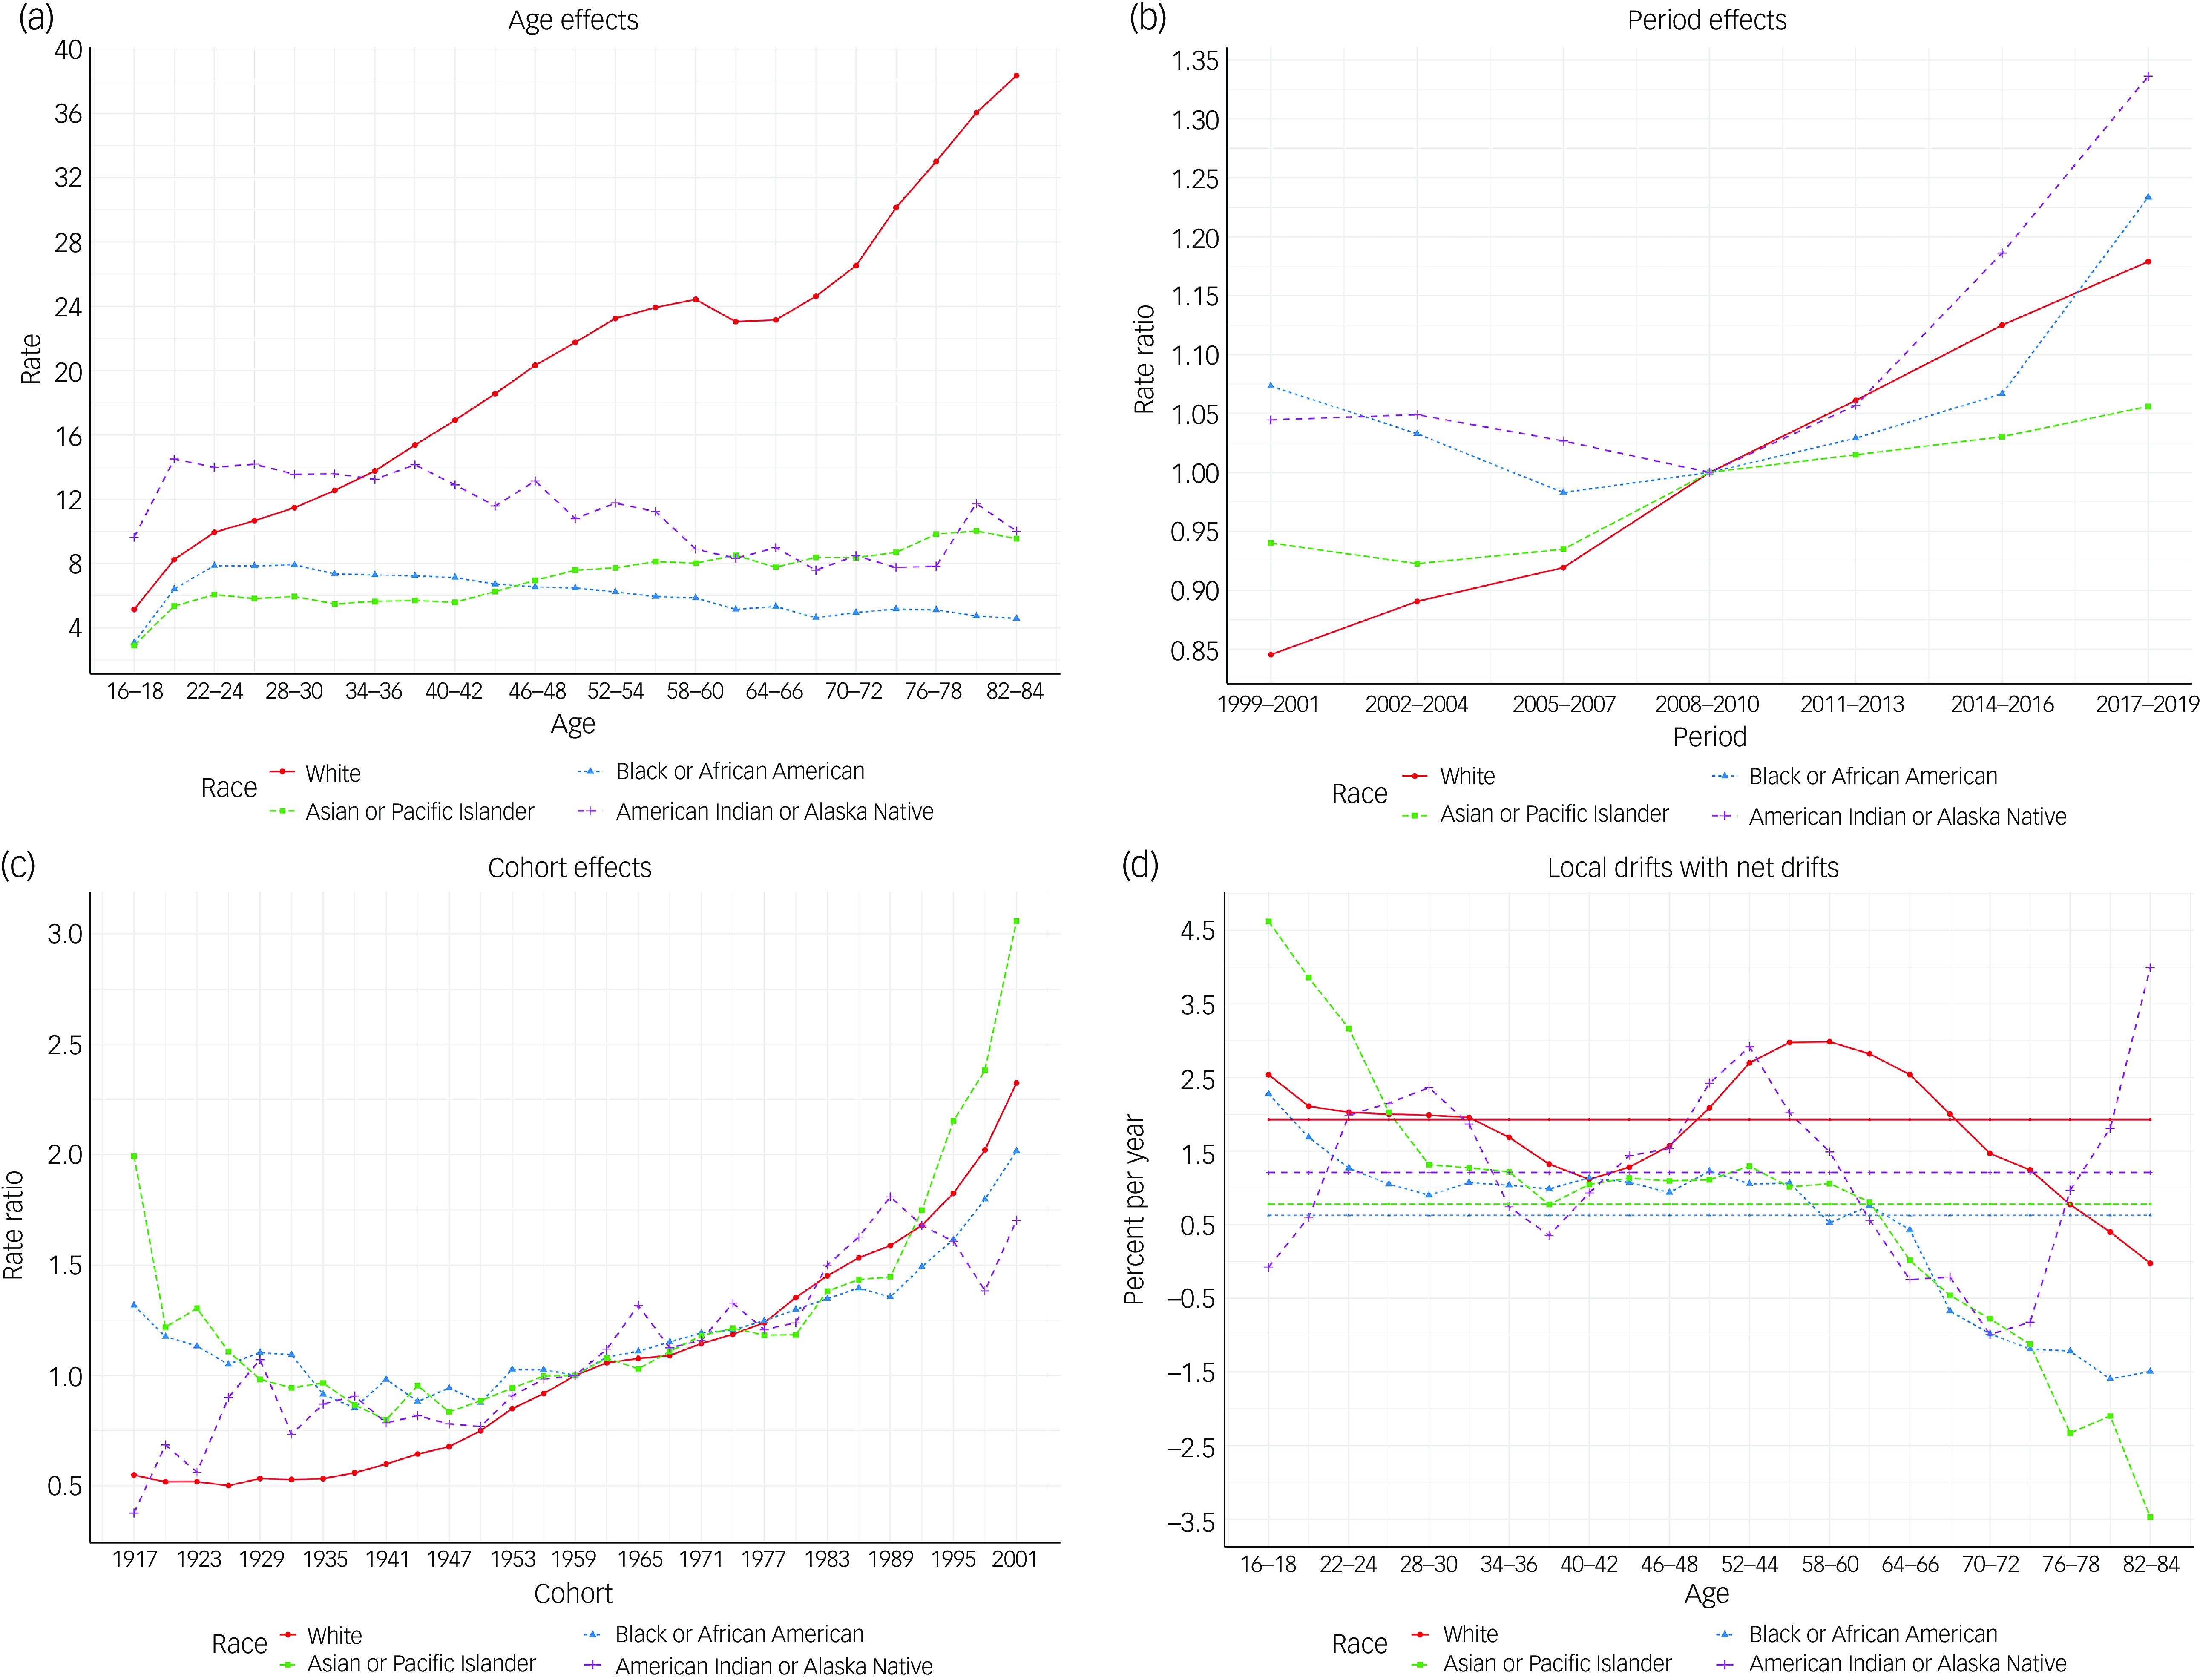
Fig. 3 shows the estimates of age, period and cohort effects on race-specific suicide mortality rates, and detailed values are reported in Supplementary Table S2. Fig. 3(a) shows that for the White population, the mortality rates increased continuously and peaked at ages 58–60 years, decreased between ages 61 and 66, and then increased sharply after age 70. For the Black or African American (BAA) population, the mortality rate increased from ages 16 to 24, followed by a slight decrease and then stability. For the Asian/Pacific Islander (API) population, the mortality rate slowly increased after age 16, exceeding the rate of the BAA population at age 46 years and older. For the American Indian/Alaskan Native (AIAN) population, mortality rates increased between ages 16 and 21, followed by a decreasing but fluctuating trend with large 95% confidence intervals (Supplementary Table S2). Fig. 3(b) shows that the period effects for the White and API populations have shown continuous upward trends since 1999. In contrast, the period effect for the BAA population decreased between 1999 and 2007, followed by a continuous increase. For the AIAN population, the effect fluctuated slightly between 1999 and 2010, and then showed more pronounced increasing trends with higher relative risk of period effects than seen among other groups. Fig. 3(c) shows that cohort effects for the BAA and API populations fluctuated in decreasing trends in the pre-1959 cohorts; in contrast, the White pre-1959 cohorts showed a smoothed increasing trend, while the AIAN pre-1959 cohorts showed a fluctuated increasing trend. Cohort effects increased for all races in the post-1960 cohorts. API cohorts born after 1989 showed the fastest rise, with a cliff-shaped pattern, increasing from 1.45 (95% CI, 1.27–1.64) in the 1989 cohort to 3.06 (95% CI, 2.48–3.77) in the 2001 cohort. The cohort effect risk of the White population exceeded the effect in the BAA population for those born after 1971 and exceeded both BAA and AIAN populations for post-1995 cohorts. In 2001, the cohort effect risk was highest in the API population, followed by the White (2.32 (95% CI, 2.11–2.56)), BAA (2.02 (95% CI, 1.75–2.33)) and AIAN (1.70 (95% CI, 1.23–2.29)) populations. Fig. 3(d) shows that the net drifts by race and the overall annual percentage change in mortality rates were 1.93% in the White population (95% CI, 1.83–2.03), followed 1.21% in the AIAN population (95% CI, 0.54–1.90), 0.78% in the API population (95% CI, 0.49–1.07) and 0.63% in the BAA population (95% CI, 0.41–0.85). The local drift showed decreasing trends in the BAA and API populations, and the drifts were less than zero among age 67 and above. In the AIAN population, the local drifts fluctuated substantially, and increased from −0.99 (95% CI, −3.60 to 1.69) in age 70–72 to 3.99 (95% CI, −4.96 to 13.79) in age 82–84. Wald tests indicated statistically significant age, period and cohort effects for the whole population and by gender (Supplementary Table S2). Full results and exact figures were showed in Supplementary Material 5–8.
Suicide mortality by race in the USA, 1999–2019, by age–period–cohort analysis. (a) Longitudinal age curve of suicide mortality rates (per 100 000 population) in the reference cohort (1959) adjusted for period effects. (b) Period rate ratios for suicide mortality relative to the 2008–2010 period. (c) Cohort rate ratios for suicide mortality (reference group: 1959 birth cohort). (d) Local drift value for suicide mortality rates: age-group-specific annual percent change (%) in suicide mortality rates; 95% confidence intervals are listed in Supplementary Table S2.

Discussion
In this study, we have quantified the age profile of suicide mortality for the US population, ages 16–84 years, using national data from 1999 to 2019. The results show an increasing trend in suicide mortality in the USA regardless of gender, race or birth cohort. We can see that, while overall increases in US rates during earlier years of the 21st century were driven largely by deaths during the middle years of life, more recent changes relate as well to dramatic increases among deaths in younger males and females. Indeed, younger cohorts face a rapidly increasing risk, with a relatively steep rise in suicide risk in recent years among females, the AIAN population and the younger API population. Consistent with previous studies, we observed continuing growth of suicide mortality among men and the White population – which accounted for most of the numerical increases in US suicide, given their overall rates.Reference Hedegaard, Curtin and Warner2,Reference Martinez-Ales, Pamplin, Rutherford, Gimbrone, Kandula and Olfson16
Although suicide rates were consistently higher among males compared to females, the period between 2013 and 2018 witnessed a steeper ascent in male suicide rates than in females, a phenomenon that demands deeper scrutiny.Reference Hedegaard, Curtin and Warner2 The marginal decline in suicide rates for both genders from 2018 to 2019 and then into 2020 now has been surpassed by increases reported for 2021 and 2022.
Second, dissecting recent increases in suicide rates reveals significant shifts in the age-related patterns of suicide mortality. Notably, there has been a disturbing rise in suicide rates among younger males in their early 20s, augmenting traditionally higher rates observed in older groups. This alarming trend may be related to the rapid increases in drug use and overdose mortality, given the demonstrated association of opioid and other drugs with suicides,Reference Wilcox, Conner and Caine21 as well as the use of firearms for suicide among young males.Reference White, MacInnes, Hingson and Pan22–Reference Fujita-Imazu, Xie, Dhungel, Wang, Wang and Nguyen24 An analysis of US mortality data for 2009–2018 reported an escalation in drug overdose mortality rates among young males, from 2922 to 4294 per 100 000 population, while the rate for young females increased from 1226 to 1655 per 100 000 population; further, the increase was higher among young Black (from 190 to 564 per 100 000 population) and Hispanic (from 592 to 1197 per 100 000 population) individuals than other racial/ethnic populations.Reference Gaur, Jacka, Green, Samuels, Hadland and Krieger25 In addition, there is growing concern about the misclassification of suicides as overdose deaths, estimated to be between 10% and 30%,Reference Rockett, Caine, Banerjee, Ali, Miller and Connery26 which may differentially affect reported rates for Black and Hispanic individuals.Reference Rockett, Wang, Stack, Leo, Frost and Ducatman27 While firearm suicide rates have historically been higher among middle-aged and older White people, another analysis of US mortality data for 1999–2019 highlighted a turning point from 2013 to 2019, when there was an 84.5% increase in firearm suicide rates among young Black males and a 76.9% increase among young Black females.Reference Kaplan, Mueller-Williams, Goldman-Mellor and Sakai-Bizmark28 These trends emphasise the critical need for a deeper exploration of societal and population-level factors that may be influencing suicide mortality trends across different age cohorts and racial and ethnic groups. The absence of such information will hamper or preclude the development of effective population-level preventive interventions.
In previous studies employing APC models, the focus has often been on specific gender, racial/ethnic groups or minority populations, or on comparing the effects among different suicide methods.Reference Phillips7,Reference Wang, Yu, Wang, Bao, Gao and Xiang13–Reference Martinez-Ales, Pamplin, Rutherford, Gimbrone, Kandula and Olfson16,Reference Salway, Gesink, Ferlatte, Rich, Rhodes and Brennan29 Our study extends this by showing that, despite higher overall suicide mortality rates in males, females in recent cohorts have been experiencing a significant increased risk of suicide compared to earlier times. Period effects demonstrate a continuous rise in suicide mortality for both genders. More critically, perhaps, cohort effects reveal a gradual increase in mortality risk for those born after 1977, with a pronounced escalation for cohorts born thereafter. The 2001 cohort exhibits the highest risk, with females at a risk ratio of 3.44 compared to 1.96 for males. This suggests that younger female cohorts, particularly those born in the 21st century, are encountering unique and significant health challenges.
While current studies often attribute the higher suicide mortality rates among males to the choice of more lethal methods, this cannot fully account for the observed differences in suicide mortality risk between genders.Reference Ahn, Park, Ha, Choi and Hong30,Reference Callanan and Davis31 According to the CDC, the decrease in suicide mortality caused by poisoning has shifted the leading methods of suicide for females since 2018 to firearms and suffocation, while firearms have consistently been the most common means among males.Reference Hedegaard, Curtin and Warner2 However, despite the correlation between firearm ownership rates and increased firearm suicides, the gender differences in access to suicide means may not entirely explain the differences in suicide risk.Reference Martínez-Alés, Jiang, Keyes and Gradus20,Reference Cai, Chang, Yip, Conner, Azrael and Miller32,Reference Martínez-Alés, Gimbrone, Rutherford, Kandula, Olfson and Gould33 Moreover, the local drift values in this study, which represent the net drifts by gender, revealed an overall annual percentage change in mortality rates from 1999 to 2019 of 1.67%. This drift, with its cosine-shaped distribution with age and being similar in both genders, suggests that certain age groups, particularly those aged 58–60, are experiencing a slightly higher annual increase in mortality compared to younger age groups. These patterns might reflect distinct health challenges or lifestyle factors prevalent among these age groups in the USA.
Our study shed light on the significant differences across racial populations, revealing distinct patterns and trends. Consistent with previous reports, we see that the White male population exhibits a distinct pattern in suicide rates: after remaining high across the middle-adult years, rates dip during the early-mid 60s before accelerating into later life. This pattern starkly contrasts with the trends observed in BAA and AIAN populations, where the rates either stabilise or fluctuate within a narrower range.Reference Stone, Jones and Mack34, Reference Ehlman, Yard, Stone, Jones and Mack35 Notably, the API population shows a gradual increase in mortality rates from age 16, eventually surpassing the BAA rates among individuals aged 46 and above. Our analysis reveals that low suicide mortality rates within racial groups does not equate to stable risk levels. The period effects for the White and API populations show a continuous upward trend since 1999. The BAA population experienced a decline from 1999 to 2007, followed by a continuous increase. The AIAN population’s period effects fluctuated until 2010, after which they exhibited pronounced increasing trends. Cohort effects further illuminate these differences. While the BAA and API populations showed decreasing trends in cohorts born before 1959, the White and AIAN populations exhibited increasing trends. Notably, all racial groups born post-1960 experienced an uptick, with the API population born after 1989 experiencing the steepest rise, underscoring the need for further research to understand the unique challenges faced in recent years by this very diverse set of groups.Reference Leong, Leach, Yeh and Chou36–Reference Cai and Lee39 The local drifts, representing the combined age and cohort effects, further emphasise the differences among racial groups. The White population experienced the highest overall annual percentage change in mortality rates, followed by the AIAN, API and BAA populations. The decreasing trends in local drifts for the BAA and API populations contrast with the increases observed in the White and AIAN populations, suggesting distinct underlying factors influencing these trends.
It is essential to acknowledge that although the rate ratios of the White population in period and cohort effects were not the highest, they account for the majority of suicide deaths, highlighting their significance in efforts to reduce the trend of increasing premature death and shortened life expectancy. The sharp increases in period effects following 2010 and cohort efforts among those born after 1989 suggest a potential erosion of protective factors, calling for urgent attention and targeted interventions. They portend further increases in overall suicide rates as these groups move into the middle and later years of their lives – times that have been traditionally associated with greater mortality.
In conclusion, our findings highlight that suicide preventions should be implemented years in advance of individuals reaching the brink of suicide. Using age effects as an example, the younger population that was at relatively lower risk in 1999 comprised populations in the middle years of life in 2019 that had higher rates than generations before them. These finding point to a potential window of opportunity to alter individuals’ life trajectories before ‘becoming suicidal’ is a near-term threat. The growing mortality risk among females and minority populations might be reflective of broader sociocultural or environmental shifts that have disproportionately affected their health. Hence, there is a pressing need for extensive research focusing on specific periods and cohorts, with a specific emphasis on how structural societal disparities may be influencing these trends.
This study has limitations. First, there is a lack of information on covariates that could explain cohort and period effects, including data regarding immigration, socioeconomic factors and access to healthcare. Second, the study uses national mortality rates that depend on the work of local medical examiners and coroners in the USA who, having been under-sourced for many years and overwhelmed during the opioid epidemic of the past two decades, may be misclassifying suicides because of drug-related fatalities, thereby introducing a ‘period effect’ that could skew mortality data, complicate the interpretation of trends in suicide rates and potentially inflate rates during crisis years.Reference Rockett and Caine40 Third, the study omitted data for Hispanic groups (given changing ethnicity classifications from the CDC across the decades) and individuals aged 85 and older, and the results showed variability at both age-group extremes, limiting the generalisability of our findings to these populations. Lastly, there were many missing or suppressed data for the AIAN population because of its relatively small size, resulting in wide 95% confidence intervals for related effects.
Our study underscores the multifaceted nature of suicide mortality in the USA and its evolving pattern during the past two decades. It underscores the urgency to delve deeper into the unique challenges faced by specific cohorts and emphasises the need for an integrated multiplicity of approaches that will address the diverse nature of this burgeoning public health crisis. Our findings call for tailored interventions, informed by age, gender and racial nuances, to effectively mitigate the rising tide of suicide mortality, mindful that younger generations tend to carry their increased levels of risk into the middle and later years of their lives. As we move forward, it is imperative to harness the insights from this study to inform policy decisions, healthcare interventions and community outreach programmes, ensuring that the most vulnerable groups receive the support and resources they critically need.
Supplementary material
To view supplementary material for this article, please visit https://doi.org/10.1192/bjp.2025.6
Data availability
All data used in this study can be freely accessed on CDC WONDER (https://wonder.cdc.gov/).
Author contributions
F.H., J.L. and H.L. conceived the study. E.D.C. provided overall guidance. F.H. conducted data analysis, prepared the first draft and finalised the manuscript. J.L., H.L. and E.D.C. critically reviewed results and provided valuable inputs on revision. All authors contributed to the critical review and editing of the manuscript. All authors had full access to the data in the study and accepted responsibility for submitting this study for publication.
Funding
This study is funded by the National Natural Science Foundation of China (grant number 72374095). The funder of this study had no role in study design, data collection, data analysis, data interpretation or writing of the manuscript.
Declaration of interests
None.





eLetters
No eLetters have been published for this article.