Introduction
In the latter part of the third stage, India is in a demographic transition with declining fertility and mortality. This marked decline in death rates is driven by improvements in health conditions due to medical progress and better living conditions. Such mortality decline has caused a steady increase in the average life span over time, reaching very high levels in recent years. Life expectancy has been increasing and is quite likely to grow in the near future as well. Life expectancy at older ages also began to increase during the 1950s. The mortality decline in India had begun in the early 1920s, and fertility has been declining since the early 1970s (Bhagat & Unisa, Reference Bhagat and Unisa2006). After that, there was a sharp growth in India’s population during 1921-1931 compared to earlier decades (Davis, Reference Davis1951). Since then, India’s population growth rate has steadily increased until 1981 but declined to 1.93 per cent per annum during the last decade (2001-2011) (Bhagat & Unisa, Reference Bhagat and Unisa2006). Thus, the rising life expectancy along with a simultaneous decline in fertility rates have led to dramatic ageing of the population (Butler, 2008) of many countries, including India. The shift in age structure in relation to population ageing has a profound impact on the economy and society (Bhagat & Unisa, Reference Bhagat and Unisa2006). The increased burden of pension and social security for the aged has led to an expected increase in the number of retirees. Therefore, understanding the implications of longevity improvements on the quality (health, work, skills) of extended years of life needs to be assessed (Dhillon & Ladusingh, Reference Dhillon and Ladusingh2013).
In order to understand the implications of improvements in longevity, it is essential to measure old age in current times by considering several dimensions of aging. An important limitation of the conventional measures of ageing, such as the proportion of people aged 65 or 80 years and above, or the old-age dependency ratio, is that they do not take into account the variations in life expectancy that have been observed in most of the world over the past five decades (Sanderson & Scherbov, Reference Sanderson and Scherbov2010; Spijker, Reference Spijker2015). The old-age population living today is healthier and has less severe disabilities than their earlier counterparts in most parts of the world (Christensen et al., Reference Christensen, Doblhammer, Rau and Vaupel2009). Ageing is a multi-dimensional process, and chronological age is only one characteristic of people. The conventional measures of ageing do not account for the major improvements in health and life expectancy, thus leading to a tendency to overestimate the impact of population ageing when these indicators are used (Spijker & MacInnes, Reference Spijker and MacInnes2013). There have been many alternative approaches to measure ageing (Chu, Reference Chu1997; d’Albis & Collard, Reference d’Albis and Collard2013; Ryder, Reference Ryder1975; Skirbekk et al., Reference Skirbekk, Loichinger and Weber2012), and the prospective age approach has been significant among all in measuring population ageing (Sanderson & Scherbov, Reference Sanderson and Scherbov2005, Reference Sanderson and Scherbov2007, Reference Sanderson and Scherbov2008, Reference Sanderson and Scherbov2010). Initially prospective age approach was defined, the size of the elderly population (i.e., the people who are older than the old-age threshold) was estimated based not on chronological (and thus on retrospective) age but on a forward-looking approach that defined the old-age threshold based on the prospective age. The fundamental idea behind the prospective age approach is that, for a certain country, a 65-year-old person in 1970 is likely to be very different from a 65-year-old person in 2010, because of increases over time in life expectancy and because a person’s behaviour is influenced more by the expected remaining years of the life of a person than by the years of life already lived (Demuru & Egidi, Reference Demuru and Egidi2016). Sanderson & Scherbov (Reference Sanderson and Scherbov2005, Reference Sanderson and Scherbov2007, Reference Sanderson and Scherbov2008, Reference Sanderson and Scherbov2010, Reference Sanderson and Scherbov2013, Reference Sanderson and Scherbov2015), therefore, argued in line with the earlier argument by Ryder (Reference Ryder1975) — that it is better to use an old-age threshold that is constructed based on a fixed remaining life expectancy instead of a fixed chronological age. Hence, for a certain country, a person with 15 remaining years of life in 1970 was considered closely comparable to a person with 15 remaining years of life in 2010. The prospective age approach was later on modified and generalised into the “characteristic approach” (Sanderson et al., Reference Sanderson, Scherbov and Gerland2017; Sanderson & Scherbov, Reference Sanderson and Scherbov2013, Reference Sanderson and Scherbov2015, Reference Sanderson and Scherbov2016). Instead of working with a constant 15 years of RLE, other characteristics that have direct implications for ageing like mortality rate, grip strength, chair rise speed, or equitable pension age (defined by life course ratio) can also be used to redefine ageing. The characteristics approach is based on the translation of quantitative measures of people’s characteristics into a new form of age measure that is called “alpha-age.” For example, if the average cognitive level at age 70 years in the year 2000 was equal to that at the age 60 years in the year 1950, the approach considered age 60 years in 1950 the same as the age 70 years in 2000 (Sanderson et al., Reference Sanderson, Scherbov, Weber and Bordone2016). Recently, Balachandran & James (Reference Balachandran and James2019) also applied this approach and presented a cross-country comparison of population ageing measures by combining the life course characteristic with a constant characteristic of RLE 15
The prospective age approach and the comparative prospective old-age threshold contributed to accommodating differential improvements in life expectancies in different populations, but many other important features remain overlooked. There have been changes among older persons in other aspects such as improvements in health, decrease in disabilities, improvements in intellectual abilities, and ability to contribute productively (Lutz et al., Reference Lutz, Sanderson and Scherbov2008; Manton et al., Reference Manton, Gu and Lowrimore2008; Muszyńska & Rau, Reference Muszyńska and Rau2012; Philipov et al., Reference Philipov, Goujon and Di Giulio2014; Skirbekk et al., Reference Skirbekk, Loichinger and Weber2012; Spijker & MacInnes, Reference Spijker and MacInnes2013; Williams, Reference Williams2013). Balachandran & James, (Reference Balachandran and James2019) adopted a novel multi-dimensional methodology which is primarily the application of the characteristic approach (Sanderson & Scherbov, Reference Sanderson and Scherbov2013, Reference Sanderson and Scherbov2014, Reference Sanderson and Scherbov2016) to identify the parity of ages across populations after accounting for different dimensions of health or other aspects of wellbeing in the population. This measure also takes a ‘progressive’ approach to measuring ageing, as proposed by (Sanderson & Scherbov, Reference Sanderson and Scherbov2005, Reference Sanderson and Scherbov2013). But it represents an improvement over the existing applications (Balachandran et al., Reference Balachandran, de Beer, James, van Wissen and Janssen2017; Sanderson et al., Reference Sanderson, Scherbov, Weber and Bordone2016) as it is sensitive to the conditions in developing countries. The methodology generates a multi-dimensional old age threshold (MOAT). This is the value of the old-age threshold that is obtained after accounting for changes in the different dimensions of health and wellbeing of a population. Hence, if the MOAT of a particular population A, is 60, and the MOAT of another population B is 65, it means that being age 65 in population B is the same as being age 60 if the differences in the multiple dimensions related to health and wellbeing are accounted for. Hence, while the methodology accommodates health and wellbeing dimensions among older adults, it does not assume that the population above an abstract threshold age such as 60 or 65 is ‘elderly’.
Prospective aging concept as a measure of aging is rarely used in India context and a very few studies has been conducted in Indian context, and hence this research will be a substantial addition to literature. While the concept was given by Sanderson and Scherbov, can be seen as a breakthrough in the research to define old age thresholds, this indicator could be further enhanced to define old age thresholds in the Indian context by incorporating information on the population’s health status and other dimensions that accounts for the quality of the extra years of life gained through longevity improvements. The old-age dependency ratio adjusted for the new old age thresholds will have economic and policy implications in terms of retirement age and pension policies. So, this paper aims to estimate the old-age threshold using the multi-dimensional approach by adding two more dimensions to those adopted by Balachandran & James (Reference Balachandran and James2019). The present work is an application of the famous Characteristic Approach given by Sanderson & Scherbov (Reference Sanderson and Scherbov2013) and the multi-dimensional approach using different characteristics (Sanderson et al., Reference Sanderson, Scherbov, Weber and Bordone2016) to India and its select states. Further, this paper estimates the multi-dimensional old-age dependency ratio (MOADR) and compares it with the conventional old-age dependency ratio (OADR).
Data and Methods
Data source
The study compiled data from the Sample Registration System (SRS), Census of India 2011, and Study on Global Ageing and Adult Health (SAGE), Wave 1 conducted in 2007-10. The information on health and human capital was obtained from SAGE, wave-1which represented a national representative sample of 7150 persons aged 50+, covering major Indian states that includes Assam, Karnataka, West Bengal, Maharashtra, Uttar Pradesh, and Rajasthan Therefore, the analysis of the paper was restricted to these major states of India. Further, the life expectancies for age groups ranging from 50 to 85+, time for both sexes were retrieved from the SRS based abridged life tables for 2007-11 (Registrar General of India, 2013).
Measurement of multi-dimensional variables:
To depict the multiple dimensions in the computation of the MOAT, the variables were selected to represent the dimensions of life expectancies, health, and intellectual abilities. These variables used in the study are defined as below-
i) Remaining Life expectancy
To represent the changes in the life expectancy dimension, the remaining life expectancy of 15 methods (RLE=15) was adjusted according to the improvements in life expectancies. The RLE=15 method redefines the conventional old-age threshold value by successfully accommodating the improvements in life expectancy in different populations over time (Sanderson & Scherbov, Reference Sanderson and Scherbov2005, Reference Sanderson and Scherbov2007, Reference Sanderson and Scherbov2010). However, the selection of the value 15 in these studies was based on the fact that the RLE of the European population in 1970 was 15. The RLE 15 method of measuring old age threshold was being taken as a standard in many studies irrespective of the variability across regions and populations. This abstract selection of the old-age threshold does not adjust for the exceptionality of reaching the age at which RLE=15, because there will be variations according to different regions and populations. Hence in the present study, a standard RLE was calculated for the Indian scenario, the old age threshold based on this standard RLE was derived for the multi-dimensional measure.
ii) Health:
To capture the dimension of health, the variable describing the general health given by self-rated health, handgrip strength (HS) as a good measure of muscle strength, and activities of daily living (ADL), both of which describe functional abilities among older people were considered.
a) Self-rated health (SRH):
Self-rated health has been identified as a good proxy for actual health status and found to be correlated with mortality and morbidity patterns in many studies (Jylhä, Reference Jylhä2009; Miilunpalo et al., Reference Miilunpalo, Vuori, Oja, Pasanen and Urponen1997). The data contains the variable where respondent is asked how they feel about their health, which is categorized as- Very good, good, moderate, bad and very bad. The person with good or very good self-rated health has been coded as 1, else coded as 0.
b) Handgrip Strength (HS):
In the SAGE, handgrip strengths were measured in kilograms using a Smedley spring-type dynamometer. In the present paper, the variable on handgrip strengths was derived as the average of four observations, two for each hand. The detail of the measurement of handgrip strength is defined elsewhere (Arokiasamy et al., Reference Arokiasamy, Parasuraman, Sekher, Lhungdim and Kowal2015).
c) Activities of Daily Living (ADL):
To capture the level of abilities with ADL, this work considered the individuals’ ability to perform six activities- walking, eating, bathing or showering, using the toilet, dressing, and getting in and out of bed. If an individual is able to do all these activities, she/he was identified as having no functional disability (coded 1), and those who were not able to perform all of these activities were coded as 0.
iii) Intellectual abilities:
To capture intellectual abilities, the level of cognition among the population was measured. A widely used measure of cognitive ability is the number of words recalled out of ten words from a pre-set list (Skirbekk et al., Reference Skirbekk, Loichinger and Weber2012; Weber et al., Reference Weber, Dekhtyar and Herlitz2017). A higher number of words recalled indicated a better level of cognition.
Methodology
The study applied the multi-dimensional approach proposed by Balachandran & James (Reference Balachandran and James2019) and Sanderson et al. (Reference Sanderson, Scherbov, Weber and Bordone2016), for computing the Multidimensional Old-age Threshold (MOAT). This method is based on the Characteristic Approach that was formulated by Sanderson & Scherbov (Reference Sanderson and Scherbov2013) implement different characteristics or dimensions. In addition to the three dimensions (RLE, Cognition, ADL) used by Balachandran & James (Reference Balachandran and James2019), this study included the five dimensions (RLE, Self-rated health, Handgrip strength, ADL, Cognition).The eight age-groups (50-55, 55-60, 60-65, 65-70, 70-75, 75-80, 80-85, 85+) were considered for computing the MOAT. There are 4 steps for the computation:
Step 1: Selection of Standard Population
The standard population is chosen by the method adopted by Balachandran and James (Reference Balachandran and James2019), for better cross-regional comparison. The standard population is computed by the mean of the highest and lowest values for each of the dimension for each age-group across the states, which is mathematically expressed as:
 $${{\rm{V}}_{s,Tk,i}} = {{{{\rm{V}}_{maxTk,i}} + {{\rm{V}}_{minTk,i}}} \over 2}$$
where V s,Tk,i refers to the value of the standard population(S) of the dimension(Tk)at age i. k=1 to 5, as five dimensions- remaining life expectancy, handgrip strength, self-rated health, cognition or ADL. V minTk,i is the minimum value of Tk at age i across the Indian states considered, and V maxTk,i is the maximum value of the Tk at age i across the states. The dimensions have the units of measurement as follows- RLE in years; handgrip strength in kilograms; self-rated health as proportion of population in good health; cognition as number of words; and, ADL as proportion of population able to perform the functional activities.
Step 2: Selection of the optimal value
After obtaining the standard population for all the 5 dimensions, optimal value for each dimension was obtained by aggregating the values across the age-groups, from the standard. Mathematically, it can be expressed as:
 $$O{{\rm{V}}_{Tk}} = \mathop \sum \limits_{i = 50}^{85 + } {\rm{V}}s,{T_k},i/N$$
where, OV Tk is the optimal value using the dimension Tk; V s,Tk,i is the value of the standard population S of the dimension Tk at age group i. and N is 8 number of age-groups.
Step 3: Identification of the dimension based old age threshold
Old-age threshold for each dimension is identified by the age at which a particular state reaches the optimal value, such as, if the optimal value of RLE is 13 and a population reaches it at age 68, then age 68 is considered as the old-age threshold for RLE. It can be expressed as:
 $$\rm{O{T_{P,T}}:l{C_{P,T}} = O{V}_{\it Tk}}$$
where OTP,T is the old-age threshold of population P of the dimension T, which is age of population P where value of the dimension T (lCP,T) is same as the optimal value of T (OV Tk ). A linear interpolation technique has been used as there are 5 year age groups, in order to find the exact old-age threshold. Suppose lCP,T 1 and lCP,T 2 are the ages which has the OV Tk lying in its corresponding dimension values, such that,

Then we estimate,
 ${\rm{O}}{{\rm{T}}_{P,T}} = lC_{P,T}^1 + {\rm{\;}}{{\left( {{\rm{O}}{{\rm{V}}_{Tk}}{\rm{\;}} - OT_{P,T}^1} \right)\left( {lC_{P,T}^2 - {\rm{\;}}lC_{P,T}^1} \right)} \over {\left( {{\rm{\;}}OT_{P,T}^2{\rm{\;}} - OT_{P,T}^1} \right)}}$
Step 4: Estimation of dimension-based OAT and computation of MOAT
The dimension based old-age thresholds for each population is then combined by the mean of values of the old-age thresholds of each dimension. Thus we get the multi-dimensional old-age threshold (MOAT) that incorporates the changes in different dimensions of health, life expectancy, and intellectual abilities, and mathematically it can be expressed as follows:
 $${\rm{MOA}}{{\rm{T}}_{\rm{p}}} = \mathop \sum \nolimits_{T = 1}^5 {\rm{OTP,T}}/5$$
where MOATP is the MOAT of population P, old age threshold of dimension T for the population P is OTP,T (Balachandran & James, Reference Balachandran and James2019).
A sensitivity analysis was done to check how the MOAT is sensitive to the changes in addition of dimensions.
Further, to assess the implications of MOATs on old age dependencies, the study computed the Old-Age Dependency Ratio(OADR) adjusted for MOAT and call the Multi-dimensional old-age dependency ratio (MOADR). The Conventional OADR was defined as the ratio of the number of people 60 years or older to the number of people ages 15 through 59
 $$OADR = {{Number\;of \;people\;60\;years\;or\;older} \over {Number \;of \;people \;ages\;15\;to\;59}}$$
The MOADR was defined as the ratio of the number of people above the MOAT to the number from age 20 to MOAT
 $$MOADR = {{Number{\rm{\;}}of{\rm{\;}}people{\rm{\;}}older{\rm{\;}}than{\rm{\;}}MOAT} \over {Number{\rm{\;}}of{\rm{\;}}people{\rm{\;}}aged{\rm{\;}}20{\rm{\;}}to{\rm{\;}}MOAT}}$$
The computation and comparisons of both the conventional OADR and MOADR were made using the data from the census 2011 for India and selected states.
Results
Estimates of old age thresholds for different dimensions in India and states
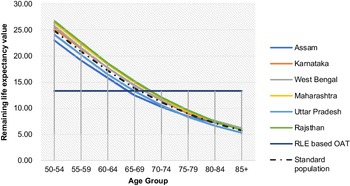
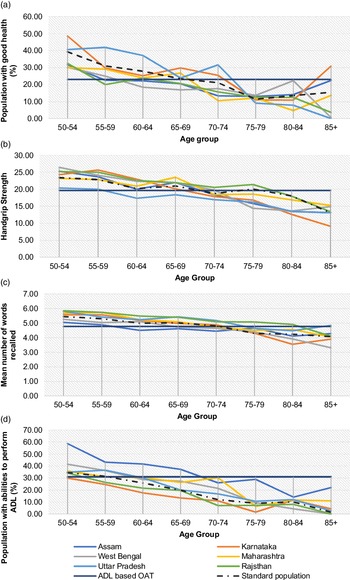
This section presents the results of dimension-based old-age thresholds- remaining life expectancies, self-rated health, handgrip strength, abilities to perform ADL, and cognition by age for both sexes for India and selected states. The age-specific values for each dimension along with the values for the standard population (dotted line) for each dimension were plotted in Figure 1 and Figure 2. The standard population for each dimension except the self-reported health showed a decline with an increase in age, self-rated health showed a slight increase in the last age group.
Remaining life expectancy across different age groups for selected Indian states, (2007-11); Note: Mid-point of each age-groups have been considered.

Percentage of population by each dimensions- good health, Handgrip strength, ADL and cognition across different age groups for selected Indian states.

The RLE-based optimal value which was identified as 13.3 (Figure-1). The value was estimated based on the conditions among the Indian states considered and was not an abstractly chosen value as in the RLE=15 method. The study observed the RLEs monotonically decreasing with the increase in age in all six states. After the age of 65, the RLEs of all the states started falling below the optimal value. Different states showed a different levels of decline in RLE across the age-groups. The RLEs of Uttar Pradesh and Assam showed a lower RLE in comparison to other states.
The second dimensional old age threshold representing general health, as shown in Figure 2 (a), was the percentage of the population with good health as reported by the individuals, showing quite a fluctuating pattern but decreasing with age eventually. The states of Assam, Rajasthan, and West Bengal showed a lower percentage of the population with good health across the age-groups as compared to other states and fell below the optimal value of 23 by the age of 60. In other words, after age 60 there were less than 23% of persons with good self-rated health in these states. While other states, namely Maharashtra, Karnataka, and Assam, fell below the optimal value after the age of 70.
It is observed from Figure 2 (b) that the handgrip strength also decreased with the increase in age with variations across different states. Uttar Pradesh had a lower handgrip strength in comparison to other states and had fallen below the optimal value of 19.6 by the age of 60 years, while in other states handgrip strength was observed below the optimal value after reaching age 65 or 70 years. Figure 2 (c) represents the percentage of the population with abilities to perform ADL, which decreases in general across all the states with an increase in age. However, states like Karnataka, Rajasthan, and Uttar Pradesh have lower ADL abilities across different ages, as they fall below the optimal value 31 by age of 60, in comparison to other states with better abilities in ADL across age groups. Figure 2 (d) shows the average number of words recalled that also declined with age and had an optimal value of 4.8. Here, the performance of Assam is quite low in comparison to other states as it was below the optimal value at the age of 60, while all the other states fell below the optimal value by the age 70.
Estimates of MOAT in India and its sensitivity to additional health dimensions to RLE
The sensitivity of MOAT was checked by keeping all combinations of RLE and the other four dimensions of health (Table 1). RLE-based OAT was 65.9 years, which increased the maximum up to 68.5 years by adding the cognition dimension. On the other hand, OAT is minimum at 65.2 years by adding the ability to perform ADL in the dimension of RLE. With a total of three dimensions, MOAT ranged between 65.9 to 67.7, and with four dimensions it ranged between 66 and 67.6. The overall value of MOAT by considering five dimensions was 67 years
MOAT (in years) in India by using RLE and other dimensions of health

Estimates of the MOAT in India and states
This section of the results provides the estimates of MOATs which were estimated by using the optimal values of the five dimensions. Table 2 shows the estimates of OAT based on each dimension and the MOAT in the selected states and India. The overall MOAT for India was 67 years, where only one state-observed below 65 years. It was the highest in Maharashtra (68.6 years) and Rajasthan (65.5 years) and the lowest in Assam (63.9 years). The MOAT value implied that at the age of 67 years, Indians have 13.3 years of remaining life expectancy, 23 percent stated good health, having 19.6 Kilograms mean grip strength,31% were able to perform all of the ADL and on average, they could recall around 5 words (4.8).
Estimates of old-age thresholds (years) for different dimensions and MOAT

The OAT based on the standard value of RLE (13.7) was age 65.9 years which is higher than the old age considered in most of the Indian Government programmes and policies for elderlies. This RLE-based OAT varied from only 63.1 years in Assam to 67.4 years in Rajasthan. Similarly, for India’s OAT based on self-rated health, the handgrip strength and the ability to perform ADL were 66.1 years, 67.4 years, and 64.5 years respectively. There was a huge variation by state in all measured OAT. Rajasthan (53.9 years) observed the lowest level of OAT based on self-rated as compared to Uttar Pradesh (72 years). OAT based on handgrip strength varied from only 55.6 in Uttar Pradesh to 77.5 years in Rajasthan. Similarly, OAT based on ADL was 55.8 years in Karnataka as compared to76.8 years in Assam. Further, the cognition based OAT for India was 71 years, which varied from 56.4 in Assam to 77.9 in Rajasthan.
Gender differentials in MOATs
Table 3 depicts the estimates of MOATs and OATs for each dimension by gender. The state of Maharashtra had the highest MOAT for males (67.7 years), while West Bengal had the highest MOAT for females (66.6 years). Assam had the lowest MOAT for both males (65.2) and females (63.4). Karnataka was the only state having a higher MOAT for females than that of males. The OATs based on RLE, are quite similar in both the genders and across the states. Though the overall RLE based OAT was higher for females (67.3 years) than males (64.5 years). Karnataka also had a higher OAT based on self-rated health for both males (71.4 years) and females (73.1 years). Females in West Bengal had the highest handgrip strength-based old age threshold (78.3 years) and which was higher than that of males in West Bengal. Abilities to perform ADL-based OAT is the highest for both males (79.2 years) and females (74.9 years) in Assam. Karnataka observed a higher OAT based on cognition for females than that of males.
Gender differentials in OAT based on different dimensions and MOAT

The gender gaps in MOATs and dimensions-specific OATs in India and states as portrayed in Figure 3 suggested a positive (favourable to men) gender gap in the overall MOAT in India and all states except (Karnataka). Gender gaps in all types of OATs (except RLE-based OAT) were favourable to men than women in India. The highest gender gap was observed in OAT based on performing ADL, where men had almost ten years of higher OAT than that of women. Further, this association is true in all states except Uttar Pradesh. Assam and Karnataka states had the least gender differentials in OAT, Uttar Pradesh also showed fewer gender gaps in OAT except OAT based on self-rated health where men had around 8 years higher OAT than women. Rajasthan and Maharashtra showed higher gender (more than 5 years) differentials in almost all the dimensions.
Gender gap in India across different dimension based old age thresholds and MOAT.

Rural-urban differentials in MOATs
The rural and urban lifestyles and health status are enormously different in India. Therefore, the MOAT was derived by place of residence and shown in Table 4. The MOAT was higher for urban (68.2 years) as compared to rural (66.4 years) residents. The RLE-based OATs observed the marginal differences in all states, overall in India, the RLE-based OAT for urban (67 years) was higher than that of rural (65.4 years). In terms of general health dimension, the OAT for Assam (Urban: 70.2; Rural: 66.6) and Karnataka (Urban: 72.8; Rural: 59.6) had higher urban-rural differentials; whereas Uttar Pradesh showed an opposite result with a higher OAT in rural(71 years) than in urban (62.9 years). The OAT based on handgrip strength in India had around one-year gap only, the larger gaps were observed in Assam and Rajasthan (in favourable to the rural area) whereas, Karnataka and West Bengal (in favourable to the urban area). India’s OAT based on the ability to do ADLwas higher in rural (65 years) than urban (63.2 years), West Bengal observed the highest rural-urban differential with 72.5year OAT in urban as compared to 64.6 years in a rural area. Further, the cognition based OAT in India was also higher in urban(72 years) as compared to rural(68 years), but strikingly Rajasthan (Urban: 68.8; Rural: 80.6) and Uttar Pradesh (Urban: 52.8; Rural: 74.5) had a rural residence in advantages.
Rural-urban differentials in OAT based on different dimensions and MOAT

Implications of redefined old-age (MOATs) on old-age dependencies
The estimated MOATs in all states were higher than 60 in all states. Therefore, the shares of older persons (60+) to the total population were higher in all selected states as compared to the old aged share above MOAT of respective states. So, the burden of ageing decreases to a great extent if MOAT is considered rather than the conventional age 60which is the age at the retirement of general employees of the central government of India and in all of the selected state Government employees (Table 5). The share of old-age reduced by half from 8% (60+) to 4% (MOAT:67+) in India. In Maharashtra, the percentage of the elderly was the highest (9.3%) that reduced to 4.9% with revised old age (MOAT:68.6). The old-age dependency ratio decreased from 14.2% to 7.3% for India if the MOAT is considered instead of the age 60. Assam state which had the lowest burden of ageing (measured conventional age 60) among selected states, had the higher old-age dependency measured with the multi-dimensional approach. Further, gender gaps in old-age dependency increased sharply when measured with MOAT (females have doubled OADR than males) as compared to when it was measured with old age 60 (1 percentage point difference between females and males). However, rural-urban differentials in the burden of ageing narrowed down with the multi-dimensional approach.
Share of older persons to total population and old age dependency ratio according to conventional OAT (age 60) and MOAT in India and states, 2011

Discussion
The concept of old-age should be broader than the simple crossing of a fixed age threshold that does not refer to an individual’s life history, health, and vitality (Ryder, Reference Ryder1975; Sanderson & Scherbov, Reference Sanderson and Scherbov2007). The prospective measures based on remaining life expectancies have been derived and well discussed, particularly on data on developed and ageing countries (Sanderson & Scherbov, Reference Sanderson and Scherbov2008). Ageing involves physical changes, the ability to do daily activities, maintain a good posture and balance, muscular strength and joint movement (handgrip strength), mental ability, good health, a coalescence of all these elements that contribute to effective work participation (Magnavita, Reference Magnavita2017). In addition to three dimensions- RLE, ADL and cognition-based MOAT (estimated value 58.2) proposed by Balachandran & James, (Reference Balachandran and James2019), the present study included two more dimensions- self-rate health and handgrip strength for producing the multi-dimensional estimate of the OATs.
The study estimated MOAT for India as 67, indicating that improvement in multiple dimensions of ageing has led to an increase in the standard definition of old-age (60+). These estimates of MOATs are comparable across states as they are derived from the standard population. On average all the populations by reaching MOAT age follow the standard population characteristics that is, 13.7 years of remaining life expectancy, 23 percentage stated good health, having 19.6 KG of handgrip strength, 23% were able to perform all of the ADL and on an average, they could recall around 5 (4.8) out of 10 words. Standard values of each dimension is lower than other cross countries studied (Balachandran & James, Reference Balachandran and James2019) as Indian adults have lower levels of life expectancy, health, cognitive skills. Therefore, MOAT derived in this paper is not comparable with these cross-country studies rather, they are comparable within India.
The OAT estimates for India derived using RLE is 65.9 years which rose to the maximum level of 68.9 by adding the cognitive dimension and reduced to 65.2 by adding the ADL dimension. The present study estimate of MOAT in India based on five dimensions is at 67 years which is consistent to be above 65 years in all sensitivity analysis by taking different combinations of health dimensions with RLE. These findings recommend an extension of the retirement age for all Indians. For those who work in the sector where cognitive skills are the basic requirement of the work, it may even increase beyond 68 years as OAT based on cognition dimension is 71.1 years and OAT based on both cognition and RLE is 68.5.
Maharashtra is found to have the highest MOAT, followed by, West Bengal and Karnataka, and the lowest in Assam. Around 68.6 years old person from Karnataka is equal to 63.9 years old person from Assam. A higher value of the old-age threshold signifies that the optimal value is reached at later ages and indicates better performance by that state. Among the states that are considered in the study, Karnataka and Maharashtra have higher Human Development Index (HDI) values, whereas Rajasthan and Uttar Pradesh have lower HDI values (Rashid, Reference Rashid2020). It has been previously shown in studies that the general health among older adults in the South Indian states is significantly better than in other provinces in the rest of India (Giridhar et al., Reference Giridhar, Sathyanarayana, Kumar, James and Alam2014; Rajan et al., Reference Rajan, Mishra and Sarma2001). Assam is performing better in ADL-based OAT and handgrip strength-based OAT, which account for good functional abilities, but the overall MOAT value is low as Assam has a lower OAT value in the cognition dimension. A similar pattern of this result has been obtained in the MOAT-based study done by Balachandran & James (Reference Balachandran and James2019).
The South Indian state of Karnataka is the only state having a higher MOAT of females than that of males. The South Indian states show comparatively higher gender equality (Balarajan et al., Reference Balarajan, Selvaraj and Subramanian2011). Rajasthan has the highest gender gaps in MOATs, followed by Maharashtra and Uttar Pradesh. Rajasthan has the highest gender gap in the cognition-based old-age threshold, indicating the low level of access to education for females and cultural biases against female literacy can be accounted for such a pattern in the cognition-based OAT (Balachandran & James, Reference Balachandran and James2019; Lee et al., Reference Lee, Shih, Feeney and Langa2014).
Further, each dimension-based OAT (except RLE-based) value is higher among men than women implies that women become early older than men in spite of having longer life expectancy than men because of early worsening of health. The functional disabilities among women being more than men lead to pushing them to old age much earlier than men. Women live a longer life but poorer health state as compared to men, primarily due to biological, social, and behavioural factors (Bora & Saikia, Reference Bora and Saikia2015; Friedman et al., Reference Friedman, Tucker, Schwartz, Tomlinson-Keasey, Martin, Wingard and Criqui1995; Nathanson, Reference Nathanson1984; Rogers et al., Reference Rogers, Everett, Onge and Krueger2010). The states like Uttar Pradesh and Rajasthan have noticeable gender gaps in terms of old age thresholds in different aspects. There are gender differentials in disabilities, especially in activities of daily living (Arber & Cooper, Reference Arber and Cooper1999; Kandrack et al., Reference Kandrack, Grant and Segall1991; Murtagh & Hubert, Reference Murtagh and Hubert2004; Wray & Blaum, Reference Wray and Blaum2001). A cumulative disadvantage for women in many socio-economic aspects could be responsible for the multi-dimensional disadvantage in health. The elderly population is increasing. Also, there are prevalent gender gaps in India, so holistic gender-sensitive health agenda is required, which will recognise the multi-dimensionality of deprivation of health aspects among women. Also, a serious need is noted to increase the budget in aspects of health and education for men and women to be at an equal platform of good quality of life.
There is a marginal difference in MOAT estimates in rural and urban areas where the Indian urban population has two years higher MOAT than the rural population. These differences are contributed by rural-urban gaps in longevity, self-rated health, and cognition. Quality of life among the Indian elderly is poorer in a rural than urban area (Usha & Lalitha, Reference Usha and Lalitha2016), rural elderly have high risk of suffering from depression than their urban counterparts (Akila et al., Reference Akila, Arvind and Isaac2019). However, in comparison to other states, the elderly from rural Uttar Pradesh has better self-rated health. Further, a low level of education in a rural area can account for low cognition skills among rural elderly (Ganguli et al., Reference Ganguli, Ratcliff, Huff, Belle, Kancel, Fischer, Seaberg and Kuller1991). However, the two economically backward states of Uttar Pradesh and Rajasthan show a different scenario of having very high cognition OAT in a rural area than urban. A reason for such an abstract result could be because the majority of samples in these states have rural places of residence (Singh et al., Reference Singh, Jasilionis and Oksuzyan2018). On the other hand, rural elderlies are more active due to participation in agricultural and allied activities (Dhillon & Ladusingh, Reference Dhillon and Ladusingh2013) and husbandry work which can account for better functional health and higher value of OAT based on ADL and handgrip strength.
A criticism that could be made about using the single-dimensional measure of ageing is that it tracks progress in survival, without evaluating the conditions in which older people live their extended years of life. The old-age thresholds defined in conventional way do not include any information about the quality of the remaining life expectancy. This could lead to inaccurate estimates of the socioeconomic consequences of population ageing, as improved longevity would be a truly positive development if the years of life gained are spent in good health. Hence, the multi-dimensional approach is a very robust method. Health conditions are especially relevant when assessing the impact of population ageing on society: indeed, the true borderline between adult and older ages could be drawn at the point at which a person’s health status deteriorates to the extent that he/she is no longer able to live successfully and independently, and has thus become an economic and social burden on society (Preston & Wang, Reference Preston and Wang2006). Handgrip strength emerged as a very important indicator that is related robustly to mobility outcomes and weakness across outcomes as suggested by previous studies (Duchowny et al., Reference Duchowny, Clarke and Peterson2018; Lauretani et al., Reference Lauretani, Russo, Bandinelli, Bartali, Cavazzini, Di Iorio, Corsi, Rantanen, Guralnik and Ferrucci2003; McGrath et al., Reference McGrath, Kraemer, Snih and Peterson2018; Snih et al., Reference Snih, Markides, Ottenbacher and Raji2004). The handgrip strength also determines the working ability of employees and hence is significantly related to work participation (Rostamzadeh et al., Reference Rostamzadeh, Saremi and Fereshteh2020). The study highlighted the implications of the multi-dimensional old-age thresholds in measuring the burden of population ageing within the country. By changing OAT from 60 to MOAT of respective states and India, the burden of population ageing (proportion of elderly and OADR) reduce to a great extent. However, gender differential increases in the burden of ageing. The current retirement age for most of the central government workers in India is 60. The Finance Ministry’s Economic Survey of India 2018-19, suggested that the government should increase retirement age from the current age with is 60 years in India. This survey did not mention what the new OAT should be, but it catered to the pensionable reforms undertaken in UK, Germany, China and Japan, which are gradually increasing their retirement age; for instance, in case of Japan, it has increased from 66 years to nearly 70 years (Ministry of Finance, 2019). Though, this varies across states (56 years in Kerala, 62 years in Uttar Pradesh) (Government of India Pensioner’s portal). The retirement age also depends on the nature of work, say for central government doctors and university professors it is 65 years. This significant proportion of elderly work participation after age 60 (37.3 per cent) (NSSO, 2011) also suggests extending the retirement age. An increase in retirement age can also significantly contribute in GDP growth of the country. It has been observed that aging countries like Italy and Japan have high GDP (Okunade et al., Reference Okunade, You and Koleyni2018). Extension of the retirement age can also bring forth the rise in the female labour force participation in the older age-groups (Subramanian, Reference Subramanian2019). However, the suggested policy change should not affect the entry of the workforce.
Conclusion
The elderly have traditionally been defined as individuals older than a fixed chronological age threshold (usually 60 or 65) which does not account for the change in longevity, health, and human capital. Most of the policies and programmes on the elderly in India consider a person age 60 and above as an elderly. Even in some states of India, the retirement age is still 58 years. The present study throws light on the empirical evidence of measuring old-age thresholds using the different dimensions of RLE, self-rated health status, ADL, handgrip strength, and cognition among aged 50 years and over. The study presents the evidence to recommend the increase in retirement age in India. These findings are crucial from gerontological and retirement policy perspectives. These findings recommend an extension of the retirement age for all Indians up to 67 years (with a minimum of 65 years where a good performance of ADL is necessary for pursuing a job and a maximum up to 68 where cognition is a required job skill). However, these recommendations are purely based on the health status and remaining life expectancy of individuals and do not capture the issues related to work performance, Government spending, and the effect on job availability for younger generations. These findings indicate a need to review state-level policy on retirement age for its possible extension. Further, this methodology can be applied in all states of India using recent data on multiple dimensions.
The study arrived at a 67 years of MOAT for India where Indians have 14 years of remaining life expectancy, 23 percent stated good health, having handgrip strength of 19.6 KG, 23% can perform all of the ADL, and on average, they could recall around five words out of 10. Keeping these characteristics of populations as standard, 64 year old woman is similar to 68.8 year old man, and 66 year old rural person is equal to 68 year old urban person. Similarly, 68.8 years old from Maharashtra is equivalent to 63.9 years old from Assam. The RLEs of all the states fall below the optimal value (13.7) after reaching age 65, this suggests if a uniform OAT based on RLE across all states can be implemented, it can be considered as 65 years where people have at least 14 years or RLE.
The gender differentials (in favourable to men) do exist in MOATs in India and all selected states (except Karnataka), where men have lower MOAT than that women. Further, each dimension-based OAT suggests that Indian women become older earlier than men in spite of having a longer life expectancy than men because of early worsening of health conditions. This finding recommends focusing on the gender-sensitive health agenda to push older women up in raise the healthy old-age. Urban people have higher OAT than rural persons which is attributed to differentials in longevity, self-rated health, and cognitive skills. However, better performance in ADL and handgrip strength in the rural population increase their old-age as compared to urban.
The paper finally presents the implications of multi-dimensional measurement of old-age thresholds on population ageing. It concludes that in the Indian scenario with the increase in the old-age from 60 to MOAT, the burden of population ageing may reduce by half with a considerable decrease in old age dependencies in all selected states. A healthy ageing process is essential for successful ageing, as remaining healthy allows older people to continue to be active participants in society. Therefore, an increment in the retirement age based on the comparable OATs may be inevitable in the states where it is lower than the 60s. The analysis takes into account advancements in both health and survival at older ages and confirms the need to adjust prospective measures of ageing by considering the quality of the extra years of life gained.
Acknowledgements
The authors would like to immensely thank Professor Sergei Scherbov for his technical training at the Workshop on “Demographic analysis with applications to aging societies” conducted by International Institute for Applied Systems Analysis (IIASA) in collaboration with College of Population Studies, Chulalongkorn University.
The authors would also like to thank the reviewers for their valuable comments on the article.
Author contributions
SK, DP: Conceptualization, methodology, validation, formal analysis, investigation, writing (original draft preparation). All authors have read and approved the final manuscript.
Funding
This research received no specific grant from any funding agency in the public, commercial, or not-for-profit sectors.
Conflict of interest
The authors declare that they have no competing interests.
Ethical approval
All the data sources used in the study are publicly available. The authors assert that all procedures contributing to this work comply with the ethical standards of the relevant national and institutional committees on human experimentation and with the Helsinki Declaration of 1975, as revised in 2008.