

1. Introduction
Strong rulers that undermine individual rights to private property are important actors in the explanation that New Institutional Economics (NIE) offers for the persistence of inefficient political and economic arrangements in Ancien Régime Europe.Footnote 1 In a seminal paper, North and Weingast (Reference North and Weingast1989) argue that the Glorious Revolution of 1688 enabled the English monarch to make a credible commitment to responsible fiscal policies. Most important, parliament gained a regular constitutional right to monitor how the ruler spent tax revenues. The authors claim that, by tying its hands, the crown was able to borrow much larger sums than before. There is now a large empirical literature that investigates the relationship between executive predation and economic development in Europe over the long run.Footnote 2
One may suppose that absolutism and undivided authority went hand-in-hand. Epstein (Reference Epstein2000), however, argues that internal fragmentation rather than executive abuse was the principal cause of fiscal distortions within Ancien Régime polities.Footnote 3 Prior to the 1800s, there was a close relationship between local tax control and political autonomy. Thus, elites had strong incentives to oppose structural reforms that threatened traditional rights. The result was a classic public goods problem, since each locality wished to free ride on the tax contributions of others. Dincecco (Reference Dincecco2009a) finds that per-capita revenues collected by fragmented sovereignties remained low. Centralized from medieval times, England – the example par excellence that North and Weingast offer – was exceptional.Footnote 4
It is tempting to portray the arguments for predation and fragmentation as an ‘either–or’ horserace that pits one against the other. This approach, however, ignores the fundamental relationship between the two. Absolutist monarchs often found themselves locked in a vicious circle. Though rulers spent revenues as they wished, elites (e.g., nobles, clergy, or residents of certain towns or regions) typically exercised tax authority. As Hoffman and Rosenthal (Reference Hoffman, Rosenthal, Drobak and Nye1997a, Reference Hoffman and Rosenthalb) describe, assemblies (e.g., the French sovereign law courts or the Castilian Cortes) brought together individuals from particular provinces or social groups. Assemblies were not national institutions, but they did constrain taxation in certain parts of the economy. Parliamentary governments, in contrast, were typically able to raise greater funds by unifying fiscal systems under the control of national representative bodies. However, there was always the danger that executives would waste additional revenues on ill-advised wars. Since elites demanded limits as a precondition to provide new funds, rulers resorted to fiscal predation, including the imposition of high marginal tax rates that stifled transactions in the economic sectors under their control. Yet misbehavior only reinforced the notion that executives could not be trusted. In turn, elites resisted tax requests and the amount of resources available to rulers remained low.Footnote 5 Hoffman and Rosenthal claim that the transition to parliamentary government took place after 1800 due to an important shift in the nature of warfare that increased the penalties for defeated leaders.
The present work forms part of a larger research project by Dincecco (Reference Dincecco2009a, Reference Dinceccob, Reference Dincecco2010) that investigates the negative effects of predation and fragmentation, which increased both the costs of revenue-gathering and the deadweight losses associated with inefficient taxation. I adopt a systematic approach that examines changes in divided authority over time. The use of quantitative, cross-country methods is a natural complement to qualitative, case-oriented accounts such as those of Epstein (Reference Epstein2000), who relies upon medieval Italy. Moreover, the chosen period, 1700 to 1871, captures the historical crossroads that occurred with the end of the Ancien Régime.
An ideal test of fragmentation would be to measure the size of fiscal zones within polities and mark institutional changes one by one as they occurred over the eighteenth and nineteenth centuries. However, data that are comprehensive enough to perform such a study do not exist. Given the dearth of systematic information available prior to the 1800s, any alternative variable must not only be viable, but should also provide a succinct measure of divided authority that is comparable across countries.
Internal customs borders are one unique source of data that satisfy both conditions. Domestic tariffs, in the words of Adam Smith, obstructed the most important branch of commerce, the interior trade of a country.Footnote 6 Such barriers gave rise to at least three problems. First, they seriously hampered legitimate domestic exchange. Major rivers and roads typically crossed multiple frontiers where time holdups occurred and tariffs had to be paid. Second, they encouraged black market traffic. Third, customs administration was expensive and prone to inefficiency. The total effect of internal barriers, as Epstein (Reference Epstein2000) argues, was to impose costs, delays, and risks that atomized domestic economies and restricted economic growth.Footnote 7
Seventeenth-century France provides a useful illustration. According to Nye (Reference Nye2007: 56–57), a mass of customs did great harm to the domestic economy, particularly for commodities with low or medium value-to-weight ratios, such as wine. Furthermore, by solving coordination failures among small tax farmers, replacement of the complicated tariff system with a uniform excise would have significantly improved royal finances. Johnson (Reference Johnson2006) shows that 1660s reforms by Finance Minister Colbert, who simplified internal customs and consolidated the tax farm system, led to a notable increase in government revenues. Total overhaul, however, proved impossible. Colbert's ultimate ‘success’ was to carve France into eight distinct tariff areas: two Effectively Foreign zones, the Five Great Farms, and five Reputedly Foreign zones. Moreover, local excises still remained, including at least five within the Five Great Farms itself. Internal customs barriers were not eliminated until the French Revolution (1789–1799).Footnote 8
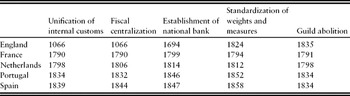
Domestic tariffs, moreover, were part of a larger problem of fragmented sovereignty. Regions typically had distinct political and economic institutions, including local customs, tax systems, weights and measures, and monopolist guilds. Though centralization was a centuries-long process, it remained largely unfinished through most of the 1700s. Profound changes often occurred during French Revolutionary and Napoleonic times.Footnote 9 In many places, therefore, centralization is identifiable as a structural shift that occurred from 1789 to 1815. Table 1 indicates that the unification of domestic customs, the establishment of national tax systems and central banks, the standardization of weights and measures, and the abolition of guilds generally occurred from this point onwards. As noted, a key exception was England, which experienced tariff unification and fiscal centralization during medieval times.
Institutional centralization in Europe west of the Rhine

Notes: Unification of internal customs occurred when the final major internal customs barrier was eliminated. See the text. Fiscal centralization was completed the year that the national government first secured its revenues through a tax system with uniform rates throughout the country. See Dincecco (Reference Dincecco2009a). Establishment of a national bank, standardization of weights and measures, and guild abolition occurred when forcible acts of legislation were passed. See Black (Reference Black1984), Kula (Reference Kula1986), Hickson and Thompson (Reference Hickson and Thompson1991), and Epstein (Reference Epstein1998).
Sources: For internal customs, see the text. For fiscal centralization, see Dincecco (Reference Dincecco2009a). England: Zupko (Reference Zupko1977: 95–97), Daunton (Reference Daunton1995: 343), and Epstein (Reference Epstein1998: 706); France: Kula (Reference Kula1986: 240, 255, 263), Price (Reference Price1993: 130), and Epstein (Reference Epstein1998: 706); Netherlands: Griffiths (Reference Griffiths1982: 515–517) and Jonker (Reference Jonker, t'Hart, Jonker and Van Zanden1997: 95); Portugal: Burdun (Reference Burdun1968: 1147–1151) and Mata and Valério (Reference Mata and Valério2002); Spain: Vicens Vive (Reference Vicens Vive1969: 692, 726) and Tortella (Reference Tortella2000: 130–131).
For tractability, my analysis concentrates on major internal customs, which suggests that some of the smaller steps towards centralization were missed. Though at least five local tariffs remained within the Five Great Farms in France after the 1660s, for instance, I nevertheless recorded it as a unified zone. Systematic underestimates of the true extent of divided authority bias against fragmentation. Thus, any results that still indicate the presence of divided authority prior to 1800 will be stronger than otherwise.
Territories to the west of the Rhine River, which comprises the eastern border of France, were generally more stable than those to its east, where sovereign borders changed considerably over time. Since I am primarily interested in internal fragmentation rather than growth in state size, my analysis focuses on the former group. For robustness, I measure domestic customs zones in two ways: physical size and urban population. Both methods use 175 sample cities as described by De Vries (Reference De Vries1984) in England, France, the Netherlands, and Spain as the basic unit of account. These countries are also among the most discussed in the literature on state formation.
Since territories east of the Rhine were unstable, analysis of them becomes more difficult, because there is the risk of conflating the effects of internal and external forms of fragmentation. This difficulty is compounded by a lack of available data regarding the existence and magnitude of customs borders within historical states, particularly before the 1800s. For those reasons, such polities were excluded from the primary investigation. For completeness, however, I perform the analysis by physical size for states east of the Rhine from 1815 onwards, though the emphasis is on external (versus internal) fragmentation. The inclusion of Eastern territories fills out the analysis by accounting for a broader swath of Europe. It also extends the sample time period through the latter part of the 1800s and thereby documents a longer period of institutional change. The method uses 117 sample cities (also from De Vries, Reference De Vries1984) in the German and Italian territories as the basic unit of account.
The results indicate that customs zones west of the Rhine were small prior to the French Revolution but grew dramatically from 1789 onwards. They thus provide systematic evidence of divided authority in Ancien Régime Europe. The findings strengthen the foundations of Dincecco (Reference Dincecco2009a, Reference Dinceccob, Reference Dincecco2010), who links structural reforms such as fiscal centralization to improvements in public finances. The results also suggest that, after 1800, divided authority within states was no longer the most pressing sort of fragmentation. East of the Rhine, a remarkable degree of external consolidation between states occurred over the nineteenth century.
The paper proceeds as follows. Section 2 surveys the political geography of Europe at the start of the sample period. After describing the techniques used in Section 3, I perform the quantitative analysis in Section 4. To study the effects of centralization on public finances, Section 5 takes a detailed look at France. I conclude with a summary of the main findings and their implications for future research.
2. Political geography
An overview of eighteenth- and nineteenth-century political geography suggests a simple way to divide up Continental Europe. Sovereign boundaries for territories west of the Rhine River were put in place by the 1600s and remained relatively stable thereafter. Modern France (543,965 sq. km) inherited the territorial borders set under Louis XI during the fifteenth century. Net growth in physical size from 1700 to 1815 was small. Though France took over Belgium and the Netherlands in 1795, they became independent by the end of the Napoleonic era. Since I am interested in changes in divided authority in 1815 relative to 1700, this set of events did not significantly affect my analysis. The Dutch Republic, which officially declared independence from Spain in 1581, corresponds with the modern Netherlands (33,873 sq. km). The Spanish kingdoms of Aragon and Castile were united in 1497. Conquest of much of the Basque Provinces gave Spain (498,434 sq. km) its modern borders by 1512. Hence, customs fragmentation for polities west of the Rhine was typically the result of internal rather than external divisions.Footnote 10
Two exceptions bear mention. Until French conquest in 1795, internal customs barriers plagued the territory that corresponds with present-day Belgium. In 1830, Belgium – then part of the Kingdom of the United Netherlands, established at the Napoleonic era's end – declared its sovereignty. Belgium became an independent country in 1831.Footnote 11 Since it did not exist as a sovereign nation during the period of interest, Belgium is not included in my sample. I focused instead on France and the Netherlands, its larger and more important neighbors.
After 60 years of Spanish rule, Portugal obtained its independence in 1640. Though free of major internal customs by the 1500s, local Portuguese districts continued to levy French-style octrois upon goods entering city limits. They also imposed local market taxes that discriminated against traders from elsewhere. As in Spain, attempts by Napoleon to introduce economic and political reforms failed. Comprehensive changes such as uniform tariffs did not occur in Portugal until the 1830s.Footnote 12Table 1 shows a close relationship in centralization dates among the Iberian countries. I thus took Spain, the larger and more important player, as the Iberian representative for the quantitative tests that follow.
In territories east of the Rhine, sovereign borders changed considerably over time. Through the nineteenth century, both ‘Germany’ and ‘Italy’ were geographical rather than political expressions. There were over 300 rulers within Germania during the 1700s. On the Italian Peninsula, there were also many sovereign polities prior to 1800: the Duchies of Massa and Carrara, Modena, Parma, and Tuscany; the Kingdoms of Lombardy, Naples, Piedmont, Sardinia, and Sicily; the Papal States; and the Republics of Genoa, Lucca, and Venice. In this regard, fragmentation was a matter of external divisions to be solved through state consolidation. By the end of the Napoleonic era, the amount of German polities was reduced nearly eight-fold and the amount of Italian ones by one-half. Though it did not become a single political entity until 1871, customs unification in Germania occurred with a series of sovereign tariff agreements from 1815 onwards, which Section 3 describes. On the Italian Peninsula, customs unification followed the establishment of the (unified) Kingdom of Italy in 1861.
Internal tariffs in the German and Italian territories were also widespread. In 1790, there were some 1,800 customs borders within and between German polities. Bavaria alone had over 400 customs houses during the eighteenth century, and Prussia levied over 60 different types of customs and excise taxes. On the Italian Peninsula, one telling example concerns Piedmont, where the king ruled over a wide array of counties (Nice), duchies (Savoy, Aosta, Saluzzo, and Monferrat), principalities (Oneglia and Piedmont), and kingdoms (Sardinia), each with its own distinct set of economic institutions.Footnote 13
The German and Italian cases both displayed significant internal and external fragmentation. My principal task, however, was to trace divided authority within polities rather than between them. To produce meaningful measures, it was important to use states with stable borders over the entire time period. Hence, as a way to avoid conflating the two types of fragmentation (data limitations aside), I restricted the primary investigation to countries west of the Rhine. To round out the analysis, I also tested state consolidation in the German and Italian territories over the 1800s.
Across the English Channel, we must distinguish between English institutions and those for the British Isles as a whole. Customs unification in England occurred during medieval times. The Norman Conquest (1066), which undercut the authority of provincial lords, made a significant contribution to the establishment of uniform rule. I thus dated centralization to that year. England conjoined with Wales in 1536. Though the Scottish and English crowns were united in 1603, it was not until the 1707 Act of Union that the internal tariff border that separated the two was eliminated. A similar Act of Union conjoined Ireland in 1800.Footnote 14 As mentioned, net gains in physical size for countries like France were small from 1700 to 1815. Growth in the size of the British state, however, was not only large, but permanent. My primary analysis concerned divided authority within polities rather than sovereign consolidation. To avoid confounding the effects of internal and external fragmentation, I restricted my investigation to England including Wales (151,201 sq. km). Note that the use of Britain (England, Scotland, and Wales), which was already established and was free of internal customs by the start of the 1700s, generated the same sorts of results as the use of England itself.
3. Data and methods
Internal fragmentation west of the Rhine, 1700–1815
My ‘West of the Rhine’ sample consisted of all 175 cities in England, France, the Netherlands, and Spain with at least 10,000 inhabitants in 1800 from Appendix 1 of De Vries (Reference De Vries1984). Each polity was well-represented: there were 44 English, 19 Dutch, 78 French, and 34 Spanish sample cities. Since the investigation centered on the Continent, where rapid urbanization did not begin until the nineteenth century (see Hohenberg and Lees, Reference Hohenberg and Lees1985), the use of 1800 as the base year mitigated any potential problems of sample bias.
Though it would be useful to evaluate the economic impact of differences in marginal tax rates across customs zones, systematic information did not exist. Data for physical sizes and urban populations, however, were available. To ensure that my results were not contingent upon a particular approach, I employed both measures. The first method estimated the size of the regions in square kilometers within which goods from sample cities could travel duty-free. Historical accounts were used to determine major internal customs borders for each country. Since the analysis concerns centralization within European polities themselves, I only considered domestic sovereign areas.Footnote 15
The French case illustrates. Online Appendix 1 documents the details for the Netherlands and Spain.Footnote 16 To reconstruct Ancien Régime customs zones, I made use of France's 95 present-day departments. The department map with areas in square kilometers was from Martins et al. (Reference Martins, Gay and Blanc2008). The map of internal customs areas after Colbert's 1660s reforms was from Jackson (Reference Jackson1974). To establish customs zones at the start of the 1700s, I superimposed Jackson's (Reference Jackson1974) historical map on the present-day one of Martins et al. (Reference Martins, Gay and Blanc2008):
Effectively Foreign 1. Present-day departments of Ardennes, Moselle, Meuse, Meurthe et Moselle, Bas Rhin, Haute Rhin, Vosges.
Effectively Foreign 2. Present-day department of Vacluse.
Five Great Farms. Present-day provinces of Ain, Aisne, Allier, Aube, Calvados, Cher, Cote d'Or, Eure, Eure et Loir, Indre, Indre et Loire, Loir et Cher, Loiret, Maine et Loire, Manche, Marne, Haute Marne, Mayenne, Nievre, Oise, Orne, Saone et Loire, Sarthe, Haute Savoie, Paris, Seine Maritime, Seine et Marne, Yvelines, Deux Sevres, Somme, Vendee, Vienne, Yonne, Essonne, Hauts de Seine, Seine Saint Denis, Val de Marne, Val d'Oise.
Reputedly Foreign 1A.Footnote 17 Present-day departments of Alpes de Haute Provence, Bouches du Rhone, Hautes Alpes, Var.
Reputedly Foreign 1B. Present-day departments of Ardeche, Ariege, Aude, Aveyron, Gard, Haute Garonne, Herault, Lozere.
Reputedly Foreign 1C. Present-day departments of Cantal, Dordogne, Gers, Gironde, Hautes Pyrenees, Landes, Loire, Lot, Lot et Garonne, Pyrenees Atlantiques, Pyrenees Orientales, Tarn, Tarn et Garonne.
Reputedly Foreign 1D. Present-day departments of Drome, Haute Loire, Isere, Rhone.
Reputedly Foreign 1E. Present-day departments of Charente, Charente Maritime, Correze, Creuse, Puy de Dome, Haute Vienne.
Reputedly Foreign 2. Present-day departments of Nord, Pas de Calais.
Reputedly Foreign 3. Present-day departments of Doubs, Jura, Haute Saone, Territoire de Belfort.
Reputedly Foreign 4. Present-day departments of Cotes d'Armor, Finistere, Ille et Vilaine, Loire Atlantique, Moribihan.
Reputedly Foreign 5. Present-day departments of Corse du Sud, Haute Corse.
Changes (if any) in internal tariff borders were used to calculate the area of the customs zone that surrounded each sample city at different points in time. Online Appendix 2 provides the details. The chosen breaks were 1700, 1750, 1788 (just prior to the French Revolution), and 1815 (marking the end of the Napoleonic era). The unification of domestic customs occurred when the final internal barrier was eliminated. To compare internal fragmentation levels across countries of different physical sizes, customs zones were calculated as percentages of total sovereign area.
To illustrate, I refer to the ‘Effectively Foreign 1’ customs zone in Ancien Régime France. The zone (comprised of the present-day French departments of Ardennes, Moselle, Meuse, Meurthe et Moselle, Bas Rhin, Haute Rhin, and Vosges) was roughly 37,000 sq. km in area. Each of the four sample cities located within it – Colmar, Metz, Nancy, and Strasbourg – was thus assigned this value. After 1789, when major internal customs were eliminated, goods from the four cities could travel duty-free throughout the whole of France. Colmar, Metz, Nancy, and Strasbourg thereby each took the value of 544,000 sq. km – equivalent to total French sovereign area – at the next kept interval in 1815.
It is difficult to calculate sub-national population totals within European countries over the 1700s. De Vries (Reference De Vries1984), however, provides urban populations at 50-year intervals. The second method added the populations of all sample cities contained within each customs zone in 1700, 1750, and 1800. These sums were then divided by total urban populations among sample cities within each country. Online Appendix 3 describes the details. This technique produces reasonable estimates so long as we assume that internal tariffs had the largest effect on urban merchants, since rural populations typically produced subsistence goods.
As an example, I again refer to the French ‘Effectively Foreign 1’ customs zone. In 1750, the population sum for the four cities located within this zone (Colmar, Metz, Nancy, and Strasbourg) was 91,000. The urban population among all sample cities that year was 1,992,000. Simple division indicates that the number of urban residents within the ‘Effectively Foreign 1’ zone was roughly 5 percent of the total urban population. After 1789, when major internal customs were eliminated, there was no longer a difference between the number of urban inhabitants within French customs zones and the total urban population in France.
External fragmentation east of the Rhine, 1815–1871
My ‘East of the Rhine’ sample consisted of all 117 cities in the German and Italian territories with at least 10,000 inhabitants in 1800 from Appendix 1 of De Vries (Reference De Vries1984). There were 46 German and 71 Italian sample cities. I estimated the size of the regions in square kilometers within which goods from sample cities could travel duty-free. Historical accounts were used to determine major sovereign (i.e., external) customs borders between states in the German and Italian territories, respectively.Footnote 18
The German case illustrates. Online Appendix 1 documents the details for the Italian Peninsula. There were 38 German states in 1815. Three separate customs unions were established in Germania in 1828: the Prussia-Hesse-Darmstadt Customs Union towards the east and west, the Middle German Commercial Union towards the center, and the Bavaria-Wurttemberg Customs Union towards the south. Though the first Zollverein Customs Union of 1834 quickly eclipsed the previous set of accords, holdouts remained. These included the Hanse towns (Bremen, Hamburg, and Lubeck), Holstein, Schleswig, the two Mecklenburgs, and the Tax Union (Brunswick, Hanover, and Oldenburg) to the north and Baden, Frankfurt-am-Main, and Nassau to the south. I counted the Tax Union, originally formed in 1835, as a separate customs union. The new Zollverein, established in 1867 (and shortly thereafter), completed the unification of German customs. By the time of German political unification in 1871, economic unification in Germany was virtually accomplished.Footnote 19
To reconstruct customs zones between German states, I made use of Germany's 16 present-day states. The state map with areas in square kilometers was from Sensen and Martins (Reference Sensen and Martins2006a). The historical maps of German states in 1815 and customs unions from 1815 to 1871 were from Henderson (Reference Henderson1939), who notes that even Germans themselves were confused about external borders at the start of the 1800s. For instance, there were five different sovereign states within miles of the free city of Frankfurt-am-Main (see page 9). For tractability, I focused on the geographical area that corresponded (largely) with German borders in 1871 according to Sensen and Martins (Reference Sensen and Martins2006b), which also overlapped (largely) with present-day German borders.Footnote 20 I thus excluded five historical provinces found (largely) in the present-day Czech Republic, Poland, and Russia.Footnote 21 To establish customs zones in 1815, I superimposed Henderson's historical map on Sensen and Martins’ present-day one. Though simple, this delineation captured the major divisions between German states in the aftermath of the Napoleonic Wars:
Free City of Bremen. Present-day state of Bremen.
Free City of Frankfurt-am-Main. Southern one-fiftieth of present-day state of Hessen.
Hesse-Cassel (Electoral Hesse). Northern forty-nine-one-hundredths of present-day state of Hessen.
Hesse-Darmstadt (Grand Duchy of Hesse). Central forty-nine-one-hundredths of present-day state of Hessen, Southwestern one-tenth of present-day state of Rheinland-Pfalz.
Free City of Hamburg. Present-day state of Hamburg.
Grand Duchy of Baden. Western one-half of present-day state of Baden-Wurttemberg.
Kingdom of Wurttemberg. Eastern one-half of present-day state of Baden-Wurttemberg.
Grand Duchy of Mecklenburg-Schwerin. Western one-half of present-day state of Mecklenburg-Vorpommern.
Mecklenburg-Strelitz. Eastern one-half of present-day state of Mecklenburg-Vorpommern.
Duchy of Brunswick. One-tenth of present-day state of Niedersachsen.
Kingdom of Hanover. Seven-tenths of present-day state of Niedersachsen.
Oldenburg. One-fifth of present-day state of Niedersachsen.
Duchy of Holstein. Southern forty-nine-one-hundredths of present-day state of Schleswig-Holstein.
Duchy of Schleswig. Northern forty-nine-one-hundredths of present-day state of Schleswig-Holstein.
Free City of Lubeck. Southern one-fiftieth of present-day state of Schleswig-Holstein.
Kingdom of Bavaria. Present-day state of Bayern.
Kingdom of Prussia.Footnote 22 Western four-fifths of present-day state of Nordrhein-Westfalen, Western four-fifths of present-day state of Rheinland-Pfalz, Present-day state of Saarland, Eastern one-fifth of present-day state of Thuringen, Present-day states of Berlin, Brandenburg, Sachsen-Anhalt.
Anhalt Duchies of Bernburg, Dessau, Kothen. Central one-fifth of present-day state of Thuringen.
Thuringian States. Surrounding three-fifths of present-day state of Thuringen.
Nassau. Northeastern one-tenth of present-day state of Rheinland-Pfalz.
Kingdom of Saxony. Present-day state of Sachsen.
Changes (if any) in external tariff borders were used to calculate the area of the customs zone that surrounded each sample city at different points in time. Online Appendix 4 provides the details. The chosen breaks were 1815 (marking the end of the Napoleonic era), 1850, and 1871 (marking German unification). The unification of external customs occurred when the final barrier between German (Italian) sovereignties was eliminated.
To illustrate, I refer to the ‘Kingdom of Hanover’ customs zone. The zone (comprised of seven-tenths of the present-day state of Niedersachsen; Brunswick and Oldenburg comprised the remainder) was roughly 33,000 sq. km in area in 1815. Each of the four sample cities located within it – Emden, Hanover, Hildesheim, and Luneburg – was thus assigned this value. The Hanoverian Kingdom was excluded from the 1834 Zollverein but was a founding member of the Tax Union (1835), which was formed as an outgrowth of the failed Middle Union. Hence, Emden, Hanover, Hildesheim, and Luneburg each took the value of 48,000 sq. km, the rough size of the Tax Union, at the next kept interval in 1850. In 1867, the Hanoverian Kingdom was included as part of the new Zollverein. Since goods from the four sample cities could now travel duty-free throughout the German territories, each was assigned the value of 357,000 sq. km – equivalent to the total area of present-day Germany – from that point onwards.
4. Results
Fragmentation prior to the French Revolution
Table 2 indicates that – notwithstanding England, which was centralized from medieval times – there was a remarkable difference west of the Rhine between the size of internal customs zones surrounding sample cities and total sovereign area prior to 1789. The average (median, largest) customs zone in France comprised just 22 (15, 38) percent of total sovereign area. This result lends quantitative heft to claims by Nye (Reference Nye2007) and others that cumbersome tariffs created a virtual autarky between French regions. The average (median, largest) customs zone in the Dutch Republic, fragmented at both the provincial and national levels through 1795, was only 14 (16, 8) percent of total sovereign area. Likewise, this finding provides a quantitative component to Griffith's (Reference Griffiths1982: 514–517) view that internal barriers created isolated economic sub-units in the eighteenth-century Netherlands.Footnote 23 As described, the use of the median or the largest rather than the average customs zones also suggested significant internal fragmentation.
Average internal customs zones as % areas of sovereignty, 1700–1815

Note: For example, in France in 1700 the size of the average customs zone was 22% of total sovereign area.
Sources: See the text and Appendix 2 at http://www.imtlucca.it/whos_at_imt/personal_page.php?n=Mark+Dincecco&p=440.
Spain proved exceptional. The average (median, largest) Spanish customs zone, at 61 (75, 75) percent of total sovereign area in 1700, jumped to 94 (96, 96) percent by 1750 due to the abolition of internal customs by Bourbon reformers in the 1710s. Prior to the eighteenth century, internal customs borders existed between Castile, Aragon, Catalonia, Valencia, and the Basque Country. Basque customs were restored in 1722 and lasted until 1839, when internal tariffs were abolished once and for all.Footnote 24
By nearly all other fragmentation measures, however, Spain was far worse off than the rest of Europe. Recall from Table 1 that fiscal centralization, the establishment of a central bank, the standardization of weights and measures, and the abolition of guilds did not occur until the 1830s or later.Footnote 25 Poor transportation networks also hindered economic development. In 1800, there were nearly 30,000 km of English roads but less than 5,000 km of Spanish ones, though Spain was more than three times as large as England.Footnote 26 The calculations that use internal customs are thus dramatic underestimates of the true extent of fragmentation in Ancien Régime Spain.
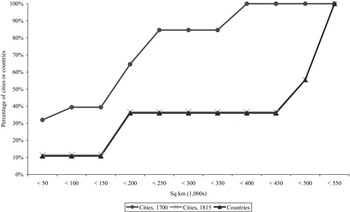
Figure 1, which plots the cumulative distribution of the sizes of internal customs zones for sample cities and countries west of the Rhine in 1700 and 1815, supports the previous results. If there was no internal fragmentation in 1700, then the cities and countries lines would coincide. However, the cities line lies well above the countries line. Over 30 percent of cities, but only about 10 percent of countries, were surrounded by a customs zone of less than 50,000 sq. km. About 40 percent of cities, but just about 10 percent of countries, were surrounded by a customs zone of less than 150,000 sq. km. Finally, over 80 percent of cities, but less than 40 percent of countries, were surrounded by a customs zone smaller than 250,000 sq. km.
Cumulative distribution of internal customs zones west of the Rhine, 1700–1815
Notes: The Cities, 1700 line plots the cumulative distribution of the sizes of customs zones surrounding 175 sample cities in England, France, Netherlands, and Spain. The Cities, 1815 line does the same for cities in 1815. The Countries line plots the cumulative distribution of the domestic areas of England, France, the Netherlands, and Spain, which encapsulate the city customs zones. It remained the same for both 1700 and 1815, since there were few significant net changes in the sovereign areas of these polities over this period.
Sources: See the text and Appendix 2 at http://www.imtlucca.it/whos_at_imt/personal_page.php?n=Mark+Dincecco&p=440.

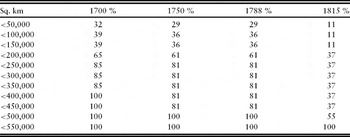
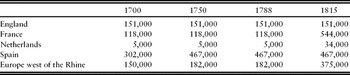
Other measures also suggest that internal customs zones were small prior to 1789. Table 3 indicates that over one-quarter of sample cities west of the Rhine were surrounded by a customs zone of less than 50,000 sq. km, that over 60 percent of cities were surrounded by a customs zone of less than 200,000 sq. km, and that more than 80 percent of cities were surrounded by a customs zone of less than 250,000 sq. km. Furthermore, Table 4 indicates that the average customs zone in 1788 was just 180,000 sq. km. Comparison of France and England is particularly noteworthy, since the average pre-1789 French customs zone (118,000 sq. km) was over 30,000 sq. km less than that of England (151,000 sq. km), the only sample territory free of internal tariffs. If France had been centralized, then its free customs area would have been more than three and one-half times as large as that of its English counterpart.
Cumulative % of sample cities surrounded by internal customs zones of various sizes, 1700–1815

Notes: 175 cities with at least 10,000 inhabitants in 1800 in England, France, the Netherlands, and Spain were included. In 1700, for example, 32% of sample cities were surrounded by a customs zone of less than 50,000 sq. km.
Sources: See the text and Appendix 2 at http://www.imtlucca.it/whos_at_imt/personal_page.php?n=Mark+Dincecco&p=440.
Average sizes of internal customs zones in sq. km, 1700–1815

Note: For example, in France in 1700 the average customs zone was 118,000 sq. km in size.
Sources: See the text and Appendix 2 at http://www.imtlucca.it/whos_at_imt/personal_page.php?n=Mark+Dincecco&p=440.
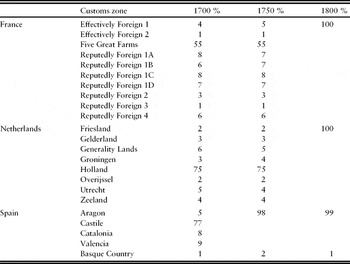
Table 5, which displays the results of the calculations for urban populations within customs zones west of the Rhine as percentages of total urban populations over time, also indicates that internal free trade areas were fragmented prior to 1789. The number of urban residents within customs zones was typically less than 10 percent of total urban populations. Exceptions included the Five Great Farms in France, where urban inhabitants made up 55 percent of the total, and the Dutch province of Holland, where they were 75 percent. However, at least five local customs remained within the Five Great Farms after Colbert's 1660s reforms. By restricting my analysis to major internal borders, the French calculations systematically underestimate the true extent of divided authority. The same logic holds for the Dutch Republic, where cities, towns, and provinces were largely autonomous (see Van Zanden and Van Riel, Reference Van Zanden and Van Riel2004: 32–40). In Spain, urban residents of the kingdom of Castile comprised 77 percent of the total urban population in 1700 and 98 percent by 1750. As described, however, the use of internal customs strongly underestimates Spanish fragmentation over the eighteenth century.
Urban populations within internal customs zones as % of total urban populations, 1700–1800

Notes: 175 cities with at least 10,000 inhabitants in 1800 in England, France, the Netherlands, and Spain were included. In 1750, for example, 5% of the total urban population among sample cities in France was in the customs zone called ‘Effectively Foreign 1’. French internal customs were unified during the Revolution (1789–1799).
Sources: See the text and Appendix 3 at http://www.imtlucca.it/whos_at_imt/personal_page.php?n=Mark+Dincecco&p=440.
Centralization during and after the French Revolution
Whether measured in terms of physical area or urban population, there was a significant increase in the size of internal customs zones west of the Rhine from 1789 onwards. The Revolution eliminated internal customs within France.Footnote 27 In the Netherlands, customs unification occurred after French conquest in 1795. Table 2 indicates that domestic customs zones and total sovereign area coincided in both countries by 1815. Table 5, moreover, suggests a one-to-one correspondence between urban populations within customs zones and urban population totals by the start of the 1800s. Figure 1 also indicates significant growth in the size of internal customs zones over this period. By 1815, the cities and countries lines overlapped. Since the cities line moved greatly from 1700 onwards but the countries line remained unchanged, growth in customs zones was the result of centralization within sample countries rather than sovereign increases in size.
Tables 3 and 4 suggest that internal customs unification west of the Rhine occurred with the French Revolution and Napoleon. Neither the cumulative percentage of cities surrounded by customs zones of various sizes (Table 3) nor the average size of customs zones in Europe (Table 4) changed much from 1700 to 1788. Table 3 indicates, however, that customs zones grew quickly over the next two and one-half decades. Only about 10 percent of cities were surrounded by a customs zone of 50,000 sq. km or less in 1815, whereas in 1788 nearly 30 percent of cities were surrounded by one of that size. Less than 40 percent of cities were surrounded by a customs zone smaller than 450,000 sq. km in 1815, whereas in 1788 this figure was over 80 percent. Likewise, Table 4 shows that the average customs zone in Europe west of the Rhine more than doubled in size from 182,000 sq. km in 1788 to 375,000 sq. km in 1815.Footnote 28
State consolidation over the nineteenth century
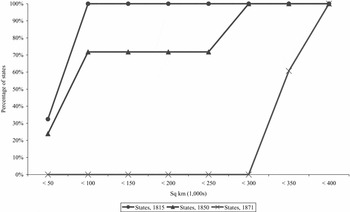
Figure 2, which displays the cumulative distribution of the sizes of external customs zones in the German and Italian territories in 1815, 1850, and 1871, respectively, indicates a remarkable degree of institutional consolidation between states east of the Rhine over the nineteenth century. At the start of the 1800s, over 30 percent of sample cities were surrounded by customs zones of 50,000 sq. km or less, and a full 100 percent were surrounded by customs zones of 100,000 sq. km or less. The largest states were the Kingdom of Prussia in Germania and the Kingdom of the Two Sicilies on the Italian Peninsula, each at just under 100,000 sq. km.
Cumulative distribution of external customs zones in the German and Italian territories, 1815–1871
Notes: The States lines plot the cumulative distribution of the sizes of external customs zones surrounding 117 sample cities in the German and Italian territories in 1815, 1850, and 1871, respectively.
Sources: See the text and Appendix 4 at http://www.imtlucca.it/whos_at_imt/personal_page.php?n=Mark+Dincecco&p=440.

There was a dramatic increase in the size of external customs zones by the next kept interval in 1850. As a result of the 1834 Zollverein, over 70 percent of sample cities were surrounded by customs zones of over 250,000 sq. km. However, almost one-quarter of sample cities remained surrounded by customs zones of 50,000 sq. km or less. On the Italian Peninsula, economic and political unification occurred at the start of the 1860s. In 1867, a new Zollverein was implemented. By the time of German unification in 1871, 100 percent of German (Italian) sample cities were surrounded by customs zones equivalent to the size of present-day Germany at 357,022 sq. km (Italy at 301,338 sq. km).Footnote 29
Thus, institutional consolidation between states east of the Rhine was dramatic over the nineteenth century. The average customs zone in the German territories increased nearly seven-fold, from 52,000 sq. km in 1815 to 357,000 sq. km in 1871. On the Italian Peninsula, this increase was more than four-fold, from 68,000 sq. km in 1815 to 301,000 sq. km by the 1860s. External customs, which were so fragmented at the start of the 1800s, were eliminated well before its close.Footnote 30
5. Implications: French public finances before and after the Revolution of 1789
The main findings provide strong quantitative evidence of divided authority in Ancien Régime Europe. This section relates the impact of centralization reforms to improvements in public finances. I focus on France for two reasons. First, it is well-documented case. Second, as Table 1 describes, there was a large structural shift in the nature of French institutions after 1789. In particular, the elimination of internal customs (my measure of divided authority) and the establishment of a national tax system with uniform rates throughout France (the measure of fiscal centralization from Dincecco, Reference Dincecco2009a) occurred concurrently during the 1790s.
Fiscal centralization in France was a centuries-long process.Footnote 31 Fragmentation, however, remained severe through most of the 1700s. Indeed, one key grievance on the eve of the French Revolution was the bewildering variety of taxes imposed at disparate local rates. In 1790, the National Assembly transformed the tax system in France by eliminating traditional exemptions and privileges. Napoleon completed this process after his coup in 1799.Footnote 32
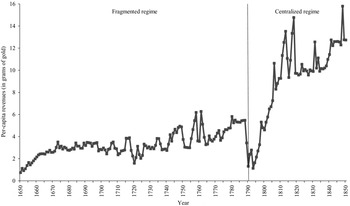
The evidence suggests that undivided authority helped the French national government to resolve the Ancien Régime problem of local tax free riding. Figure 3, which plots annual per-capita revenues over political regimes in France from 1650 to 1850 from Dincecco (Reference Dincecco2009a), indicates that revenues remained low at less than six grams of gold per head under the fragmented regime that lasted through the 1780s. As described, the French Revolution led to the establishment of a national tax system. Coinciding in time with the Revolutionary and Napoleonic wars, we observe a sharp increase in revenues through 1815, which nearly doubled to approximately ten grams of gold per capita. Over the next two decades, French revenues leveled out, but never fell. Revenues again began to increase in the 1840s – albeit at a slower rate than during Napoleonic times – to about 14 grams of gold per head by 1850.

This large increase in per-capita revenues enabled the national government to follow better fiscal policies.Footnote 33 From 1700 to 1788, France defaulted three times.Footnote 34 Furthermore, Bordo and White (Reference Bordo and White1991) argue that the Revolution's use of confiscation, capital levies, and an inflation tax cost the government its reputation to repay debts. By 1797, France was forced to reduce the value of its interest payments by two-thirds. The authors claim that structural reforms like fiscal centralization allowed Napoleon to gather enough in new revenues to fund military efforts without large-scale borrowing. Unlike the 1700s, France no longer defaulted over the nineteenth century.Footnote 35
6. Conclusion
This paper performs a systematic analysis that examines institutional fragmentation in terms of internal customs within European polities west of the Rhine (1700–1815) and external customs between polities east of the Rhine (1815–1871). The principle results indicate that internal customs zones west of the Rhine were small prior to the French Revolution but grew dramatically from 1789 onwards. They thus provide definitive evidence of divided authority in Ancien Régime Europe. The findings also indicate a remarkable degree of institutional consolidation between states east of the Rhine over the nineteenth century.
The main results suggest one way in which the ‘vicious circle’ problem of rulers was resolved. By helping to secure stable and sufficient revenues, undivided tax authority reduced the need of executives to undermine property rights and implement distortionary marginal taxes in search of new funds. Better behavior also made rulers more trustworthy. The findings strengthen the foundations of Dincecco (Reference Dincecco2009a, Reference Dinceccob, Reference Dincecco2010), who links structural reforms such as fiscal centralization to improvements in public finances.
Now that systematic evidence has been established, future work should examine the economic implications of internal fragmentation in rigorous detail. One useful investigation would be a quantitative assessment of pre- and post-Unification fiscal policies in 1860s Italy. In turn, the precise effects of centralization on government finances will become clearer.