Colostrum is the first milk obtained following parturition that provides various nutrients, energy and other factors that may provide regulative function (cytokines, growth factors, enzymes, and hormones), thus promoting morphological and functional development of calves (Blum & Hammon, Reference Blum and Hammon2000). Moreover, the immunoglobulin (Ig) supply from colostrum is especially important for calf health (Weaver et al. Reference Weaver, Tyler, VanMetre, Hostetler and Barrington2000) and new-borns of other ruminant species (Moreno-Indias et al. Reference Moreno-Indias, Sanchez-Macias, Castro, Moralez-delaNuez, Hernandez-Castellano, Capote and Arguello2012). IgG is the major Ig in ruminant circulation and consists of 3 subclasses: IgG1 IgG2, IgG3 (Farrell et al. Reference Farrell, Jimenez-Flores, Bleck, Brown, Butler, Creamer, Hicks, Hollar, Ng-Kwai-Hang and Swaisgood2004), but no information on colostrum IgG3 is available. In serum IgG1 and IgG2 concentrations are similar (5–12 mg/ml; Butler et al. Reference Butler, Kiddy, Pierce and Rock1972; Sasaki et al. Reference Sasaki, Larson and Nelson1977; Larson et al. Reference Larson, Heary and Devery1980), but in colostrum IgG1 concentration is about 10 times higher (Sordillo et al. Reference Sordillo, Nickerson, Akers and Oliver1987, Reference Sordillo, Shafer-Weaver and DeRosa1997), while IgG2 concentration remains below that of the blood (Brandon et al. Reference Brandon, Watson and Lascelles1971; Butler, Reference Butler and Larson1974; Herr et al. Reference Herr, Bostedt and Failing2011). Larson et al. (Reference Larson, Heary and Devery1980) showed the specific transfer of blood Ig into colostrum during colostrogenesis is mainly restricted to immunoglobulin G1 (IgG1). Numerous studies showed that the colostrum IgG1 concentration is extremely variable among cows (Kehoe et al. Reference Kehoe, Jayarao and Heinrichs2007; Gulliksen et al. Reference Gulliksen, Lie, Solverod and Osteras2008; Baumrucker et al. Reference Baumrucker, Burkett, Magliaro-Macrina and Dechow2010; Morrill et al. Reference Morrill, Conrad, Lago, Campbell, Quigley and Tyler2012), but also in sows (Quesnel, Reference Quesnel2011) and in other small ruminants (Lerias et al. Reference Lerias, Hernandez-Castellano, Suarez-Trujillo, Castro, Pourlis and Almeida2014). In cows, quarter variation of IgG is also significant (Baumrucker et al. Reference Baumrucker, Stark, Wellnitz, Dechow and Bruckmaier2014) and explains some of the variation occurring in colostral IgG1 concentration.
Studies with rodents have identified the Fc Receptor of the neonate (FcRn) as the main component of the intestinal tract that is responsible for the translocation of intestinal IgG to the blood. Bovine FcRn (bFcRn) has been shown to be present in the mammary gland and is regulated in vitro by endocrine factors (Stark et al. Reference Stark, Vachkova, Wellnitz, Bruckmaier and Baumrucker2013). Recently, the FcRn has been shown to bind albumin (Anderson et al. Reference Anderson, Chaudhury, Kim, Bronson, Wani and Mohanty2006) at a separate and non-competitive site than that of IgG1 (Chaudhury et al. Reference Chaudhury, Mehnaz, Robinson, Hayton, Pearl, Roopenian and Anderson2003, Reference Chaudhury, Brooks, Carter, Robinson and Anderson2006). The FcRn recycling mechanism (Kim et al. Reference Kim, Bronson, Hayton, Radmacher, Roopenian, Robinson and Anderson2006) explains the long half-life of blood albumin and IgG1.
The appearance of BSA in colostrum has been described (Guidry et al. Reference Guidry, Butler, Pearson and Weinland1980; Levieux & Ollier, Reference Levieux and Ollier1999) and is high in concentration in first milked colostrum (1·21 ± 0·44 mg/ml) when compared to reported mature milk levels of <0·2 mg/ml in uninfected mammary glands (Poutrel et al. Reference Poutrel, Caffin and Rainard1983). Infection of the mammary gland during established lactation is known to alter the blood/mammary gland barrier and to increase the appearance of several blood components in milk (Bannerman & Goldblum, Reference Bannerman and Goldblum1999; Bannerman et al. Reference Bannerman, Chockalingam, Paape and Hope2005). As IgG1 concentration shows a wide quarter variation within and between cows, quarter variation in BSA has been suggested (Baumrucker & Bruckmaier, Reference Baumrucker and Bruckmaier2014). We hypothesised that BSA would vary in concentration and mass among udder quarters within a cow and be closely correlated with IgG1 concentration. The objective of the present study was to establish the correlation between the dairy cow colostrum components (IgG1, IgG2, and BSA). Because L-lactate dehydrogenase activity (LDH) is thought to be a marker of blood/mammary gland barrier integrity, we also set an objective to determine LDH correlations with the other measured proteins. An understanding of the relationship among these proteins may provide a better understanding of their mechanisms of appearance in colostrum.
Materials and methods
Dairy cows and colostrum sample collection
The animal experiment was approved by the Veterinary Office of the Canton Fribourg, Switzerland. Colostrum samples were collected from 31 multiparous (mean parity 2·8 ± 0·9; range 2–6) Holstein Friesian and Swiss Fleckvieh dairy cows held at the Agroscope Institute for Livestock Science Research Station (Posieux, Switzerland) which calved from autumn 2011 to autumn 2012 (previous lactation mean milk production 8038 ± 1497 kg. The mean length of the preceding dry period was 63·9 ± 14·1 d (range 43–97 d). Cows were transferred to straw-bedded calving pens approximately 7 d before expected parturition. Dry cows were fed hay ad libitum plus 1 kg of cereal-based concentrate and 0·5 kg of mineral supplement until calving. The calves were removed from the cow immediately after birth to prevent suckling and their weight was recorded. Cows were milked within 4 h of parturition with a portable milking machine with the capacity for each udder quarter to be collected into a separate container. Colostrum weight of each quarter was recorded; colostrum was mixed and samples from each quarter (n = 124) were frozen at –20 °C until analysis. All the udder quarters of these cows were not treated for clinical mastitis events as determined by the research station resident veterinarian during the collection period and at least 1 week thereafter.
IgG1, IgG2, BSA and LDH analyses
Whole colostrum samples were used for the analyses. The colostrum samples were thawed at room temperature and serially diluted in ELISA wash buffer (50 mM Tris, 0·14 M NaCl, 0·05% Tween 20, adjusted to pH 8·0). The initial dilution was 1 : 400·000 (for IgG1), and 1 : 10·000 (for IgG2 and BSA). ELISA was performed in duplicate in 96-wells plates (Nunc ImmunoPlate 439454 MaxiSorp, Thermo-Fisher Scientific) using (bovine IgG1 [E10-116], IgG2 [E10-117]) ELISA Quantitation Sets (Bethyl Laboratories Inc. Montgomery, TX, USA) and BSA with a quantitation kit from LuBioScience GmbH (Lucerne, Switzerland), all according to manufacturer's protocol with the following exception. For the IgG1 and IgG2 analyses the recommended blocking solution was exchanged with a solution made of fish skin gelatin [1 g of cold water fish skin gelatin (G7765; Sigma Aldrich, Steinheim, Germany) in 20 ml of twice distilled water]. This blocking solution resulted in more consistent results when conducting colostrum ELISA analysis. Each plate had duplicate standard curves and colour was measured at 450 nm with a Synergy Mx plate reader (BioTek Instruments GmbH, Lucerne, Switzerland). The precision of the assay for IgG2 and BSA was <10% for intra-assay and inter-assay variation. For IgG1 < 20% was accepted. Lactate dehydrogenase (LDH) activity was measured using the test kit LDH IFCC (Axon Lab AG, En Budron E9 CH-1052, Le Mont-sur-Lausanne, Switzerland) with an automated analyser (Cobas Mira; Roche Diagnostics International AG, Rotkreuz, Switzerland) according to the manufacturer's instructions.
Statistical analyses
The first step of our analysis included identifying potentially significant linear and quadratic relationships of dependent variables (BSA concentration, BSA mass, IgG1 concentration, IgG1 mass, IgG2 concentration. IgG2 mass, and Lactate Dehydrogenase activity (LDH)) with the independent effects of total days in milk from the previous lactation, days pregnant, days dry, calf weight, minutes to first postpartum milking, previous lactation milk yield, and current colostrum yield. Linear effects were identified with the CORR procedure of SAS (SAS Institute Inc., Cary, NC; 2002–2008, Release 9.2), whereas quadratic effects were identified with the GLM procedure. Additionally, the GLM procedure was used to identify potentially significant class level variables (year, season, calf sex, quarter). All potentially significant (P < 0·15) effects from these preliminary analyses were then entered into a mixed model (MIXED procedure) that included the random effect of cow and a sequential backward elimination procedure was followed where the least significant variable was removed until all variables remaining had P < 0·10. The final step included comparing the model identified for each dependent variable through the backward elimination with a model that included the same independent effects plus a heterogenous residual variance structure. This model allowed residual variance to differ for each cow by setting group = cow in the repeated line of the MIXED procedure and resulted in an improvement in the Akaike information criterion (AIC; Akaike, Reference Akaike1969) and corrected AIC (AICC) in all analyses with the exception of IgG1 concentration. Cow residual with variances that were 2 sd from the mean of residual variance were considered different in their quarter variation while cows with residual variance that were >one sd, but less than 2 sd were considered to be trending toward a difference.
Results
Colostrum components
Thirty one multiparous cows encompassing the 2nd to 6th lactation were used in this study. The 2nd lactation cows had a mean ± sd dry period that was 58·8 ± 8·9 d; but in older cows this was 67·6 ± 16·0 d (P < 0·01). Colostrum IgG1 concentration was lower in the 2nd lactation cow group (29·6 mg/ml) compared to the older cows (36·1 mg/ml; P < 0·05). The mean colostrum weight per cow was 7·35 ± 4·04 kg with a range of 1·34 to 20·72 kg. The interval between calving and first milking for the 31 cows ranged from 30 to 270 min (mean 99 ± 62 min).
Table 1 shows the descriptive statistics for the main components analysed in this study. Colostrum quarter weight had a mean of 1·8 ± 1·1 kg and a large range of 0·1 to 5·5 kg. All analysed components exhibited large variance and very wide minimum and maximal range. The activity of LDH was also variable (Table 1).
Colostrum component concentration, mass and LDH activity in quarter-milked udders of dairy cows. Data are from mammary quarters (n = 124)

Colostrum weight relationship with components
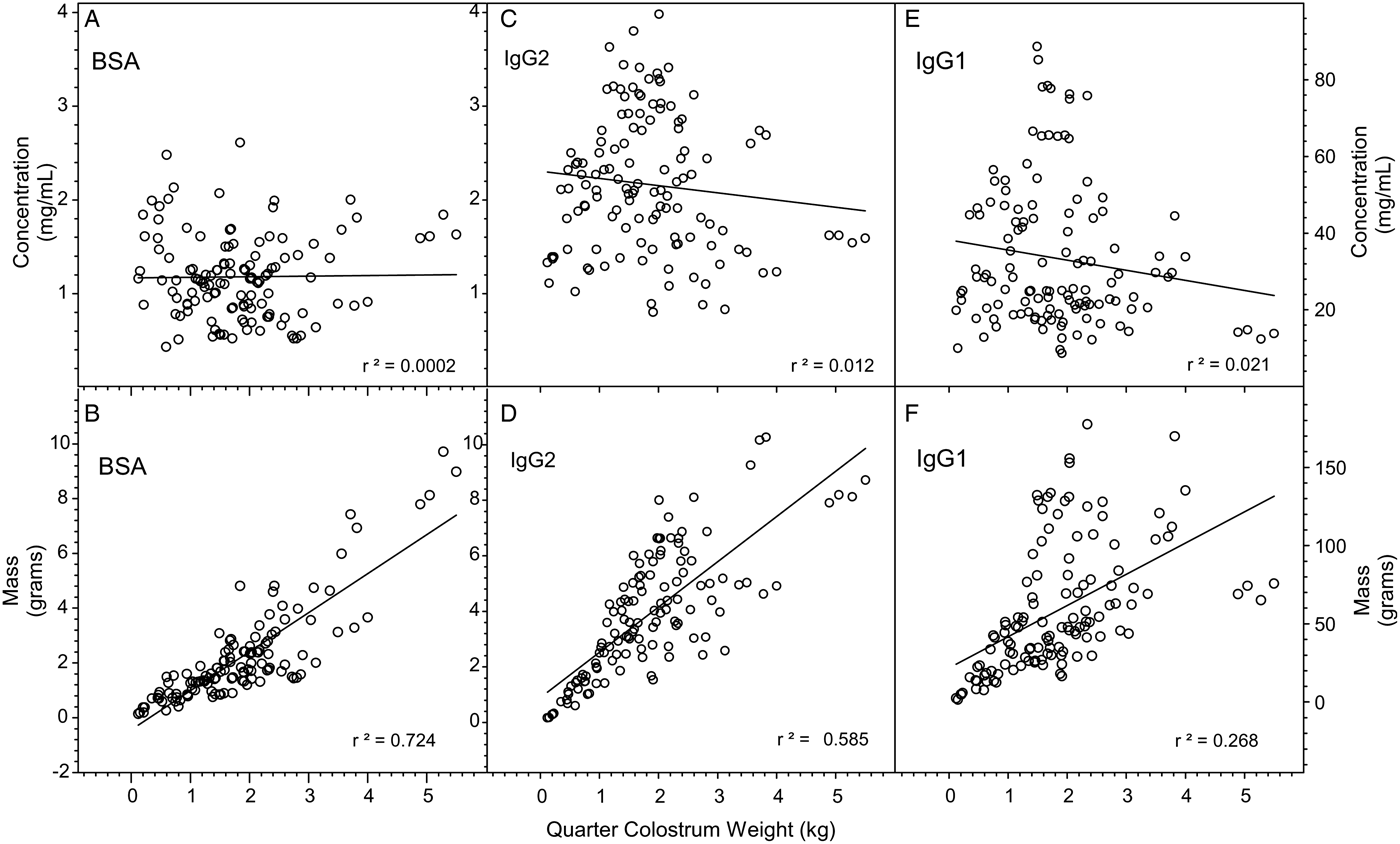
Figure 1 shows the results of BSA, IgG1, and IgG2 concentration and mass occurring in the first milked colostrum obtained from the individual quarters from the 31 parturitions. The top figures (A, C, and E) show the concentration (mg/ml) of these components in the individual quarters plotted against the quarter colostrum weight (kg). The data suggests little relationship (r 2) of any component concentration with colostrum weight and negative slopes with IgG2 (−0·08) and IgG1 (−2·62). The lower series of figures (B, D, and F) show the same components based upon total mass in relationship to the weight of colostrum. Each individual component shows a strong relationship with colostrum mass with declining correlation coefficients (r 2) in the order: BSA > IgG2 ≫ IgG1.
Relationship between BSA, IgG2, and IgG1 concentration and mass with colostrum weight (kg). The figures A, C, and E show the concentration (mg/ml) of these components in the individual quarters plotted against the quarter colostrum weight (kg) from the individual quarters of 31 cows. The figures B, D, and F show the same components based upon total mass (g) in relationship to the colostrum weight. r 2 is the correlation coefficient for a linear regression analysis. Note that Y-axis for the graphs is different.
Partial correlations
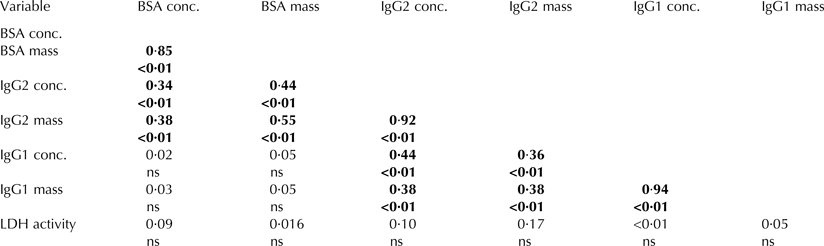
Because weight of quarter colostrum is strongly related to each component mass and likely conceals other relationships (Fig. 1), we conducted a partial correlation analysis utilising manova/printe options of Proc GLM that adjusted each quarter component mass for the weight of colostrum. Table 2 shows these partial correlation coefficients. All components showed high correlations between their individual concentrations and respective mass (0·85–0·94; P < 0·01). BSA concentration and mass was correlated with the concentration and mass of IgG2 (P < 0·01), but BSA concentration and mass was not correlated with that of IgG1 concentration and mass. Interestingly, IgG1 concentration and mass was correlated with IgG2 concentration and mass (P < 0·01). No colostrum variable was correlated with LDH activity.
Partial correlations between IgG1, IgG2, BSA concentration and mass and LDH activity in colostrum samples obtained from 124 quarters of dairy cows. Data is adjusted for colostrum weight
Significance <0·05 is shown in bold.
ns is not significant.
Modeling production parameters
Modeling of BSA, IgG2 and IgG1 concentration and mass with production parameter results are shown in Table 3. With the exception of minutes postpartum to colostrum collection (Min_PP; linear and quadratic) on BSA and IgG2 mass, all other production parameters excluding current colostrum yield had no significance in the model. For BSA concentration (BSAconc), only current colostrum yield (colostrum_kg) showed a trend towards significance. For BSA mass, current colostrum yield and minutes from parturition time of collection (Min_PP) was highly significant. For IgG2 concentration (IgG2conc) only colostrum weight was significant whereas when considering IgG2 mass, Min_PP and colostrum mass were highly significant. For IgG1 concentration (IgG1conc), nothing in the analysis emerged as significant. However, when IgG1 mass was analysed; only colostrum_kg was significant.
Proc Mixed model of significant production parameters for colostrum components
† No improvement in AIC (Akaike's information criterion).
Min_PP; minutes postpartum collection (linear and quadratic).
Akaike's information criterion
In each analysis, two models of Proc Mixed were considered. The difference between the two models was the use of Repeated/group = cow. Table 3 shows the Akaike's information criterion (AIC; (Akaike, Reference Akaike1969; Judge et al. Reference Judge, Griffiths, Hill, Lutkepohl and Lee1985)) differences between the use of Group = cow in the model. In all cases but one (IgG1conc), the model was improved by the inclusion of Group + cow supporting the finding that quarter variation within cow was a significant component of model.
Quarter differences within cows
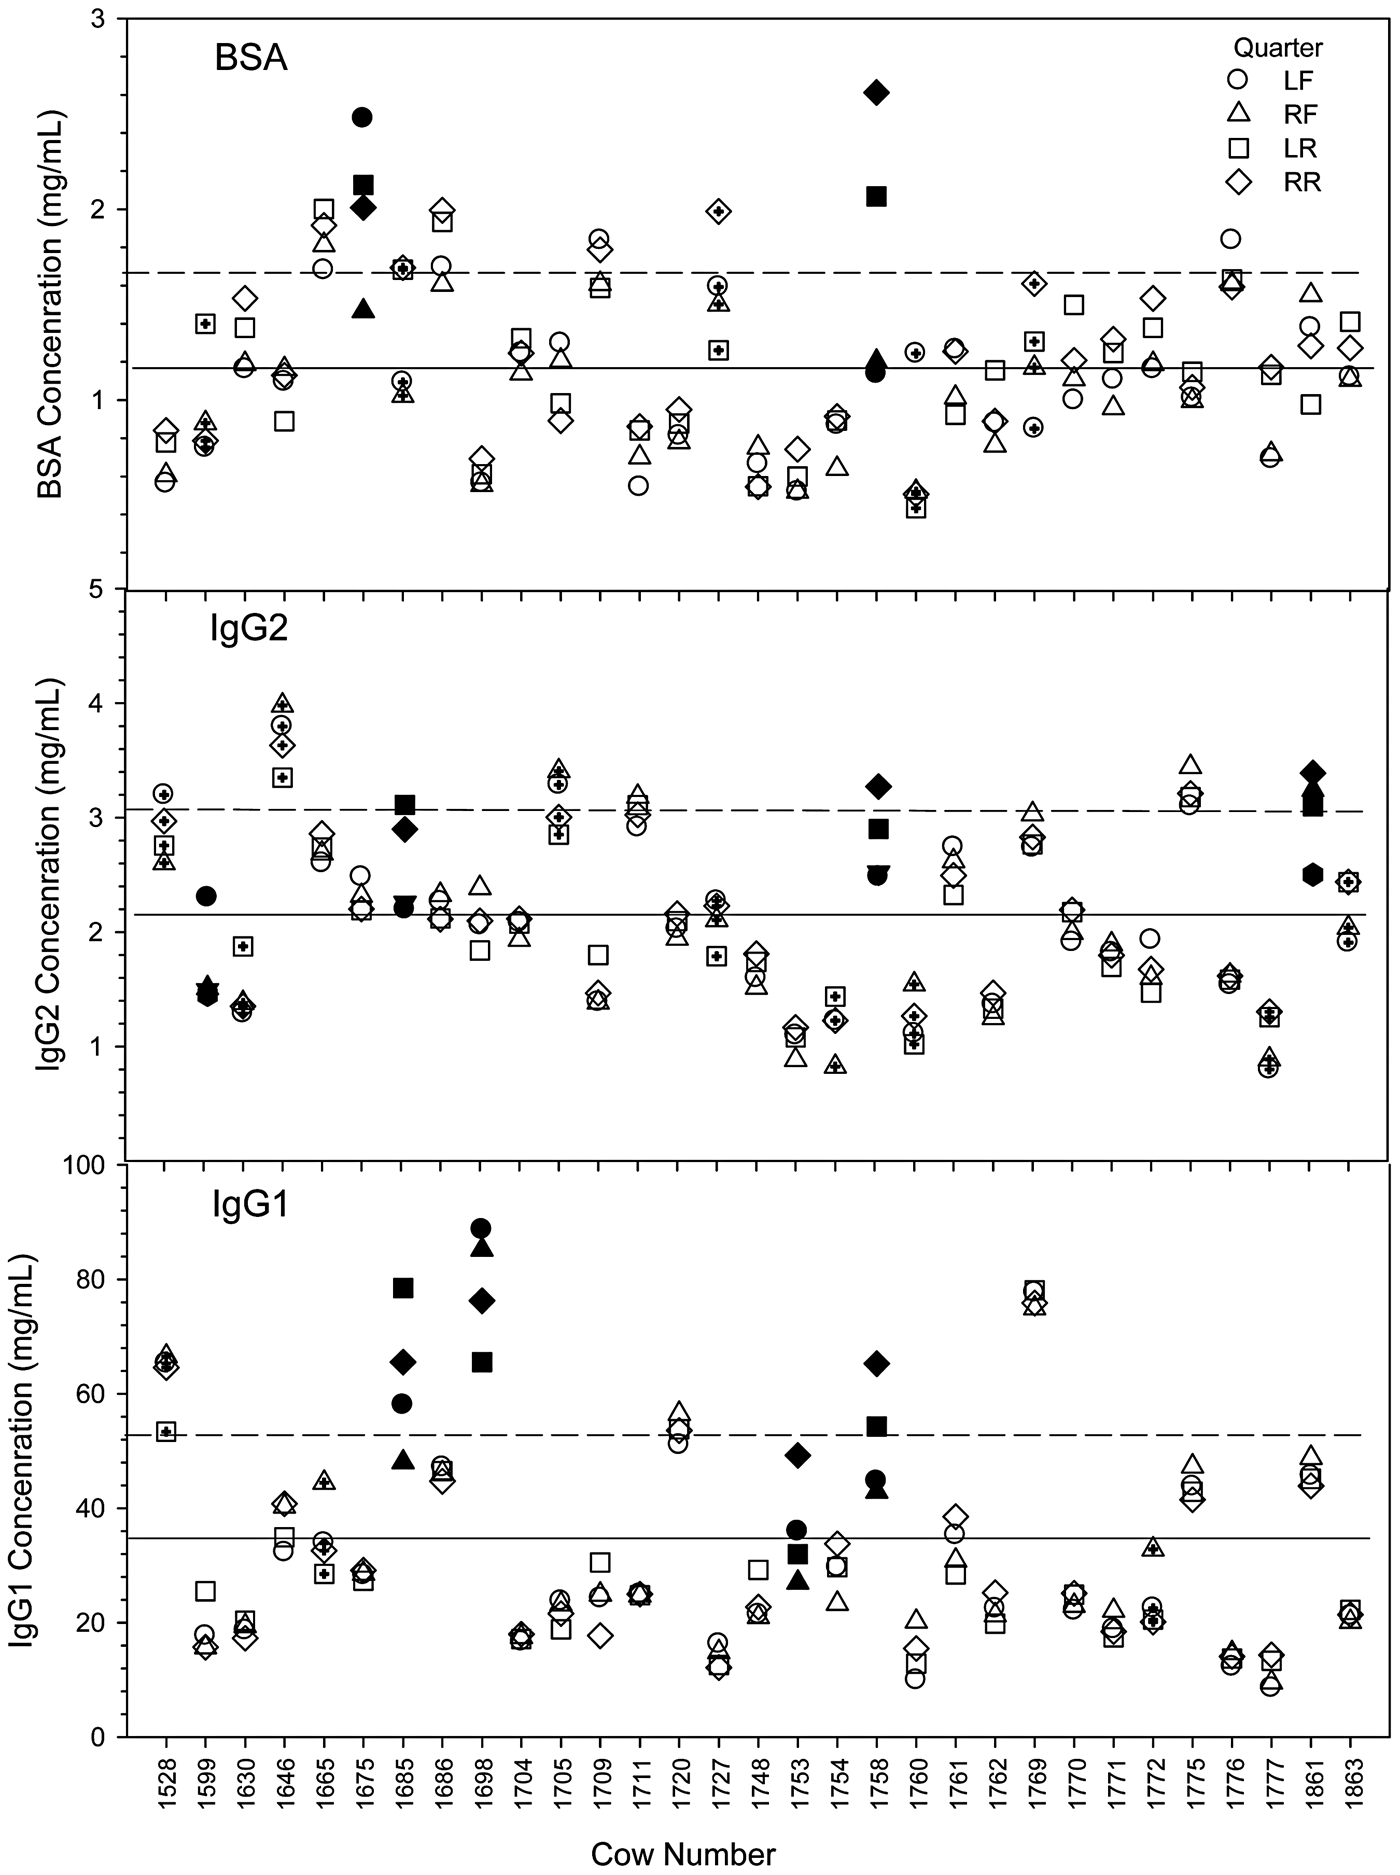
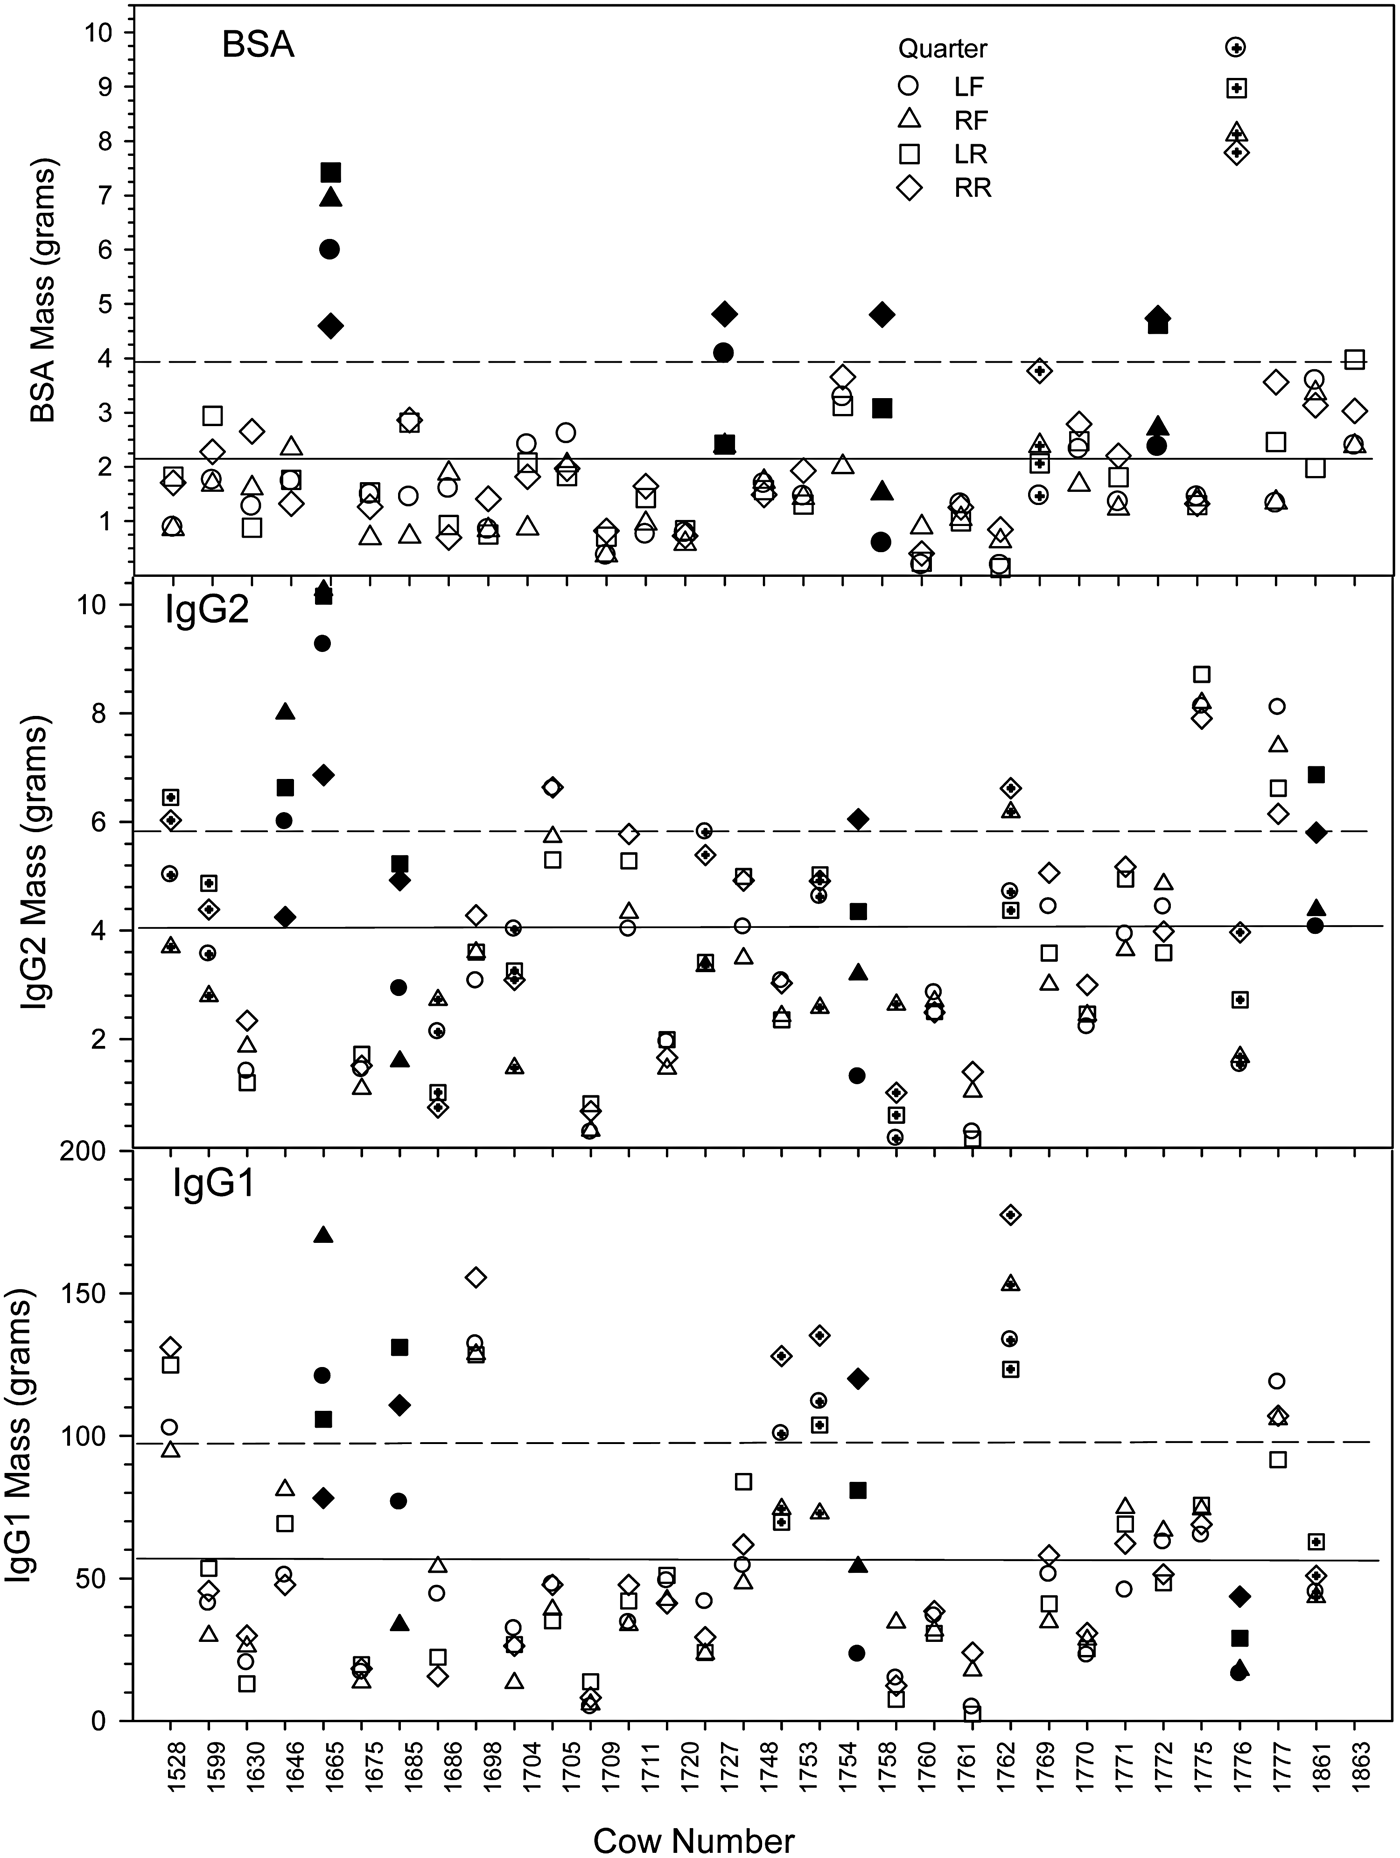
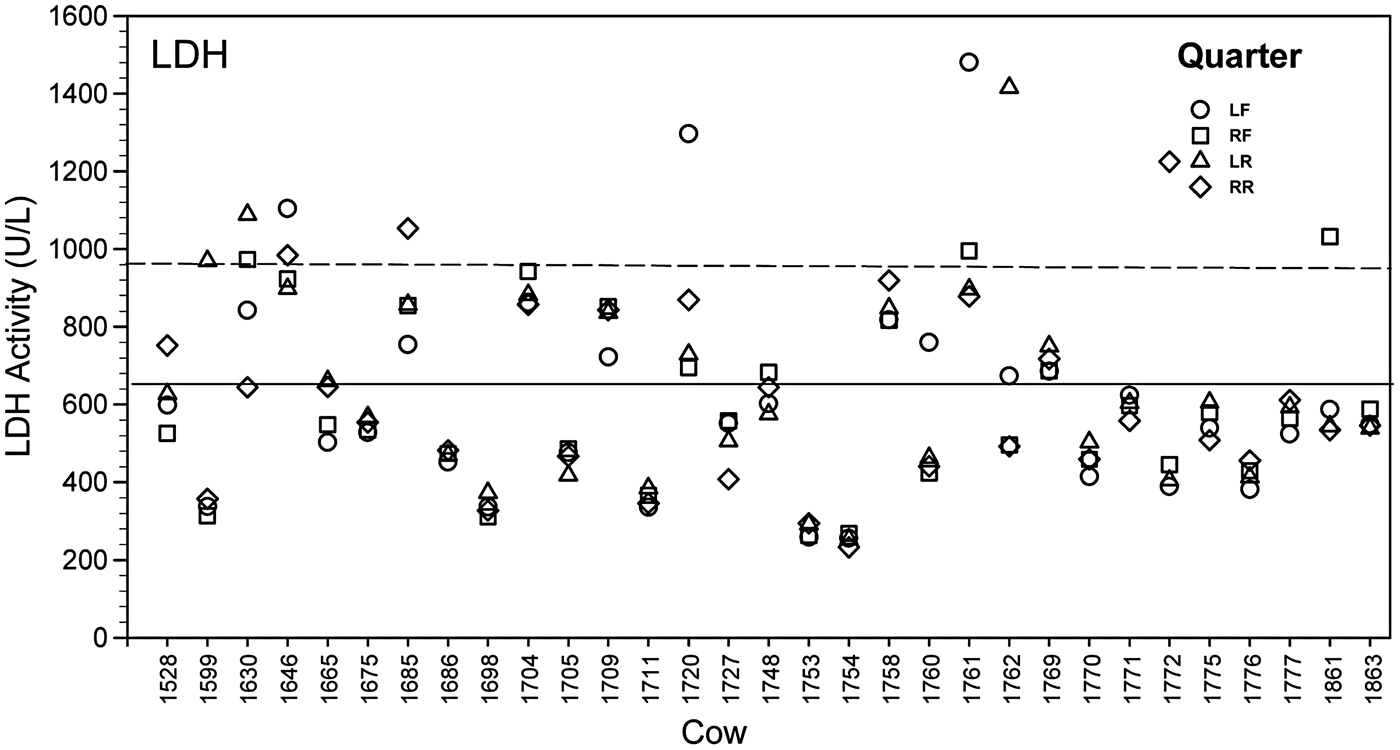
Figures 2 and 3 show the variation between quarters of cows for concentration and mass of the three proteins. The concentration BSA and IgG2 show similar ranges while IgG1 concentration is much higher. Interestingly, the concentration and mass mean of IgG2 is greater when compared to BSA. Figure 4 shows the quarter variation of LDH activity in the quarters of the experimental cows. No correlation (Table 2) was detected between LDH activity and the other three protein concentration or mass.
Cow quarter variation of BSA, IgG2 and IgG1 concentration. Solid line is the mean and dashed line is the upper one sd. Quarters are left front (LF), right front (RF), left rear (LR), and right rear (RR). Solid symbols are cows with residuals >2 standard deviations above the residual mean and symbols with plus are cows with residuals >1 sd above the residual mean.
Cow quarter variation of BSA, IgG2 and IgG1 mass. Solid line is the mean and dashed line is the upper one sd. Quarters are left front (LF), right front (RF), left rear (LR), and right rear (RR). Solid symbols are cows with residuals >2 sd above the residual mean and symbols-plus (+) are cows with residuals >1 sd above the residual mean.
Cow quarter variation of LDH activity. Quarters are left front (LF), right front (RF), left rear (LR), and right front (RF).
Discussion
The objective of this study was to describe the variation in concentration, mass, and evaluate the relationships between the proteins IgG1, IgG2, and BSA in quarter colostrum. Blood IgG1, IgG2, and BSA are the most abundant proteins that together account for about 70% of plasma proteins. Bovine serum albumin (~36 mg/ml; Guidry et al. Reference Guidry, Butler, Pearson and Weinland1980; Poutrel et al. Reference Poutrel, Caffin and Rainard1983) is produced by hepatocytes and is known to transport numerous small molecules in the circulation, supports colloidal osmotic pressure, and buffers blood pH (Carter & Ho, Reference Carter and Ho1994).
The presence of IgG in blood is reported to be somewhat equivalent between IgG1 and IgG2 [~10 mg/ml each (Abel Francisco & Quigley, Reference Abel Francisco and Quigley1993)], but only IgG1 appears in colostrum with high concentrations that are attributed to a transcytosis process (Rojas & Apodaca, Reference Rojas and Apodaca2002; Kacskovics, Reference Kacskovics2004; Baumrucker & Bruckmaier, Reference Baumrucker and Bruckmaier2014).
The exact time course of the movement of these components during the colostrum phase and their variation in mammary quarters is not well known. However, two specific routes are known for component movement from blood to colostrum. A passive mechanism involves movement between the cells via leaky-tight junctions (Stelwagen et al. Reference Stelwagen, Carpenter, Haigh, Hodgkinson and Wheeler2009). The size limit of leaky-tight junctions in mammary epithelial cells has not been established, but there is a steep size preference for solutes less than 4 angstroms (Å) in radius in epithelial tissues (Watson et al. Reference Watson, Rowland and Warhurst2001; Van Itallie & Anderson, Reference Van Itallie and Anderson2014). Interestingly, IgGs are larger in diameter than that of BSA and would be expected to exhibit slower diffusion through a size restricted passage.
Both IgG2 and BSA are thought to enter mammary secretions via leaky-tight junction during inflammation resulting from the change in vascular permeability (Lehmann et al. Reference Lehmann, Wellnitz and Bruckmaier2013). Inflammation caused by clinical mastitis during an established lactation is accompanied by increased capillary permeability, which facilitates passage of proteins, including BSA, from blood to the udder secretions (Poutrel et al. Reference Poutrel, Caffin and Rainard1983). While uninfected quarters exhibit ~0·2 mg/ml of BSA in milk (Smith et al. Reference Smith, Chesworth, Henderson and Robdway1979; Poutrel et al. Reference Poutrel, Caffin and Rainard1983), infected quarters show higher, but variable concentrations. During colostrogenesis, leaky-tight junctions are reported occurring in the absence of infection (Nguyen & Neville, Reference Nguyen and Neville1998) and BSA can be 1 to 2 mg/ml (Guidry et al. Reference Guidry, Butler, Pearson and Weinland1980; Levieux & Ollier, Reference Levieux and Ollier1999).
The other mechanism of blood components appearing in colostrum is via transcytosis, the process by which various macromolecules are transported across the interior of a cell. Mayer et al. (Reference Mayer, Doleschall, Bender, Bartyik, Bosze, Frenyo and Kacskovics2005) showed that the FcRn is found in multiple tissues as well as the mammary gland (Cervenak & Kacskovics, Reference Cervenak and Kacskovics2009) and can conduct transcytosis as well as recycling of IgG1 (Kim et al. Reference Kim, Bronson, Hayton, Radmacher, Roopenian, Robinson and Anderson2006; Tzaban et al. Reference Tzaban, Massol, Yen, Hamman, Frank, Lapierre, Hansen, Goldenring, Blumberg and Lencer2009). It was been reported that FcRn receptor binds albumin in addition to IgG1 and prolongs the half-lives of both of these serum proteins by diverting them from the endothelial intracellular degradation (Anderson et al. Reference Anderson, Chaudhury, Kim, Bronson, Wani and Mohanty2006).
Colostrum volume, IgG1 concentration and mass at the first milking after calving varied widely among cows (Table 1); IgG1 concentration and variability in colostrum IgG1 concentration (8·6–88·7 mg/ml) among cows is similar to reports where colostrum was sampled from different size US and Norwegian farms (Kehoe et al. Reference Kehoe, Jayarao and Heinrichs2007; Gulliksen et al. Reference Gulliksen, Lie, Solverod and Osteras2008; Baumrucker et al. Reference Baumrucker, Burkett, Magliaro-Macrina and Dechow2010; Morin et al. Reference Morin, Nelson, Reid, Nagy, Dahl and Constable2010), but is different than the reported high values measured in colostrum from grass-based system managed cows (13–256 mg/ml; Conneely et al. Reference Conneely, Berry, Sayers, Murphy, Lorenz, Doherty and Kennedy2013).
Several studies have shown relationships between IgG concentration, colostrum volume and the interval between calving and first milking (Moore et al. Reference Moore, Tyler, Chigerwe, Dawes and Middleton2005; Morin et al. Reference Morin, Nelson, Reid, Nagy, Dahl and Constable2010). In the study of (Morin et al. Reference Morin, Nelson, Reid, Nagy, Dahl and Constable2010) IgG concentration decreased by 3·7% for each additional litre of mammary gland secretion and 3·7% for each additional hour after calving. Moore et al. (Reference Moore, Tyler, Chigerwe, Dawes and Middleton2005) found that colostrum sampled 6 h after calving or later had a significantly lower IgG content than colostrum collected 2 h after calving. Our results indicated the time post-partum until collection of colostrum was only significant for BSA and IgG2 mass. Nevertheless, our collection time of colostrum post-partum was narrow (mean ± sd; 99·2 ± 62·4 min) relative to other studies.
Figure 1 showed no overall correlation of any of the measured quarter protein concentration with that of colostrum weight, but, all of the measured protein masses were strongly related with colostrum weight. Nevertheless, one would expect mass vs weight (i.e.: mass) comparisons to be related. However, it is interesting that BSA concentration has the highest relationship with weight followed by IgG2, while IgG1 has the lowest relationship. Perhaps the BSA > IgG2 correlation is dependent upon molecular size with BSA being smaller and thus able to leak through a leaky-tight junction. A similar IgG1 mass to colostrum weight relationship has been reported (Baumrucker et al. Reference Baumrucker, Burkett, Magliaro-Macrina and Dechow2010). It is likely that the active transport process and quarter variation (Baumrucker et al. Reference Baumrucker, Stark, Wellnitz, Dechow and Bruckmaier2014) contribute to the lower relationship of IgG1 mass with colostrum mass.
In 12 of the cows investigated, there were large variations in the components mass of IgG1 in individual quarters among the cows. This is in accordance with the findings of an earlier report with quarter milked cows revealing any quarter within a cow udder may produce different mass of IgG1 (Baumrucker et al. Reference Baumrucker, Stark, Wellnitz, Dechow and Bruckmaier2014).
It is notable that both BSA mass and IgG2 mass were related to time to post-partum milking (Table 2) suggesting an increase in mass with time likely dependent upon the gradual closing of the leaky-tight-junctions following parturition. As expected, IgG1 did not exhibit this relationship. All components except BSA and IgG1 concentration were related to colostrum weight.
Partial correlations that adjusted for colostrum concentration and weight were conducted to evaluate the relationships between the three proteins. As expected, all components showed that concentration and mass were highly related. Bovine serum albumin concentration was related to IgG2 concentration and mass while BSA mass was more strongly correlated with IgG2 mass. However, BSA concentration and mass were not correlated with IgG1 concentration and mass. These two findings support the leak mechanism of BSA appearance and is different from transcytosis of IgG1. However, all proteins showed no correlation with LDH activity. The activity of LDH has been thought to be related to leakage of blood enzyme activity (Friggens et al. Reference Friggens, Chagunda, Bjerring, Ridder, Hojsgaard and Larsen2007; Lehmann et al. Reference Lehmann, Wall, Wellnitz and Bruckmaier2014; Wellnitz et al. Reference Wellnitz, Wall, Saudenova and Bruckmaier2014) but our data does not support this concept.
An interesting finding of this study was that the concentration of IgG2 was related to the concentration of IgG1. This was not the case for BSA suggesting that although BSA and IgG2 are correlated in changes in concentration, IgG2 is also related to changes in IgG1 concentration. Perhaps this latter finding relates to the report of Takimori et al. (2011) that showed that when the purified bovine FcRn complex was analysed with a BIACORE 2000 biosensor system, the bFcRn bound IgG2 with greater affinity than IgG1 (6–7-fold). However, to date, all FcRn examined from multiple tissues and species have not reported any specificity for IgG2 (Kuo et al. Reference Kuo, Baker, Yoshida, Qiao, Aveson, Lencer and Blumberg2010; Giragossian et al. Reference Giragossian, Clark, Piche-Nicholas and Bowman2013) and the appearance of IgG2 in colostrum is consistently below the concentration found in blood (Levieux & Ollier, Reference Levieux and Ollier1999).
In this study we did not find a correlation between IgG1 and BSA in quarter milked colostrum. Therefore, we reject the hypothesis that BSA would be closely correlated with IgG1 changes. Thus, co-transcytosis of IgG1 and BSA is not occurring. Nevertheless, BSA concentration and mass were shown to be different among cows, quarters and quarters within cow and thus the other component of the hypothesis is accepted. The relationship of BSA and IgG2 indicate that they appear in a similar manner, likely through leaky-tight junctions. However, this relationship is confounded by the difference in blood concentrations (BSA higher), colostrum concentrations (IgG2 higher) and the protein molecular size (IgG2 larger).
Conclusions
The appearance of blood components in colostrum has been thought to occur by active and passive mechanisms. IgG1 which appears in high concentrations and mass is known to be occurring by transcytosis, likely by the bFcRn, while BSA and IgG2 are thought to occur via leaky-tight junctions. The blood-milk barrier is known to be more leaky during colostrogenesis when compared to an established lactation. Our results show no relationship of BSA with IgG1 mass transfer into colostrum. Furthermore, BSA and LDH enzyme activity were not correlated while quarter differences in BSA and IgG2 concentration and mass was revealed. Finally, an IgG1 and IgG2 concentration and mass correlation suggested that another unknown mechanism of IgG2 appearance in mammary secretions during colostrogenesis may exist.
The expert support of laboratory work of Yolande Zbinden and Samantha K. Wall is gratefully acknowledged. The stay of Dr Samarütel in Switzerland to conduct this scientific work was funded by a grant of Scientific Exchange Programme between Switzerland and the New Member States of the European Union (SCIEX-NMSch).