


1 Introduction
Measuring the preferences of political actors is an important—and increasingly necessary—tool in the political scientist’s tool kit. Indeed since at least the seminal work of Poole and Rosenthal (Reference Poole and Rosenthal1985), a cottage industry has emerged attempting to measure the preferences—or “ideology”—of political actors.Footnote 1 However, since preferences are never directly observed, inferring them empirically can be tricky. The goal is then to estimate an unobserved, latent trait of political actors (e.g., members of congress, justices, municipalities, constituencies) based on observed behavior (e.g., votes, political donations, text, etc.). The resulting revealed preferences are useful, among other reasons, for theory testing. From scholarship on legislative bargaining (Krehbiel Reference Krehbiel1998) to executive-legislative relations (Cameron Reference Cameron2000) to voting and representation (Jessee Reference Jessee2012), preferences of political actors (median member of a legislative body; president and pivotal members of Congress; constituents and representatives, respectively) play a crucial role in theories of various political phenomena. Indeed, Clarke and Primo (Reference Clarke and Primo2012) suggest such theory-testing is a characteristic of political science.Footnote 2
By far the most dominant methodological and theoretical tool in modern political science for operationalizing the process of inferring preferences from data is the so called spatial model (Stokes Reference Stokes1963; Davis, Hinich, and Ordeshook Reference Davis, Hinich and Ordeshook1970; Enelow and Hinich Reference Enelow and Hinich1984), in which political actors’ preferences are represented in Euclidean space. In this context, testing theories of political behavior and/or institutions often requires measuring (or estimating) the preferences of different groups of political actors (e.g., members of the U.S. House and members of the U.S. Senate) on a common scale. For example, veto bargaining in the domain of legislative-executive relations (McCarty and Poole Reference McCarty and Poole1995; Tsebelis Reference Tsebelis1995) requires the executive’s and the legislature’s preferences be measured on a common scale.Footnote 3
The main issue in this line of work is how to ensure that the preferences of these different groups of political actors are indeed measured on a common scale. While each group of actors can be scaled independently using, for example, NOMINATE (Poole and Rosenthal Reference Poole and Rosenthal1991, Reference Poole and Rosenthal2011) or IDEAL (Clinton, Jackman, and Rivers Reference Clinton, Jackman and Rivers2004), ensuring that the resulting scales are comparable is a delicate matter. Common approaches to ensure comparable scales include: assuming some common actors’ preferences do not change (Shor, Berry, and McCarty Reference Shor, Berry and McCarty2010; Treier Reference Treier2011); using vignettes to anchor the scale (Bakker et al. Reference Bakker, Jolly, Polk and Poole2014; Asmussen and Jo Reference Asmussen and Jo2016); assuming some actors’ preferences change in a highly parametric fashion (Martin and Quinn Reference Martin and Quinn2002); and/or ignoring the issue of scaling actors on a common scale and instead focus on aspects of the distribution of estimated ideal points invariant to certain transformations (Esteban and Ray Reference Esteban and Ray1994; Duclos, Esteban, and Ray Reference Duclos, Esteban and Ray2004; Jessee and Theriault Reference Jessee and Theriault2014). A less satisfying approach some authors take is to ignore the issue of comparability and treat scales based on different votes as equivalent (Binder Reference Binder1999). Lofland, Rodríguez, and Moser (Reference Lofland, Rodríguez and Moser2017) discuss the limitations and disadvantages of such approaches.
Another version of this estimation problem—measuring the preferences of actors across different domains of voting—is less studied and there are fewer methods for performing such comparisons. Being able to make comparisons of a member’s revealed preference in different domains is growing increasing useful for the study of legislatures. For example, in studying majority–minority party relations in the U.S. House, Egar (Reference Egar2016) compares voting behavior between two types of roll-calls: those requested by majority-party members and those requested by minority-party members. Theriault (Reference Theriault2008) and Jessee and Theriault (Reference Jessee and Theriault2014) argue that partisan polarization in the U.S. House of Representatives is the result of differential party influence on member’s voting behavior between procedural votes and votes on final passage. In these examples the main methodological challenge is to measure (or estimate) the preferences of a common set of political actors based on behavior in different domains (e.g., roll-call voting on procedural motions vs. roll-call voting on final passage motions) on a common scale. When scholarly inquiry requires this type of comparison—for example, between voting in the Committee of the Whole versus the House, as in Roberts and Smith (Reference Roberts and Smith2003); between different issue areas, as in Jochim and Jones (Reference Jochim and Jones2013); or between lame-duck sessions and nonlame-duck sessions, as in Nokken (Reference Nokken2014)—votes are usually segregated by type and analyzed separately. A major disadvantage to this approach is the lack of comparability across scales (if one attempts to use the inferred ideal points for the comparison), and the challenges of comparing the rank orders (which are identifiable but difficult to compare, as we illustrate in Section 5.4).
We develop a novel technique to estimate legislators’ revealed preferences in different domains of voting on a common scale. In our approach, votes are broken into predetermined groups and legislators are, in principle, allowed to have different preferences for each group. A hierarchical Bayesian model that uses clustering priors is then used to shrink the number of distinct positions that a legislators might have. When all votes belong to the same group, or all legislators have identical positions in all issues, our model reduces to a standard Bayesian item response theory (IRT) model (Albert and Chib Reference Albert and Chib1993; Clinton et al. Reference Clinton, Jackman and Rivers2004). Otherwise, our approach is a strict generalization of it that relaxes the usual assumption that all votes are “equal” (for purposes of estimating latent traits from roll-call votes). To ensure that the latent scales are comparable, our approach identifies individual whose ideal points do not change across voting domains. The approach is similar to the bridging-voters approach introduced in Shor et al. (Reference Shor, Berry and McCarty2010) and Asmussen and Jo (Reference Asmussen and Jo2016) to link measurement scales across the federal and state legislatures in the United States. However, unlike Shor et al. (Reference Shor, Berry and McCarty2010), our approach does not assume prior knowledge of the identity of the voters whose ideal points are identical across voting domains, and instead estimates it.Footnote 4 This paper builds on the work of Lofland et al. (Reference Lofland, Rodríguez and Moser2017), in which a statistical model is developed to compare ideal points of legislators before and after an event, for example, the change in majority party following Senator Jeffords’s (VT) party switch in the 107 ${\mbox {th}}$ U.S. Senate. Their model permits comparison of revealed preferences between two groups of votes. Here we extend this model to allow for an arbitrary number of groups by introducing a prior on the set of possible partitions of the groups inspired by the widely-used Chinese restaurant process prior (Pitman Reference Pitman, Blackwell, Ferguson, Shapley and MacQueen1996).
In addition to avoiding ex ante assumptions about allowable changes in revealed preferences, our approach has several other methodological advantages. First, our estimation approach results in a common scale, which allows us to properly compare the preferences of individuals across voting domains. In particular, our approach allows for the direct comparison and formal hypothesis tests across domains. For example, we may now formally test claims of the form “preferences in domain A are different than those in domain B” at the individual and group level. Second, unlike most other approaches in the literature, ours allows us to make statements about the consistency of preferences at the individual-level, the group-level and at the chamber level. This is a direct consequence of the fact that our model estimates the identify of members with consistent preferences in all domains. Third, because it relies on a joint model across all voting domains, the methodology developed here is a kind of “partial pooling” model for roll-call votes/IRT scaling, resulting in more precise estimates of preferences in each voting domain (a feature analogous to the “information borrowing” found in multilevel models). Finally, since our model uses a hierarchical Bayesian prior, it automatically adjusts for the large number of comparisons involved in the analysis (Scott and Berger Reference Scott and Berger2006, Reference Scott and Berger2010).
We illustrate our model through an analysis of preferences in different policy domains in the U.S. House of Representatives using the taxonomy of votes defined by Policy Agendas Project (hereafter, PAP) major topic groups (Baumgartner and Jones Reference Baumgartner and Jones1993; Policy Agendas Project 2017). As discussed in Section 3, in this setting, the resulting multiple ideal points estimated by our model may be interpreted as issue-specific preferences. We are not the first to examine issue-specific preferences. Gerrish and Blei (Reference Gerrish and Blei2010, Reference Gerrish, Blei, Pereira, Burges, Bottou and Weinberger2012a, Reference Gerrish and Blei2012b) and Lauderdale and Clark (Reference Lauderdale and Clark2014) use meta-data associated with a vote (specifically, the text of the motion or case being decided) to infer different aspects of voters’ utility. Their approach is based on the idea that members have preferences over different issues and that votes are “about” issues in some proportion. They use the text of a motion to estimate what each vote is “about” (the issues present in a given vote). Despite the similarities in the methodological objectives of these works, there are several differences between Gerrish and Blei (Reference Gerrish and Blei2012b) and Lauderdale and Clark (Reference Lauderdale and Clark2014), including identification, estimation, and the structure of the model. For example, in Gerrish and Blei (Reference Gerrish and Blei2012b) voters have a main ideal point and issue-specific adjustments there-from. Identification is met by the use of continuous shrinkage priors on deviations. In Lauderdale and Clark (Reference Lauderdale and Clark2014), voters are allowed to have arbitrary preferences over each issue and identification is obtained by requiring each voter to weigh the issue-content of the vote the same. Our approach does not directly use the content of the bill. Instead we use manually curated groups of votes as our metadata (see Section 2 for details).Footnote 5
The rest of the paper is organized as follows. In Section 2, we present the Bayesian model and prior specification. Section 3 discusses the interpretation of the model, and the relationship between vote group clusters and the classical literature on dimensionality. Section 4 discusses estimation and identification procedures. Section 5 illustrates the model by examining the revealed preferences of House members in different policy issue areas, grouping roll-called votes by PAP major topic. Section 6 discusses the implications of our work and potential future applications of the methodology.
2 Model
Let 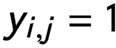 $y_{i,j} = 1$ if the vote cast by legislator
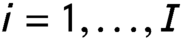 $i = 1, \ldots , I$ on motion
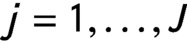 $j = 1, \ldots , J$ is “Yea” and
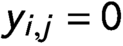 $y_{i,j} = 0$ if it is “Nay.” Spatial voting models assume that legislators make decisions according to random utility functions that depend on the distance between the legislator’s preferred policy (their ideal point) and that of a particular piece of legislation in an unobservable policy space. The exact form of the utility (e.g., quadratic as in Jackman Reference Jackman2001; Clinton et al. Reference Clinton, Jackman and Rivers2004 or Gaussian as in Poole and Rosenthal Reference Poole and Rosenthal1987; McCarty, Poole, and Rosenthal Reference McCarty, Poole and Rosenthal1997) and the random shocks (e.g., Gaussian vs. extreme value) differ across models.Footnote 6 In the case of a quadratic loss function with independent errors over preferences that lie in a D-dimensional Euclidean policy space, this leads to a likelihood of the form
 $$ \begin{align} y_{i,j} \mid \mu_j, \boldsymbol{\alpha}_j, \boldsymbol{\beta}_{i} \sim& \mathsf{Bernoulli} \left( y_{i,j} \, \mid \, G\left( \mu_j + \boldsymbol{\alpha}^{T}_j \boldsymbol{\beta}_{i} \right) \right), \end{align} $$
where 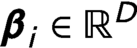 $\boldsymbol {\beta }_i \in \mathbb {R}^D$ corresponds to the position of legislator i in policy space (their ideal point),
 $\mu _j$ controls the baseline probability of a positive vote (Yea) on motion j,
 $\boldsymbol {\alpha }_j \in \mathbb {R}^D$ controls the effect of the ideal points of the legislators on the probability of a positive vote on motion j, and G is an appropriate link function.Footnote 7 For the purpose of this paper, we assume that G is the cumulative distribution function of the standard normal distribution, that is, we work with a probit model.
We extend this spatial voting model to account for legislators with potentially different ideal points associated with each of K mutually exclusive groups of motions. The groups of motions are identified through (known) indicator variables  $\gamma _{1}, \ldots , \gamma _{J}$ such that
 $\gamma _{j} \in \{1, \ldots ,K\}$, that is,
 $\gamma _j=k$ if and only if motion j is in group k. For example, in the illustration discussed in Section 5,
 $\gamma _j$ indicates to which one of the major PAP categories a vote belongs to.Footnote 8 The likelihood of this extended model takes the form
 $$ \begin{align} y_{i,j} \mid \mu_j, \boldsymbol{\alpha}_j, \boldsymbol{\beta}_{i,k}, \gamma_j \sim \mathsf{Bernoulli} \left( y_{i,j} \, \mid G\left( \mu_j + \boldsymbol{\alpha}_j^T \boldsymbol{\beta}_{i,\gamma_j} \right) \right) , \end{align} $$
where  $\boldsymbol {\beta }_{i,1}, \ldots , \boldsymbol {\beta }_{i,K}$ correspond to the (potentially distinct) ideal points of legislator i on each of the groups of motions. Hence, when
 $K=1$, our model reduces to the usual IRT scaling of votes (e.g., Clinton et al. Reference Clinton, Jackman and Rivers2004) .
Similar to Lofland et al. (Reference Lofland, Rodríguez and Moser2017), we introduce a joint prior for  ${\boldsymbol {\beta }}_{i,1}, \ldots , {\boldsymbol {\beta }}_{i,K}$ that allows us to identify groups of motions for which a given legislator has the same revealed preferences. In this case, the prior is inspired by ideas from model-based clustering. More specifically, we rewrite the ideal point of legislator i for group k as
 ${\boldsymbol {\beta }}_{i,k} = \tilde {\boldsymbol {\beta }}_{i,\zeta _{i,k}}$, where
 $\{\tilde {\boldsymbol {\beta }}_{i,1}, \tilde {\boldsymbol {\beta }}_{i,2}, \ldots \}$ represent the set of unique ideal points possessed by individual i, and the (unknown) auxiliary variables
 $\boldsymbol {\zeta }_1, \ldots , \boldsymbol {\zeta }_I \in \{ 1, 2, \ldots \}$ are such that
 $\zeta _{i,k} = \zeta _{i,k'}$ if and only if legislator i possesses the same ideal point in the kth and the
 $k'$th groups of motions. Hence, the indicators
 $\zeta _{i,1}, \ldots , \zeta _{i,K}$ partition the set
 $\{\boldsymbol {\beta}_{i,1}, \ldots , \boldsymbol {\beta }_{i,K} \}$ into
 $L_i \le K$ legislator-specific clusters; note that if
 $\zeta _{i,k} = \zeta _{i,k'}$, then legislator i has the same preferences over votes in group k as for votes in group
 $k'$. This structure resembles that of a collection of I independent finite mixture models, each one associated with a different legislator. We call legislators for which
 $\zeta _{i,k} \ne \zeta _{i,k'}$ movers between vote group k and vote group
 $k'$, and those for which
 $\zeta _{i,k} = \zeta _{i,k'}$ stayers. Similarly, if
 $\zeta _{i,k} = \zeta _{i,k'}$ for all k and
 $k'$, then legislator i exhibits the same preferences on all votes and we call them a full stayer. If all legislators are full stayers, the extended model also reduces to the one in (1).
As mentioned in the introduction, while the approach of Shor et al. (Reference Shor, Berry and McCarty2010) and Shor and McCarty (Reference Shor and McCarty2011) assumes the vectors  $\boldsymbol {\zeta }_1, \ldots , \boldsymbol {\zeta }_I$ are known in advance, we instead treat these indicators as unknown parameters and aim to estimate them from the data. This requires that we specify a (joint) prior distribution for the indicator vectors. Following Gopalan and Berry (Reference Gopalan and Berry1998), it would be natural to assign independent Chinese restaurant priors (Antoniak Reference Antoniak1974) with a common dispersion parameter
 $\phi> 0$ to each vector
 $\boldsymbol {\zeta }_i$, that is,
 $$ \begin{align} p(\boldsymbol{\zeta}_1, \ldots ,\boldsymbol{\zeta}_I \mid \phi) &= \prod\limits_{i=1}^I \left\{ \frac{\Gamma(\phi)}{\Gamma(\phi+K)}\phi^{L(\boldsymbol{\zeta}_i)} \prod\limits_{l=1}^{L(\boldsymbol{\zeta}_i)} \Gamma\left( n_l(\boldsymbol{\zeta}_i) \right) \right \} , \end{align} $$
where  $\Gamma (t) := \int _0^{\infty } z^{t-1} \exp \left \{ -z \right \}$ is the well-known Gamma function,
 $L(\boldsymbol {\zeta }_i) = L_i$ is the number of unique values among
 $\zeta _{i,1}, \ldots ,\zeta _{i,K}$ (i.e., the number of clusters for legislator i),Footnote 9
 ${1}(\cdot )$ is the indicator function, and
 $n_l(\boldsymbol {\zeta }_i) = \sum _{k=1}^{K} {1}(\zeta _{i,k} = l)$ is the number of groups of motions assigned to cluster l. Under this model, the prior probability that a given legislator is a stayer between two groups of votes is
 $\frac {1}{1+\phi }$, the probability that a given legislator is a full stayer is
 $\theta := \frac {\Gamma (K)\Gamma (1+\phi )}{\Gamma (K+\phi )}$, and the prior number of full stayers, B, follows a binomial distribution with size I and probability
 $\theta $.
While (3) has a number of appealing features, the use of fully independent priors for each legislator does not ensure that the different latent spaces share a common scale. Indeed, as discussed in Lofland et al. (Reference Lofland, Rodríguez and Moser2017), a minimum number of stayers (dependent on the dimension D of the latent space) are required to ensure identifiability across mutually exclusive groups of votes. A sufficient condition that is also easy to enforce computationally is the presence of at least  $D+1$ full stayers. Hence, in this paper we work with the modified prior
 $$ \begin{align} p(\boldsymbol{\zeta}_1, \ldots, \boldsymbol{\zeta}_I | \phi) &= \frac{ \prod\limits_{i=1}^I \left\{ \frac{\Gamma(\phi)}{\Gamma(\phi+K)}\phi^{L(\boldsymbol{\zeta}_i)} \prod\limits_{l=1}^{L(\boldsymbol{\zeta}_i)} \Gamma\left( n_l(\boldsymbol{\zeta}_i) \right) \right\} {1}(\boldsymbol{\zeta}_1, \ldots, \boldsymbol{\zeta}_I \in \Omega) } {1 - \sum\limits_{s=0}^{D+1} {I \choose s} \left(\frac{\Gamma(K)\Gamma(1+\phi)}{\Gamma(K + \phi)}\right)^{s} \left(1 - \frac{\Gamma(K)\Gamma(1+\phi)}{\Gamma(K+\phi)}\right)^{I-s} } , \end{align} $$
where  $\Omega $ is the set of possible
 $\{{\boldsymbol {\zeta}}_1, \ldots , {\boldsymbol {\zeta }}_I\}$ containing at least
 $D+1$ full stayers. The normalizing constant in (4) corresponds to the probability of the set
 $\Omega $ under the unrestricted model.
Note that the hyperparameter  $\phi $ plays a key role in controlling the number of stayers. Hence, rather than fixing it in advance, we attempt to learn it from the data by assigning it a hyperprior in such a way that the implied prior on
 $\theta $, the probability that any one legislator is a full stayer, is uniform (see Supplementary Material A for a closed-form expression for this prior). This choice is appealing for a variety of reasons. First, making
 $\theta $ random ensures that the model automatically adjusts for multiplicities (Scott and Berger Reference Scott and Berger2006, Reference Scott and Berger2010). This addresses concerns related to the large numbers of comparisons that are intrinsically being made by our model. Second, a uniform prior on
 $\phi $ implies a uniform prior on the number of stayers for all values of K, which avoids biases that might arise from the fact that there are many more configurations with around
 $I/2$ stayers than there are configurations with either a very small or a very large number of them.Footnote 10 Finally, under a uniform prior for
 $\theta $, and for the special case
 $K=2$, our model matches the one developed in Lofland et al. (Reference Lofland, Rodríguez and Moser2017). We assessed the sensitivity of the model to this prior choice by refitting the model using two alternative Gamma priors on
 $\phi $. First, we considered a Gamma prior with shape parameter 5 and scale 1, which implies a prior on
 $\theta $ that has mean 0.002 and 95% prior credible interval of (0, 0.014). Next, we considered a Gamma prior with shape parameter 0.075 and scale parameter 1, which implies a prior on
 $\theta $ with mean 0.90 and 95% prior credible interval (0.10, 1.00). The results were the same under all three priors.
In addition to priors on the indicator variables  $\boldsymbol {\zeta }_1, \ldots , \boldsymbol {\zeta }_I$, we need to specify priors for each component of the unique ideal points
 $\tilde {\beta }_{i,k,d}$,
 $i\in \{1,\ldots ,I\}, k \in \{1, \ldots , K\}, d \in \{1, \ldots , D\}$. As in Lofland et al. (Reference Lofland, Rodríguez and Moser2017), we assign these parameters independent Gaussian priors with common location and scale parameters,
 $\tilde {\beta }_{i,k,d} \mid \eta _d, \sigma _d^2 \sim \mathsf {N}\left ( \eta _d, \sigma _d^2 \right )$, where the hyperparameters
 $\eta _d$ and
 $\sigma _d^2$ are given independent, conditionally conjugate priors,
 $\eta _d \sim \mathsf {N}(0, 1)$ and
 $\sigma _d^2 \sim \mathsf {IGam}(2,1)$ for every
 $d \in \{1,\ldots ,D\}$. In terms of the bill-specific parameters, we follow the literature and work with conditionally conjugate priors,
 $\mu _j \mid \rho , \kappa ^2 \sim \mathsf {N} \left ( \rho , \kappa ^2 \right )$ and
 $\alpha _{j,d} \mid \omega _{d}, \tau ^2 \sim \omega _{d} \delta _{0} + (1 - \omega _{d}) \mathsf {N} \left ( 0, \tau ^2 \right )$ independently for all votes j and dimensions d, and where
 $\delta _{0}(\cdot )$ denotes the degenerate measure placing probability one at zero. The use of a zero-inflated prior for
 $\alpha _{j,d}$ enables us to automatically discount the effect of unanimous bills without explicitly dropping them from the analysis. Finally, the hyperparameters
 $\rho $,
 $\kappa ^2$,
 $\omega _d$, and
 $\tau ^2$ are given priors
 $\rho \sim \mathsf {N}(0, 1)$,
 $\kappa ^2 \sim \mathsf {IGam}(2,1)$,
 $\omega _d \sim \mathsf {Beta}(1, 1/d)$ and
 $\tau ^2 \sim \mathsf {IGam}(2,1)$. Besides being in line with priors that are widely used in the literature, our experience is that the model is also quite robust to the choice of these hyperparameters.
Ensuring that the scales associated with the different vote types, as the formulation introduced above does, is a nontrivial problem. Simply fitting independent models to each vote type would only allow us to compare identifiable quantities, such as the rank order of the legislators. However, as we have argued in the introduction, and illustrate in Section 5.4, comparing ranks can be very misleading, especially when the number of votes in each vote type is relatively small. One alternative approach a practitioner may be tempted to employ to ensure comparability is to use the same set of voters to anchor the ends of the scale for each vote group. For example, constraining party whips to be the extreme voters in each issue area. However, in such a strategy, the identity of the set of full stayers is assumed, rather than estimated. Therefore, one loses the ability to test the hypotheses that, for example, the whips are indeed stayers. Our model retains that ability. Second, if  $D>1$ and there are fewer than
 $D+1$ parties, then fixing two whips as anchors is not enough to get comparability. Lastly, while having two well-selected anchors when
 $D=1$ is enough for comparability of the scales, the question of how many full stayers there are in a given chamber is still important, both because (1) it leads to metrics like the
 $SF$ and
 $ASF$ that are interesting by themselves (see Sections 4 and 5.3 below), and (2) it implicitly reduces the number of parameters that need to be estimated.
2.1 Relationship with Standard Multidimensional Preference Models
One may naturally wonder about the relationship between the number of vote types, K, and the dimension of the policy space, D. In this section we show our model is not a special case of a standard multidimensional IRT model (except in the trivial cases when all legislators are stayers or  $K=1$). In particular, the specification in (2) with
 $D=1$ (which we use in our illustration) is not a special case of (1) with
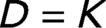 $D=K$. Instead we argue that it is better to think of our approach as one in which there is common space to measure preference in (even if the measurement is multidimensional). For example, a
 $K>1, D=2$ model places ideal points in two-dimensional space, but allows voters to have different (two-dimensional) ideal points in potentially K different domains of voting.
Note that the interaction term  $\boldsymbol{\alpha} _j^T \boldsymbol{\beta}_i$ in (1) has a simple bilinear structure in which one of the terms depends exclusively on the identity of the legislator, and the other depends exclusively on which measure is being voted on. This separable structure is a consequence of the assumption that the positions of legislators in the policy space are independent of the positions of the bills. This assumption underlies traditional spatial voting models, including IDEAL and NOMINATE. A further consequence of the independence assumption is that the matrix of factor loadings is the same for every legislator. That is, while each legislator has its own unique preferred policies, the weights associated with each of the dimensions on a given vote is the same for all legislators. Our model relaxes this assumption by allowing different loadings matrices for each legislator (see Equation 2).
A small example might be helpful in further clarifying the differences. Assume that there are only four measures to vote on (i.e.,  $J=4$), two for each of two vote types (i.e.,
 $K=2$), and only two legislators (i.e.,
 $I=2$). If the first legislator is a stayer but the second legislator has different ideal points for each vote type, the interaction terms associated with each of the four votes reduce to
 $$ \begin{align*}\left( \begin{matrix} \alpha_1 & 0 \\ \alpha_2 & 0 \\ \alpha_3 & 0 \\ \alpha_4 & 0 \\ \end{matrix} \right) \left( \begin{matrix} \beta_{1,1} \\ \beta_{1,2} \\ \end{matrix} \right) \quad\quad\quad \mbox{and} \quad\quad\quad \left(\begin{matrix} \alpha_1 & 0 \\ \alpha_2 & 0 \\ 0 & \alpha_3 \\ 0 & \alpha_4 \\ \end{matrix} \right) \left( \begin{matrix} \beta_{2,1} \\ \beta_{2,2} \\ \end{matrix} \right) \end{align*} $$
for the first and second legislators, respectively. By definition, standard IRT models cannot accommodate this type of structured interaction terms.
3 Clustering and Dimensionality
The model just introduced can be used to bear on the discussion of dimensionality of classical voting models, which has been a popular topic in the political science literature (see, e.g., Koford Reference Koford1989; Wilcox and Clausen Reference Wilcox and Clausen1991; Potoski and Talbert Reference Potoski and Talbert2000; Talbert and Potoski Reference Talbert and Potoski2002; Aldrich, Montgomery, and Sparks Reference Aldrich, Montgomery and Sparks2014; Dougherty, Lynch, and Madonna Reference Dougherty, Lynch and Madonna2014; Roberts, Smith, and Haptonstahl Reference Roberts, Smith and Haptonstahl2016).
What constitutes a dimension is surprisingly not widely agreed upon. In a common interpretation, each dimension is associated with a set of substantive issues (in two-dimensional models, typically economic and social issues). This interpretation relies on the often held—but rarely checked—assumption that voting dimensions align with the content of the bills.Footnote 11 However, at a technical level, the dimensionality of the voting is simply the number of latent traits required to accurately model legislators’ voting behavior. Hence, from a technical point of view, choosing the dimensionality of the policy space is essentially a model selection problem in which we aim to balance model fit with model complexity, and the dimensions in the latent space of a spatial voting model do not need not correspond to any politically relevant substantive issues. Recognizing this, Poole (Reference Poole2007) makes the useful distinction between a basic space and an issue space. In this section, we build on this distinction to provide an interpretation for our model in situations in which the indicators  $\gamma _{i,1}, \ldots , \gamma _{i,J}$ partition the bills into groups that correspond to substantive issues for each legislator i (such as in the illustration in Section 5).
Standard spatial voting models assume that every legislator has preferences over the same set of issues—that the dimension of the space is fixed and common. Motions load differently on each of these shared dimensions (however they are interpreted) to determine how a specific legislator votes. Therefore, the voting behavior of legislators for all motions can be explained as a linear combination of the latent features; bills ostensibly focused on substantive issues would be expected to have similar loadings on dimensions, and those loadings are the same for every legislator. In the specific case of a one-dimensional voting model, each vote can be explained by differentially weighting a single, legislator-specific latent trait. If the voting patterns for a substantial group of bills cannot be well explained in this way, then a two-dimensional voting model might be more appropriate. When the group of bills that is not well explained by the one-dimensional model happen to correspond to those bearing on a well-defined set of substantive issues, then the basic and issue spaces agree and the traditional interpretation of the dimensions of the latent space in terms of issues is appropriate. However, if the set of bills that require the additional dimension do not align with particular substantive issues, then the validity of this traditional interpretation of the dimensions is suspect and it becomes important to distinguish between the dimension of the basic space and the dimension of the issue space. Furthermore, in either case, if a dimension is added, it is added for all legislators even if this additional latent trait does not contribute to explaining the voting pattern of some voters. If that is the case, the corresponding ideal point on the added dimension will unnecessarily increase model complexity (via the number of parameters to be estimated for the legislators for which the additional dimension is irrelevant).
Our model works in a subtly different way. If linear combinations of a common set of low-dimensional latent traits are capable of explaining the voting behavior of most legislators for every substantive issue, our model will simply identify most of the legislators as full stayers. As discussed before, in that case our model corresponds to a traditional spatial voting model (as would be expected). However, if there is a subset of legislators whose voting pattern on certain groups of votes cannot be well explained through a common set of linear combinations of the latent traits, our model will introduce an additional set of legislator-specific ideal points. In the case in which the dimension of the basic space is  $D=1$, and the bill groups being compared reflect substantive issues, the total number of ideal points associated with these particular individuals can be interpreted as the dimension of their preferences (i.e., the dimension of legislator-specific issue spaces). In this way, our model allows us to investigate the interrelation between substantive issues and the intrinsic dimensionality of the policy space.
Finally, we discuss our model in light of the interpretation of dimensions in spatial models. Benoit and Laver (Reference Benoit and Laver2012) and De Vries and Marks (Reference De Vries and Marks2012) discuss theoretical, epistemological, and methodological issues when “dimensionalizing” political space. Broadly speaking, there are two approaches: a posteriori (inductive) and a priori. In the former dimensions are specified in advance of measurement/ estimation. Examples of such approaches include the policy-dimensions work of, for example, Clausen and Wilcox (Reference Clausen and Wilcox1987) and Wilcox and Clausen (Reference Wilcox and Clausen1991). In the latter, dimensions are estimated as latent traits, and interpreted ex post. The classical NOMINATE and related models are an example of this approach (Poole and Rosenthal Reference Poole and Rosenthal1985). In either approach, the key epistemological challenge is the same: “The ‘spaces’ of interest are ultimately metaphors and both the dimensions spanning these spaces and agents’ positions on these dimensions are fundamentally unobservable.” (Benoit and Laver Reference Benoit and Laver2012, p. 196) Our approach may the thought of as an intermediate compromise to the determination of “substantively relevant dimensions” in the language of Benoit and Laver (Reference Benoit and Laver2012), having both inductive and deductive components. Namely, we start with (strong) priors on the structure of the conceptual space (by placing each vote in exactly one category we are effective putting a prior of 100% that a vote v is of type g). And then inductively estimate the “… bundles of particular salient policy issues on which agents’ preferences are inter-correlated” (Benoit and Laver Reference Benoit and Laver2012, p. 205). This interpretation requires the vote-categories to be (at least prima face) related to dimensions spanning the conceptual space.
4 Estimation
Estimation of the model parameters is performed using a Markov chain Monte Carlo (MCMC) algorithm (Robert and Casella Reference Robert and Casella2005). To facilitate computation, we introduce auxiliary random variables
 $$ \begin{align*}z_{i,j} \mid \mu_j, \boldsymbol{\alpha}_j, \boldsymbol{\beta}_{i, k}, \gamma_j \sim \mathsf{N} \left( \mu_j + \boldsymbol{\alpha}_{j}^{T} \boldsymbol{\beta}_{i,\gamma_j} , 1 \right) , \end{align*} $$
such that  $y_{i,j} = 1$ if
 $z_{i,j} \ge 0$ and
 $y_{i,j} = 0$ otherwise (Albert and Chib Reference Albert and Chib1993). Conditional on these auxiliary variables, the full conditional distributions for
 $\mu _j$ and
 $\alpha _{j,d}$ follow a normal and an inflated normal distribution, respectively. Similarly, the parameters
 $\rho $,
 $\kappa ^2$,
 $\omega _d$, and
 $\tau ^2$ follow Gaussian, inverse gamma, beta, and inverse gamma posterior distributions, respectively. On the other hand, the indicators
 $\zeta _{i,k}$ and the unique ideal points
 $\tilde {\boldsymbol {\beta }}_{i,k}$ are sampled using a slight variant of the collapsed Gibbs sampler described in Neal (Reference Neal2000). The associated concentration parameter
 $\phi $ is sampled using a random walk Metropolis Hastings on the logarithmic scale. Finally, the hyperparameters
 $\eta _d$ and
 $\sigma _d^2$ have Gaussian and Inverse Gamma full conditional posterior distributions, respectively. To mitigate well-known issues with potential multimodality in mixture models, we execute multiple runs of the MCMC algorithm starting at overdispersed points, and monitor the (unnormalized) posterior distribution of the model, as well as the
 $ASF$ metric described below. Convergence for each of the chains is assessed using the criteria in Geweke (Reference Geweke, Bernardo, Berger, Dawid and Smith1992).
We use a number of summaries of posterior samples to address substantive questions of interest. One chamber-level summary we report is the average staying frequency,
 $$ \begin{align} ASF &= \frac{1}{I} \sum_{i=1}^{I}{1}( \zeta_{i,1} = \zeta_{i,2} = \cdots = \zeta_{i,K}) , \end{align} $$
that is, the proportion of full stayers. Values of the  $ASF$ close to 1 indicate that most legislators exhibit a single set of revealed preferences across all vote types. In particular, if
 $ASF = 1$ then our analysis of that particular set of votes is equivalent to fitting a D-dimensional IDEAL model to the data. Similarly, we also construct issue-specific
 $ASF$ metrics.
In addition to chamber-level measures of consistency we also construct micro-level metrics. These metrics involve the legislator-specific partitions of votes implied by the indicators  $\boldsymbol {\zeta }_{1}, \ldots , \boldsymbol {\zeta }_{I}$. We construct point estimates for the partitions by minimizing an expected loss function based on pairwise clustering probabilities,
 $D_{k,k',i} = \Pr ( \zeta _{i,k}=\zeta _{i,k'} \mid \mbox {Data})$ (see Lau and Green Reference Lau and Green2007 for details). As we discussed before, in the context of the application we introduce in Section 5, this partition provides information about the dimensionality of the issue space, and by extension, about how various substantive issues are correlated. Finally, we construct estimates of issue-specific legislators’ preferences,
 $\boldsymbol {\beta }_{i,k}$ in order to systematically characterize differences in voting patterns, both at the issue and the legislator levels.
4.1 Identifiability
Two key identifiability issues need to be addressed in order to utilize the posterior samples from the algorithm. The first one relates to the well-known label switching problem that arises in mixture models (Celeux Reference Celeux, Payne and Green1998; Stephens Reference Stephens2000). We avoid this problem by focusing our inference procedures on quantities that are invariant to the relabeling of the classes, such as  $ASF$,
 $D_{k,k',i}$, or
 $\boldsymbol {\beta }_{i,k}$. The second one relates to the arbitrariness of the latent scale on which preferences are being embedded. Indeed, although the use of a minimum number of stayers in our prior on
 $\boldsymbol {\zeta }_1, \ldots , \boldsymbol {\zeta }_I$ ensures that the different groups of bills share a measurement scale, that common scale is still arbitrary. To resolve this issue we add a further constraint by fixing the location of the first component of the ideal point vector for
 $D+1$ legislators (Rivers Reference Rivers2003). We call these legislators anchors (as opposed to the stayers discussed above in the context of linking the different latent scales together). For example, in the unidimensional setting (
 $D=1$) we might fix
 $\beta _{i_1,1} = -1$ and
 $\beta _{i_2,1}=1$, where
 $i_1$ and
 $i_2$ identify the whips of the two main parties in the legislature. These constraints are enforced by postprocessing the posterior samples, an approach sometimes referred to as parameter expansion (Liu, Rubin, and Wu Reference Liu, Rubin and Wu1998; Bafumi et al. Reference Bafumi, Gelman, Park and Kaplan2005). The identity of the anchors has no effect on the posterior inferences associated with
 $\boldsymbol {\zeta }_1, \ldots , \boldsymbol {\zeta }_I$ and, in our experience, only a negligible impact on inferences for the ideal points themselves (Lofland et al. Reference Lofland, Rodríguez and Moser2017).
5 Illustration: Voting Patterns by Policy Issue
We illustrate the model through an analysis of preferences in different policy domains using recorded votes from the  $97{\mbox {th}}$ to
 $114{\mbox {th}}$ U.S. House of Representatives (1981–2016). Motions brought to a vote in the U.S. Congress differ thematically by substantive issue (e.g., the economy, environment, criminal justice, etc.). We use the PAP main topic coding to categorize roll call votes by issue area (Adler and Wilkerson Reference Adler and Wilkerson2017; Policy Agendas Project 2017). This taxonomy, which consists of 20 mutually exclusive major topics (e.g., Macroeconomics, Health, Environment, etc.), has been used to study legislative agendas (Baumgartner and Jones Reference Baumgartner and Jones1993) and attention (Jones and Baumgartner Reference Jones and Baumgartner2005), among other matters.Footnote 12 We focus on the PAP categorization for two reasons. First, the application to issue areas illustrates the novel technical contributions of the model, namely (1) comparable revealed preferences across issues and (2) estimates of legislator-specific dimensionality. Second, as argued in Section 3, applying the model to votes grouped by issue area is relevant to the literature on dimensionality (Talbert and Potoski Reference Talbert and Potoski2002; Aldrich et al. Reference Aldrich, Montgomery and Sparks2014; Roberts et al. Reference Roberts, Smith and Haptonstahl2016) by providing issue-specific revealed preferences and an estimate of individual consistency—the posterior probably that a member has the same revealed preference in each issue area. However, we stress this is only an illustration of the model. We discuss possible additional applications to various questions in political science in Section 6.1.
We fit the model described in the previous sections independently to each of the 18 Houses mentioned above. We work with  $D=1$, which is both a common choice in the U.S. House (Poole, Rosenthal, and Koford Reference Poole, Rosenthal and Koford1991; Poole Reference Poole2007), and a convenient one in terms of model interpretation (recall our discussion in Section 3). We start the analysis from the early 1980s as this is comfortably after the reforms of the mid-1970s. We end in the
 $114{\mbox {th}}$ due to data availability. Because of the rarity of some topics, we only include topics that tend to consistently have at least 20 votes in most Houses. The resulting data-set has
 $K=17$ groups.Footnote 13 We have also removed from the dataset any legislator that missed more than 25% of the votes taken during the session.Footnote 14
5.1 Aggregate Analysis
Figure 1 presents the posterior mean of the  $ASF$ defined in Equation (5),
 $E \left [ ASF \mid \mbox {Data} \right ]$. The symbol and color of the points indicate the party on control of the chamber, while the grey area separate different presidencies. We can see that the staying frequency in the U.S. House of Representatives remained low and relatively stable during the Reagan and GWH Bush presidencies, but increased steadily after that. That is, until the early 1990s we find evidence of considerable differences in issue-specific preferences. The main exception to this pattern is the 112
 ${\mbox {nd}}$ House, when
 $ASF$ dropped sharply. The 112
 ${\mbox {nd}}$ House corresponds to the second half of the first term of President Obama. Not only was this a House in which the Republican party retook the chamber, but it also saw an influx of new legislators that rode the Tea Party wave into office. The willingness of these legislators to vote against their party leadership in a number of issues might explain the relatively low value of the
 $ASF$ during this session of the House.Footnote 15
Average Staying Frequencies ( $ASF$) for the 97
 ${\mbox {th}}$ to 114
 ${\mbox {th}}$ U.S. Houses. The symbol and color of the points indicate the party on control of the chamber, while the grey area separate different presidencies.

We can also disaggregate the  $ASF$ results across PAP issues. Figure 2 shows posterior means for issue-specific staying frequencies. To construct these frequencies, we define the base cluster for each legislator as their cluster of issues that contains the most votes. For legislators that are full stayers, all issues belong to their base cluster. We define issue-specific average staying frequencies as the probability that an issue belongs to a member’s respective base cluster, averaged over all legislators. These issue-specific
 $ASF$s can be interpreted roughly as the propensity for an issue to be “extra-dimensional.” Formally it is the posterior probability that an issue is deviant—exhibits different preferences from a member’s preferences in their base cluster. Overall, the pattern we observed for the full
 $ASF$ appears again for these issue-specific ones. However, the patterns change slightly with each issue. For example, while the most issue-specific
 $ASF$s fall substantially during the 112
 ${\mbox {th}}$ House, the drop is quite small for Public Lands and Law and Order. During the 104
 ${\mbox {th}}$ House, the issue-specific
 $ASF$ for the Civil Rights and Science issues drops substantially, while the
 $ASF$ for Public Lands increases substantially.
Probability of an issue being deviant (97 ${\mbox {th}}$ to 114
 ${\mbox {th}}$ Houses).

Jochim and Jones (Reference Jochim and Jones2013) examine the dimensionality of legislative choice in the House (1965–2004), with focus on the relationship between party unity and issue dimensionality. They do so by scale roll-call votes separately in each PAP major topic code (W-NOMINATE) and use subjective inspection of scree-plots to determine dimensionality of each issue over time (Cattell Reference Cattell1966). There, they distinguish between distributive policy (e.g., trade, agriculture, public lands) and social policy (e.g., civil rights and social welfare). They expect distributive issues to be multidimensional because distributive policy is important for constituencies and hence for reelection. As a result, distributive policies are less subject to party pressure (Deering and Smith Reference Deering and Smith1997).Footnote 16 They find distributive issues such as science, trade, agriculture, public lands, and transportation to be multidimensional issues and find issues associated with intervention in the economy like housing and macroeconomics to be consistently uni-dimensional, owing to partisan conflict.Footnote 17 We qualify these findings in a number of ways. First, while economic issues (e.g., housing, labor, macroeconomics) appear to be low-dimensional (high  $ASF$) at one point in time (e.g., since the 110
 ${\mbox {th}}$), they are not uniquely low-dimensional compared to other issue-areas and certainly were not always 1-D issues. For example, in the
 $99{\mbox {th,}}$ these issues were among the most multidimensional. Second, we disagree with their finding that Environment and International Affairs were stable (or even increasing in dimensionality). We find both have decreased in dimensionality (at least until the 111
 ${\mbox {th}}$ house).Footnote 18 Lastly, while we agree that in general, dimensionality has been decreasing over time, but we find that the reasons for doing so may be multiple. Figure 2 show that while the overall level of extra-dimensionality at the chamber level may be similar over time, the reasons for this might be much different. For example, the 104
 ${\mbox {th}}$ House is an example in which the dimensionality of issues varies enormously across issue-areas. Compare this to the 112
 ${\mbox {th}}$, which has roughly the same
 $ASF$. In the 112
 ${\mbox {th}}$, however, all issues have roughly similar issue-specific
 $ASF$.
5.2 Comparison with Multidimensional Spatial Models
Following our discussion from Section 3, one may wonder if our scaling technique is simply picking up extra dimensions estimated by traditional methods. That is, one may wonder if  $ASF$ is simply capturing variance that could otherwise be explained by introducing additional dimensions in the model. To demonstrate that this is not always the case, we present in Figure 3, a comparison of the variance in the votes explained by the first dimension of a W-NOMINATE model (Poole and Rosenthal Reference Poole and Rosenthal2000) to our
 $ASF$ metric.Footnote 19 The curve connects the different Houses in time, and is meant to help visualize the joint evolution of both metrics. The trajectory in Figure 3 suggests that
 $ASF$ is indeed capturing something other than the lack of goodness-of-fit of a traditional 1-D spatial model, particularly in more recent years. Indeed, while both metrics have tended to increase over the last 35 years, they have not always done so simultaneously. The most striking example of divergence comes during Barack Obama’s presidency, when the percentage of variability in the first dimension of W-NOMINATE remains high all along, but the
 $ASF$ swings widely. Other examples include the transition from the 98
 ${\mbox {th}}$ to 99
 ${\mbox {th}}$ Houses, which shows an example of voting becoming more unidimensional according to W-NOMINATE but with a decreasing
 $ASF$, and the transitions from the 97
 ${\mbox {th}}$ to 98
 ${\mbox {th}}$ and from the 104
 ${\mbox {th}}$ to 105
 ${\mbox {th}}$, where the
 $ASF$ remained approximately constant, but the percentage of variability in the first component of W-NOMINATE varied substantially. Likewise, in Reagan’s era (e.g., 97
 ${\mbox {th}}$–100
 ${\mbox {th}}$ Houses)
 $ASF$ is consistently low, but the adequacy of (and evidence for) uni-dimensional space as estimated by NOMINATE varies considerably. Taken together, it is clear that the two metrics are capturing different aspects of political conflict.
Ratio of the first eigenvalue to the sum of the first two eigenvalues from W-NOMINATE versus Average Staying Frequency (97 ${\mbox {th}}$ to 114
 ${\mbox {th}}$ Houses). Shape represents majority party during the corresponding House (Democrats in circles, Republicans in triangles). Line type represents presidential eras.

5.3 Legislator-Level Analysis
One of the key contributions of our approach is its ability to provide micro-level information about the behavior of specific legislators. To this end, we introduce the individual staying frequency of a legislator i:
 $$ \begin{align*}SF_i = \Pr(\zeta_{i,1} = \zeta_{i,2} = \cdots = \zeta_{i,K} \mid \mbox{Data}). \end{align*} $$
This quantity is the posterior probability that legislator i has consistent preferences across all domains of voting—that legislator i is a stayer.Footnote 20
We illustrate the legislator-level analysis using results from the  $111{\mbox {th}}$ House. We focus on this particular House for this detailed analysis because it is the one with the smallest number of movers, and therefore, the easiest one to understand. Figure 4 shows the posterior median associated with the ideal point estimate rank of legislators arising from the standard, uni-dimensional model in (1) (along the x-axis) along with 95% credible interval (in grey) for the 111
 ${\mbox {th}}$ House. All legislators with a
 $SF$ lower than 0.5 are highlighted, although only some of the identities are included for legibility. Legislators that are not highlighted have a
 $SF$ higher than 0.5 and are considered full stayers. We can see that movers are distributed across the ranks, with most of the Democratic movers being relative centrists, and most of the Republican movers being to the right of the party. As a complement, we present in Figures 5 and 6 the identity of the 50 legislators with the lowest and highest
 $SF$ values, respectively. The legislators with the lowest
 $SF$ values are more or less equally distributed among the two parties. Furthermore, many of the mover’s names are well known as individuals willing to buck their party and/or were cross-pressured by their constituency, for example, Young (R AK-1) who often appears as voting “deviant,” and Rohrabacher (a Republican from California known for expressing positions contrary to the Republican party at the time, e.g., on immigration and Russia) and Berry (a Blue Dog Democrat from Arkansas). On the other hand, the vast majority (
 $\sim 80$%) of the individuals with high
 $SF$ values belong to the Republican party.
Ideal point estimates for 111 ${\mbox {th}}$ House from a uni-dimensional model with “movers” (i.e., legislators exhibiting a
 $SF$ lower than 0.5) highlighted. There are 100 such legislators, only a subset of the names are included for readability.

Legislators with the lowest  $SF_i$ values during the 111
 ${\mbox {th}}$ House.

Legislators with the highest  $SF_i$ values during the 111
 ${\mbox {th}}$ House.

Our model not only provides information about the identity of movers, but also about the nature of the issues in which they are movers, and the direction of preference changes. Similar to the procedure we used to define issue-specific  $ASF$s, start by defining a member’s basic ideal point as their ideal point in their base cluster, and say a member has deviant preferences—preferences different than their basic ideal point—on issues not in their base cluster. Figure 7 compares member’s basic ideal point against the ideal points associated with four PAP issues for legislators in the 111
 ${\mbox {th}}$ House (Banking and Finance, Civil Rights, Government Operations, and Macroeconomics). More specifically, these ternary plots show the probability that a member’s ideal point in a specific issue is either left of, right of, or the same as their basic ideal point. An issue, g, is represented by three regions: the same revealed preference in that issue and a member’s base cluster (no move, on the top); revealed preferences for issue g more liberal than her base ideal point (leftward move, bottom left portion of a triangle); and revealed preference in issue g more conservative than her base ideal point (rightward move, bottom right). Legislators in the top no-move region have a posterior probability that their revealed preference for issue g is the same as their base ideal point greater than 0.5. If a legislator’s probability of moving is greater than 0.5, then we classify the direction of the move depending on which is more likely.
A selection of four issues in the 111 ${\mbox {th}}$ House, the name and direction of preference change.

Banking and finance is one example of an issue that exhibits clear and consistent partisan patterns of preference change. In particular, note that the vast majority of leftwards movers in this topic are Republicans, while the vast majority of rightward movers are Democrats. A similar pattern can be seen for Government Operations. We also observe issues on which members show no partisan or directional pattern of preference change, for example, macroeconomics.
We compare our illustration to Gerrish and Blei (Reference Gerrish and Blei2012b). While a direct comparison is not possible (as there voters have a main preference and issue-specific deviations), some of the insights provided by both models are similar.Footnote 21 Gerrish and Blei (Reference Gerrish and Blei2012b) find votes on appropriations, finance, energy, and public lands to have the most movement (issues for which issue-specific preferences deviate the most from members’ base preferences, roughly akin to our deviant issues). Likewise, they find that issues with the least amount of movement to be defence and military, education and foreign policy. Looking at the 111 ${\mbox {th}}$ House in particular, they find members preferences on Civil Rights to exhibit very little deviance from their base preference, which is somewhat different from our findings. We both, however, do find a considerable amount of movement/ deviance in the domain of Government Operations.
Figure 7 can also be used to track the behavior of specific legislators on different issues. We focus on two Representatives by way of example: Rep. Paul (R TX-14) and Rep. Young (R AK-1).Footnote 22 Representative Paul (R TX-14) is estimated to be an extreme conservative (Figure 4) and a member with many multiple issue-specific ideal points (Figure 5). Representative Paul exhibits more liberal preferences (than his basic preference) in Banking, Civil Rights, Government Operations, and Macroeconomics (Figure 7).Footnote 23 This is roughly consistent with his stated positions as a Libertarian. Conversely, Representative Young (R AK-1) is a moderate Republican (Figure 4) also with more than one ideal point (Figure 5). This member exhibits more conservative preferences on Microeconomics and more liberal preferences on Government Operations.
5.4 Validation
To provide some intuition and validation for the results discussed in the previous sections, the top panel of Figure 8 compares the (posterior median) ranks of voters in a particular vote-group (in this case, the ranking of member’s revealed preferences in the domain of Government Operations during the 111 ${\mbox {th}}$ House) obtained by fitting a 1-D IDEAL model to that subset of votes alone, to the (posterior median) ranks obtained by fitting a 1-D IDEAL model to the whole set of votes. Intuitively, we expect members that our model estimates as movers would depart significantly from the diagonal. This approach mimics a procedure that has become common practice in the literature to identify changes in revealed preferences. Then, the bottom panel of Figure 8 compares the (posterior median) rank in the particular vote-group as estimated by our model against the same (posterior median) ranks obtained by fitting a 1-D IDEAL model to the whole set of votes.
Comparison of posterior median ranks for legislators in the 111th House on Government Operations votes under various models (Democrats as circles; Republicans as triangles). Labled legislators correspond to those our model has identified as movers in this particular topic.

Both graphs make it clear that there is a group of Republican legislators (most notably, Paul [R TX-14], Chaffetz [R UT-3], McClintock [R CA-4], Linder [T GA-7], Lummis [R WY], Goodlate [R VA-6], and Gohmert [R TX-1]) that demonstrate less conservative preferences in votes related to Government Operations than they do on other votes.Footnote 24 However, there are also important differences between the two graphs. In particular, the graph that is based on our model is less noisy (bottom panel of Figure 8). This is because our joint model borrows information across voting domains to estimate the ideal points, leading to lower uncertainty.
In addition to providing initial validation our results, this simple example illustrates the challenges associated with using independent models for each issue as a tool to identify movers. In particular, it illustrates that the change in ranks for some of the legislators might be too small to be detected under the higher noise level associated with the relatively small samples involved with independent models. Figure 8 also highlights why attempting to address differences in voting preferences by visually comparing ranks across voting domains (rather than the underlying ideal points) can be quite misleading. For example, note that our model identifies as movers a number of relatively centrist legislators (such as Republicans Young [R TX-14] and Ros-Lehtine [R FL-27], and Democrats Davis [D TN-4], Driehaus [D OH-1], Ross [D AR-4], and Teagle [D NM-2]), whose ranks vary relatively little, particularly when compared against the large changes we observe for the group of Republican legislators discussed in the previous paragraph. These legislators would be particularly hard to identify as outliers in the top panel of Figure 8. Conversely, a number of Democrats near the median of the party exhibit large differences in the rankings across domains, but our model does not identify them as movers (as can be seen in the lower-left region of the graph in the top panel of Figure 8). A key issue to appreciate here is that the uncertainty associated with the estimates of ranks varies drastically. Generally speaking, the uncertainty associated with the rank of legislators that are close to the median voter of their own party tends to be much larger than the uncertainty associated with the ranks of centrist or radical legislators (Figure 4). Similarly, the uncertainty in the estimates of the ranks can vary substantially between parties (in the case of the 111 ${\mbox {th}}$, the uncertainty associated with the ranks of Democrats is much larger than that of Republicans). As a consequence, changes in ranks for centrist, partisans and Republicans are easier to identify. Additionally, it is worth stressing that the ranks of the different legislators are not independent variables: If a legislator becomes more extreme, others will necessarily become less so. Hence, comparing ranks as outlined above (as opposed to comparing ideal points) cannot establish the source of the change. While the discussion above only addresses the issue of validity in one domain, and for one House, a similar pattern can be seen in the rest of our analyses.
6 Discussion
We developed a novel Bayesian model extending classical ideal point estimation methods to enable the joint estimation of voters’ preferences across different domains of voting. The model places the resulting estimates of a member’s ideal point on each of K groups of votes on a common scale so that, for example, the revealed preferences of a member when voting on agriculture can be compared to their preferences on defense. The key innovation is to estimate, rather than assume, the identity of full stayers—voters with the same ideal point in all domains. This is achieved using a combination of mixture priors that ensure enough full stayers, along with classical identification techniques that anchors the scale.
We applied the model to the U.S. House of Representatives (97 ${\mbox {th}}$ to 114
 ${\mbox {th}}$) using PAP major topic codes to group votes. In this setting, we found that consistency of members’ preferences (the posterior probability that a member exhibits the same revealed preferences in different issue areas) varies over time. At a chamber-level, the consistency is generally low until the 106
 ${\mbox {th}}$/107
 ${\mbox {th}}$ House, when the chamber-level consistency increases dramatically (but with a notable exception in the 112
 ${\mbox {th}}$, see Figure 1). The reason for low preference consistency across issues also differs: many legislators may have deviant preferences on a small set of issues (as in the 104
 ${\mbox {th}}$); or there may be many issues that legislators show deviant preferences on (e.g., 112
 ${\mbox {th}}$, see Figure 2). Using the PAP grouping of votes, we explored how preferences differ across issues.
6.1 Other Potential Applications
We end with some possible applications of the model presented here in different avenues of study.
• Our estimation technique results in a common measurement of the revealed preferences of voters in different domains (this measurement might or might not be one-dimensional). This allows for a direct comparison across domains, to compliment indirect comparisons of behavior across domains. The commonality of the measurement (e.g., scale) allows for comparison of individuals (e.g., “does member X vote more liberally on issue A than on issue B?”) and of groups (e.g., “are parties more polarized/unified/dispersed on procedural votes than amendments or final passage?”). The latter question is important for both questions of party polarization (Roberts and Smith Reference Roberts and Smith2003; Theriault Reference Theriault2008; Duff and Rohde Reference Duff and Rohde2012) and legislative organization (Cox and McCubbins Reference Cox and McCubbins1993, Reference Cox and McCubbins2005).
• Our approach allows us to test sharp hypotheses. This is a new feature in the literature. For example, we may now formally test the claim “[t]he presence of departing members [in lame-duck sessions] created a legislative environment marked by increased ideological and participatory shirking…” (Nokken Reference Nokken2014, p. 440) by comparing ideal points in regular and lame-duck sessions estimated on a common scale.Footnote 25
• The methodology developed here is a kind of “partial pooling” model for roll-call votes/IRT scaling, resulting in more precise estimates (a feature analogous to the “information borrowing” found in multilevel models).
• Related, this approach provides a principled and unified approach to the “granularity” issue in the analysis of roll-call data (Crespin and Rohde Reference Crespin and Rohde2010; Roberts et al. Reference Roberts, Smith and Haptonstahl2016). The issue in that subliterature is the level of aggregation used in roll-call analysis.Footnote 26 It has been noted in the literature that the level of aggregation of roll-call votes used in ideal point estimation matters for the resulting dimensionality of the latent space (Crespin and Rohde Reference Crespin and Rohde2010).Footnote 27 The model presented here offers an alternative approach to the question of level-of-votes used. By scaling all votes together, but allowing votes to be distinguished by type (e.g., issue), we borrow information across vote types while maintaining a common scale, and allowing the dimensionality of the issue space to depend on the legislator.
• There are applications to the dimensionality of voting literature (Poole et al. Reference Poole, Rosenthal and Koford1991; Wilcox and Clausen Reference Wilcox and Clausen1991; Potoski and Talbert Reference Potoski and Talbert2000; Roberts et al. Reference Roberts, Smith and Haptonstahl2016). It is well-known that even though the overall structure of voting may be summarized via a unidimensional model, the underlying votes may not be (Crespin and Rohde Reference Crespin and Rohde2010; Dougherty et al. Reference Dougherty, Lynch and Madonna2014; Roberts et al. Reference Roberts, Smith and Haptonstahl2016). Less is known about the dimensionality of individual voter’s preferences. Our approach allows for estimation of legislator-specific dimensionality.
These methodological enhancements have several possible applications and allow for new questions to be asked. We list some here.
• First, we note that some theories of legislative committees posit (require, actually) that committee members are preference outliers relative to the floor (Denzau and Mackay Reference Denzau and Mackay1983; Shepsle and Weingast Reference Shepsle and Weingast1987; Weingast and Marshall Reference Weingast and Marshall1988). Some empirical tests of these claims rely on third parties’ assessments of members’ preferences (e.g., ADA scores, Krehbiel Reference Krehbiel1990). By grouping committee member’s votes by context (committee, floor), our approach allows for a direct comparison of voting in committee versus voting on the floor.In that setting, a kind of scarcity is present: all committee members (can) vote both in their committee and on the floor; but noncommittee members cannot vote in committee, only on the floor. Nonetheless, our approach allows for a direct comparison of committee members’ revealed preference with those when voting in committee to the floor (e.g., the median member’s ideal point on the floor). This is seemingly relevant for the committee-outlier debate in the House (Snyder Jr. Reference Snyder1992a, Reference Snyder1992b; Groseclose Reference Groseclose1994a, Reference Groseclose1994b; Brown et al. Reference Brown, Davis, Overby, Jr and Holian1997).Related, one could use the common scale arising from our estimator to study committee-floor voting and gate-keeping (Snyder Jr. Reference Snyder1992b) by comparing the position of ideal points revealed in committee to those revealed on the floor.
• Recently, we have used the common scale produced by our method to study the dynamics of polarization in the House (Moser et al. Reference Moser, Rodríguez and Lofland2019). There, we use the comparability of ideal points to study the dynamics of polarization in different procedural domains of voting. We find that voting on amendments contributes to increasing polarization in the modern House to a greater degree than previously found (Theriault Reference Theriault2008; Pump Reference Pump2010; Jessee and Theriault Reference Jessee and Theriault2014).
• Since estimation results in a partition of vote types (issues) for each member, one may perform a clustering analysis of issues. On which issues do members have the same revealed preferences (which issues appear in member’s clusters together)? Exploring these issue-associations over time may be of use for the study of issue-evolution (Clausen and Cheney Reference Clausen and Cheney1970; Carmines and Stimson Reference Carmines and Stimson1986, Reference Carmines and Stimson1990; Wilcox and Clausen Reference Wilcox and Clausen1991; Baumgartner et al. Reference Baumgartner, Breunig, Green-Pedersen, Jones, Mortensen, Nuytemans and Walgrave2009; Lee and Schutte Reference Lee and Schutte2017). Indeed, our approach could be used to integrate the a priori approach with the a postiori approach. Our model is hence useful for engaging with some of the fundamental research questions of the policy-dimensions approach: “… identify[ing] individual members and groups of members that deviate from a consistent ideological position. We can then explain these deviations in terms of substance: the limitations of the unidimensional view are revealed by the meaningfulness of the deviations from it. Such deviations are meaningful in terms of party, region, constituency, and philosophy of government” (Wilcox and Clausen Reference Wilcox and Clausen1991, p. 404).
• One could, in principle, examine the representative-constituency connection by, for example, regressing changes in revealed preferences in a specific policy (e.g., agriculture) on constituency characteristics, among others. We also note that most studies of issue-specific preferences (e.g., Clausen Reference Clausen1973; Wilcox and Clausen Reference Wilcox and Clausen1991; Anderson Reference Anderson2012) rely on extra-chamber factors, such as interests group ratings. Our approach could potentially contribute to that literature by providing estimates of issue-specific preferences that are comparable across issues.
• As we mentioned in Section 3, the approach taken here is useful for exploring the difference between the basic space and the issue space (Poole Reference Poole2007; Benoit and Laver Reference Benoit and Laver2012) by incorporating both inductive and deductive approaches to the interpretation of dimensions. Related, issue-specific preferences are a matter of interest for a number of scholars, for example, Clausen and Wilcox (Reference Clausen and Wilcox1987), Clausen (Reference Clausen1973), Sulfaro (Reference Sulfaro2000), Anderson (Reference Anderson2012), Jochim and Jones (Reference Jochim and Jones2013). The estimator developed here has potential usefulness to such scholars as it permits estimation of preference on a specific issue that is comparable to preferences on other issues.
• Lastly, we note that our approach permits new questions to be studied: when members exhibit different revealed preferences in different domains, why do they do so? For example, past scholarship has identified preferences over agricultural policy to be substantially different then general ideology (Mayhew Reference Mayhew1966; Hurwitz, Moiles, and Rohde Reference Hurwitz, Moiles and Rohde2001). We are now in a position to attempt to explain such differences quantitatively (our method gives a way to construct a quantitative “deviance” (of preference) on for example, agriculture. One could use this as a dependent variable in a regression on, for example, constituency attributes or other factors used in the representation literature (Miller and Stokes Reference Miller and Stokes1963; McCrone and Kuklinski Reference McCrone and Kuklinski1979; Peltzman Reference Peltzman1984; Poole and Romer Reference Poole, Romer, Rowley, Schneider and Tollison1993; Brennan and Hamlin Reference Brennan and Hamlin1999; Clinton Reference Clinton2006; Miler Reference Miler2010; Lapinski Reference Lapinski2013; Sulkin, Testa, and Usry Reference Sulkin, Testa and Usry2015; Miler Reference Miler2016).
Appendix A. Derivation of the Prior on the Concentration Parameter  $\phi $

Our goal is to select a prior for  $\phi $ such that the induced prior on
 $\theta =\frac {\Gamma (K) \Gamma (\phi +1)}{\Gamma (K + \phi )}$, the probability that any legislator is a stayer, follows a uniform distribution on the unit interval. The density of such prior must satisfy
 $p(\phi ) = \left | \frac {\mbox {d} \theta }{\mbox {d} \phi } \right |$, and has support on the
 $[0,\infty )$ interval. Now,
 $$ \begin{align*} \left| \frac{\mbox{d} \theta}{\mbox{d} \phi} \right| &= \Gamma(K) \left| \frac{\Gamma'(\phi+1)}{\Gamma(K+1)} - \frac{\Gamma(\phi+1)\Gamma'(\phi+K)}{\left[\Gamma(\phi+K) \right]^2} \right| \\ & = \Gamma(K) \frac{\Gamma(\phi+1)}{\Gamma(\phi+K)} \left| \frac{\Gamma'(\phi+1)}{\Gamma(\phi+1)} - \frac{\Gamma'(\phi+K)}{\Gamma(\phi+K)} \right| \\ & = \Gamma(K) \frac{\Gamma(\phi+1)}{\Gamma(\phi+K)} \left\{ \psi(\phi+K) - \psi(\phi+1) \right\} \\ & = \Gamma(K) \frac{\Gamma(\phi+1)}{\Gamma(\phi+K)} \left\{ \sum_{k=0}^{K-2} \frac{1}{\phi + k + 1} \right\}, \end{align*} $$
where  $\psi (\cdot ) = \frac {\Gamma '(\cdot )}{\Gamma (\cdot )}$ denotes the digamma function. Note that, for
 $K=2$, the prior reduces to
 $p(\phi ) = (\phi + 1)^{-2}$, a (shifted) Pareto distribution. Figure A1 shows the shape of this prior distribution for two different values of K. Note that the prior tends to concentrate more around zero for higher values of K. It is also worthwhile noting that, while this is a proper distribution, it is heavy tailed. Indeed, since
 $\Gamma (\phi +1)/\Gamma (\phi +K) = 1/Q_{K-1}(\phi )$, where
 $Q_{K-1}$ is a polynomial of degree
 $K-1$, this prior has only
 $\ K-2$ finite moments.
Prior distribution for the concentration parameter  $\phi $ for various values of K.

Appendix B. Number of Votes by Vote-Type, U.S. House of Representatives
Frequency of PAP major topic recorded votes by House. Source: Policy Agendas Project.

Acknowledgments
An earlier version of this work was presented at the 2017 Midwest Political Science Association Annual Conference under the title “Comparing Revealed Preferences Across Multiple Types of Motions in the 83rd to 112th, U.S. House of Representatives. This work has benefited from helpful comments from Marc Ratkovic, as well as from three anonymous referees. Abel Rodriguez was partially supported by award NSF-DMS 1738053 and 1740850.
Data Availability Statement
Replication code for this article has been published in Code Ocean, a computational reproducibility platform that enables users to run the code and can be viewed interactively at https://doi.org/10.24433/CO.5298256.v1 (Moser, Rodriguez, and Lofland Reference Moser, Rodriguez and Lofland2020a). A preservation copy of the same code and data can also be accessed via Dataverse at https://doi.org/10.7910/DVN/STH14F (Moser, Rodriguez, and Lofland Reference Moser, Rodriguez and Lofland2020b).



