Introduction
Growing demand for rare earth elements (REE; Y and La–Lu), due to their importance in modern technologies, sets a priority for exploring new ways of obtaining REE (especially in Europe) through searching for potential new deposits, with continuous improvement of extraction processes (Massari and Ruberti, Reference Massari and Ruberti2013; Nassar et al., Reference Nassar, Du and Graedel2015; Goodenough et al., Reference Goodenough, Wall and Merriman2018, Reference Goodenough, Deady, Beard, Broom-Fendley, Elliott, Van den Berg and Öztürk2021). Alkaline igneous rocks are currently the second major type of ‘hard rock’ type REE deposits (after carbonatites), which includes a large variety of differentiated rocks, ranging from oversaturated peralkaline granites to undersaturated nepheline syenites (Dostal, Reference Dostal2016, Reference Dostal2017; Goodenough et al., Reference Goodenough, Deady, Beard, Broom-Fendley, Elliott, Van den Berg and Öztürk2021; Beard et al., Reference Beard, Goodenough, Borst, Wall, Siegfried, Deady, Pohl, Hutchison, Finch, Walter, Elliott and Brauch2023). The main advantage of such deposits over carbonatites is the enrichment in Y and heavy rare earth elements (HREE), which are commonly accompanied by high-field strength elements (HFSE) such as Zr, Nb, Ta, Hf and Sc, particularly in the case of nepheline syenites (Sørensen, Reference Sørensen1992; Pollard, Reference Pollard1995; Salvi and Williams-Jones, Reference Salvi and Williams-Jones1996, Reference Salvi, Williams-Jones, Linnen and Samson2005; Dostal, Reference Dostal2017; Unluer et al., Reference Unluer, Budakoglu, Doner and Abdelnasser2023). Usually, the enrichment process in these rocks is related to fractionation during magmatic stages and/or post-magmatic metasomatic processes (Linnen et al., Reference Linnen, Samson, Williams-Jones and Chakhmouradian2014; Breiter and Skoda, Reference Breiter and Škoda2017; Ballouard et al., Reference Ballouard, Massuyeau, Elburg, Tappe, Viljoen and Brandenburg2020; Zozulya et al., Reference Zozulya, Macdonald and Bagiński2020, Reference Zozulya, Macdonald, Bagiński and Jokubauskas2022). The types of ore minerals and their composition impact directly on the costs of exploitation and the method of processing. Therefore, understanding the location characteristics of REE mineralisation in the host rock is one of the main challenges in assessing viable deposits.
In recent years, new projects have developed with the objective of the assessment of the REE deposits in Europe (Goodenough et al., Reference Goodenough, Schilling, Jonsson, Kalvig, Charles, Tuduri, Deady, Sadeghi, Schiellerup, Müller, Bertrand, Arvanitidis, Eliopoilos, Shaw, Thrane and Keulen2016). The Bohemian Massif in the Czech Republic is one of the areas of interest due to the presence of several examples of alkaline magmatism related to Palaeozoic tectonic movements (Schulmann et al., Reference Schulmann, Konopásek, Janoušek, Lexa, Lardeaux, Edel, Štípská and Ulrich2009). The present study focuses on the nepheline syenite forming dyke-like structures in the contact zone of the Čistá granodiorite intrusion located within the Bohemian Massif, which hosts a potential economic source of Zr–REE–Nb mineralisation (Klomínský, Reference Klomínský1963; Kopecký et al., Reference Kopecký, Chlupáčová, Klomínský and Sokol1997). The enrichment in HFSE (especially Zr and Nb) and REE in these rocks is probably caused by the combination of magmatic fractionation during the formation of the Čistá intrusion and strong hydrothermal activity that followed the magmatic events in the area (Kopecký et al., Reference Kopecký, Dobeš, Fiala and Šťovíčková1970; Žák et al., Reference Žák, Kratinová, Trubač, Janoušek, Sláma and Mrlina2011; Peřestý et al., Reference Peřestý, Lexa, Holder, Jeřábek, Racek, Štípská, Schulmann and Hacker2017; Deiller et al., Reference Deiller, Štípská, Ulrich, Schulmann, Collett, Peřestý, Hacker, Kylander-Clark, Whitechurch, Lexa, Pelt and Míková2021; Tvrdý et al., Reference Tvrdý, Dolníček, Ulmanová, Krátký and Nekl2021). The main goal of the present research was detailed geochemical characterisation of the REE-bearing accessory minerals, and determination of their response to metasomatic processes related to the late-to post-magmatic hydrothermal activity. Additionally, U–Th–Pb monazite-(Ce) geochronology was used to estimate the age of the primary mineralisation in the nepheline syenite and/or during the hydrothermal alteration.
Geological setting
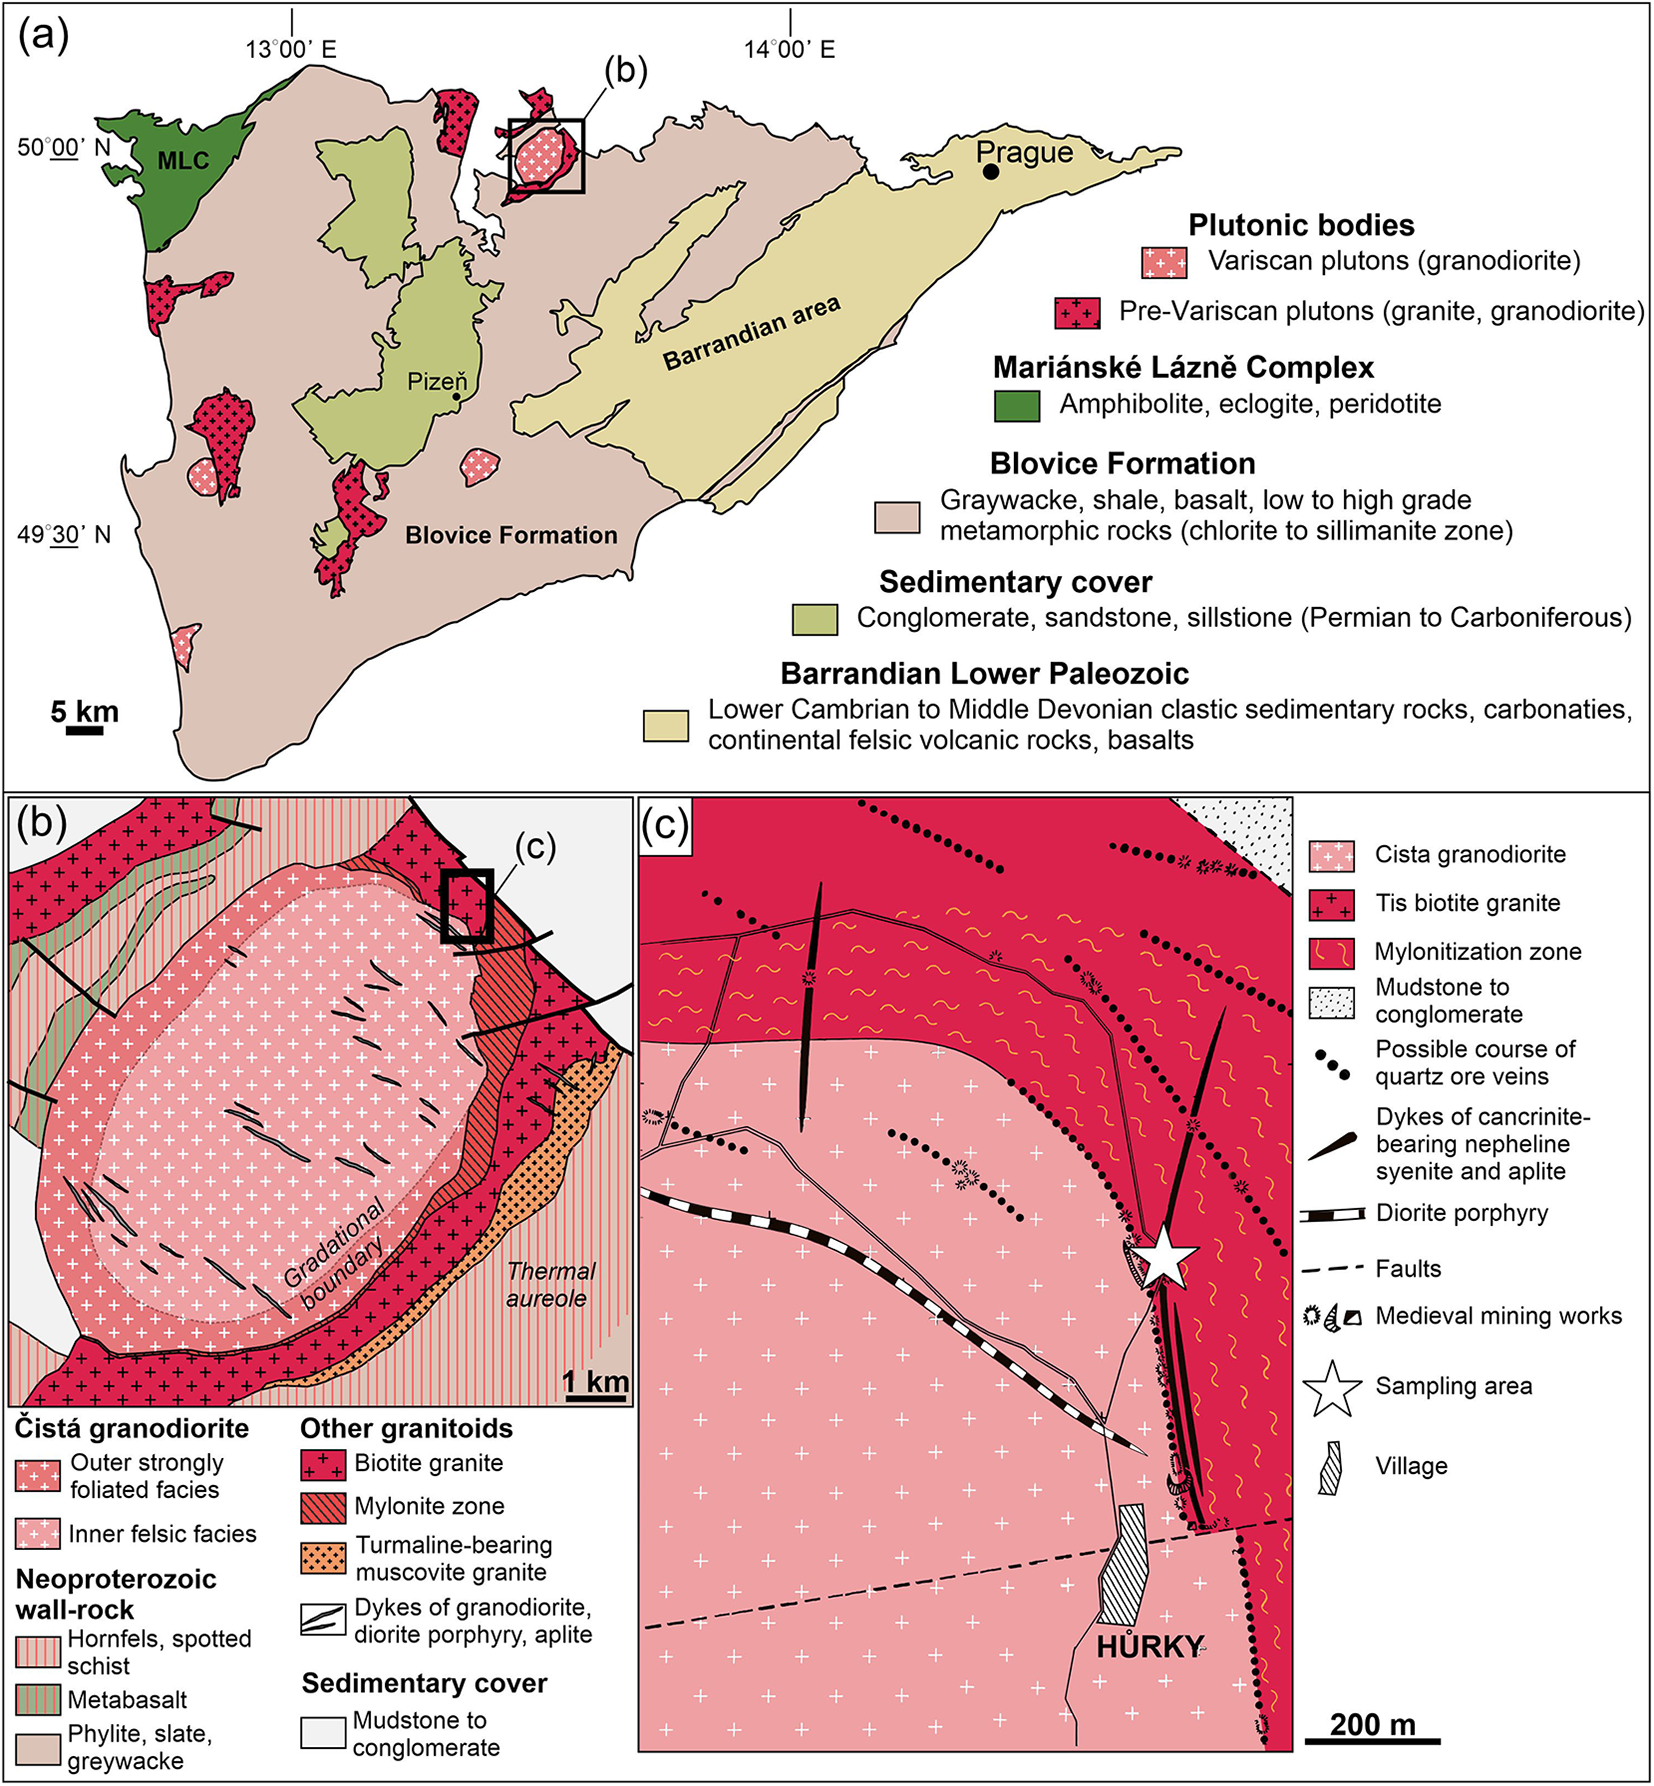
The Čistá granodiorite pluton is located in the north-central part of the Teplá–Barrandian Unit in the Bohemian Massif (Fig. 1a; Klomínský, Reference Klomínský1963, Reference Klomínský1966; Kopecký et al., Reference Kopecký, Chlupáčová, Klomínský and Sokol1997; Žák et al., Reference Žák, Kratinová, Trubač, Janoušek, Sláma and Mrlina2011, Reference Žák, Verner, Janoušek, Holub, Kachlík, Finger, Hajná, Tomek, Vondrovic and Trubač2014). The granodiorite intrusion, covering an area of 38 km2, has an elliptical shape with concentric and structural (gradational) zoning (Fig. 1b). A series of crosscutting NW–SE-trending dykes of granodiorite, diorite porphyry, and aplite runs through the body of the Čistá intrusion (Fig. 1b,c; Kopecký et al., Reference Kopecký, Chlupáčová, Klomínský and Sokol1997; Venera et al., Reference Venera, Schulmann and Kröner2000; Žák et al., Reference Žák, Kratinová, Trubač, Janoušek, Sláma and Mrlina2011).
(a) Simplified geological map of the Teplá-Barrandian Unit showing the location of Prevariscan and Variscan plutons (modified from Žák et al., Reference Žák, Kratinová, Trubač, Janoušek, Sláma and Mrlina2011). (b) Simplified geological map of the Čistá pluton region (modified from Žák et al., Reference Žák, Kratinová, Trubač, Janoušek, Sláma and Mrlina2011). (c) Geological sketch of the sampling area (white star) in the vicinity of the village of Hurky (modified from Klomínský et al., Reference Klomínský, Rieder, Kieft and Mráz1971).

The Čistá granodiorite stock intruded to the west into Neoproterozoic sequences of the Teplá-Barrandian Unit represented by phyllites, i.e. the low-grade metamorphic rocks, and to the east intruded a Cambrian (ca. 505 Ma) laccolith of the Tis biotite granite (Kopecký et al., Reference Kopecký, Chlupáčová, Klomínský and Sokol1997; Venera et al., Reference Venera, Schulmann and Kröner2000; Žák et al., Reference Žák, Kratinová, Trubač, Janoušek, Sláma and Mrlina2011). Pb-Pb single-zircon evaporation geochronolgy constrained an age of 373.1 ± 1.1 Ma of the Čistá granodiorite (Venera et al., Reference Venera, Schulmann and Kröner2000), whereas LA-ICP-MS U-Pb zircon age determination yielded concordia ages of 391 ± 1 Ma and 364 ± 2 Ma (Deiller et al., Reference Deiller, Štípská, Ulrich, Schulmann, Collett, Peřestý, Hacker, Kylander-Clark, Whitechurch, Lexa, Pelt and Míková2021). Geochemical data from the Čistá magmatic rocks linked the pluton genesis with the Mid- to Late-Devonian arc magmatism related to the tectonic movements in the subduction zone of the Teplá-Barrandian Unit. The youngest ages of ∼370–365 Ma were interpreted as the age of the Čistá pluton emplacement in the upper crust of the Teplá-Barrandian Unit (Deiller et al., Reference Deiller, Štípská, Ulrich, Schulmann, Collett, Peřestý, Hacker, Kylander-Clark, Whitechurch, Lexa, Pelt and Míková2021).
The Čistá pluton is surrounded by a thermal aureole, up to 3 km in width, developed within the Neoproterozoic wall rocks, which is characterised by hornfelses and spotted schists, potentially to some degree overlapping with the thermal aureole resulting from the previous intrusion of the Tis granite (Fig. 1b,c; Klomínský, Reference Klomínský1965; Kopecký et al., Reference Kopecký, Chlupáčová, Klomínský and Sokol1997). The intrusion of the Čistá granodiorite caused significant deformation of the Tis granite, especially at its north-eastern contact in the vicinity of Hůrky village (Klomínský, Reference Klomínský1961; Kopecký et al., Reference Kopecký, Dobeš, Fiala and Šťovíčková1970, Reference Kopecký, Šmejkal, Hladiková and Kopecký1987). The Tis granite acted as a ductile body, that was mylonitised and transformed into inhomogeneous orthogneisses up to a distance of several hundred metres from the contact with the Čistá granodiorite (Kopecký et al., Reference Kopecký, Chlupáčová, Klomínský and Sokol1997). In the mylonitised area, a series of alkaline dykes composed of aplite and cancrinite-bearing nepheline syenites developed (Fig. 1c).
Additionally, these radical changes induced strong, multi-stage, alkali-rich fluid metasomatism that mobilised significant amounts of REE and had the strongest effects on the rocks occurring in the mylonitisation zone (Klomínský, Reference Klomínský1963; Kopecký et al., Reference Kopecký, Dobeš, Fiala and Šťovíčková1970, Reference Kopecký, Chlupáčová, Klomínský and Sokol1997). As a result of these processes, REE–Zr–Nb-rich mineralisation was formed in the cancrinite-bearing nepheline syenites, with simultaneous hydrothermal sulfide mineralisation developed in the form of several quartz veins with sub-economic Mo, Ag and Au contents (Klomínský, Reference Klomínský1963; Kopecký et al., Reference Kopecký, Dobeš, Fiala and Šťovíčková1970, Reference Green and Pearson1987, Reference Kopecký, Chlupáčová, Klomínský and Sokol1997).
Sample description and analytical methods
The nepheline syenite was sampled near the village of Hůrky at the NE contact zone between the Čistá granodiorite and the Tis granite (50°04’47.1”N, 13°33’33.8”E), where it forms dykes striking in a N–S direction (Fig. 1b,c). The nepheline syenite is dark greyish, fine- to medium-grained, with linear textures highlighted by the mafic components and a brown weathering surface. In the outcrop, the nepheline syenite forms massive blocks varying in size, affected by a series of cracks. According to previous studies, the nepheline syenites contain aegirine (Kopecký et al., Reference Kopecký, Dobeš, Fiala and Šťovíčková1970, Reference Kopecký, Chlupáčová, Klomínský and Sokol1997) However, during our study, pyroxene minerals were not observed in the analysed thick sections. This might be due to the heterogeneous composition of the dykes and modal heterogeneity.
Back-scattered electron (BSE) imaging, observations of the microstructures, compositional X-ray maps and compositional measurements were conducted on polished and carbon-coated ∼100 µm thick sections using a JEOL SuperProbe JXA-8230 electron microprobe (EPMA) equipped with five wavelength dispersive spectrometers (WDS) at the Laboratory of Critical Elements AGH–KGHM (AGH University of Kraków, Kraków, Poland). The collected data were corrected to the ZAF procedure using JEOL software. The detailed conditions for EPMA measurements are listed in Supplementary Material Table S1.1.
A representative portion of the nepheline syenite was milled for whole-rock analysis by Actlabs (Activation Laboratories), Canada. Major and trace-element abundances were analysed using ICP-MS following a lithium metaborate/tetraborate fusion and dilute nitric digestion. LOI was determined by weight difference after ignition at 1000°C.
Isotopic analyses of monazite-(Ce) were conducted using a laser ablation-inductively coupled plasma mass spectrometry (LA-ICP-MS) U-(Th)-Pb technique with a Thermo Scientific Element 2 sector-field ICP-MS coupled to a 193 nm ArF excimer laser (Teledyne Cetac Analyte Excite laser) at the Institute of Geology of the Czech Academy of Sciences, Prague, Czech Republic. Analytical details are provided in Supplementary Material Table S1.2. Reproducibility and age uncertainty of reference materials were propagated for all data involving the concordia age calculation following the recommendation of Horstwood et al. (Reference Horstwood, Košler, Gehrels, Jackson, McLean, Paton, Pearson, Sircombe, Sylvester, Vermeesch, Bowring, Condon and Schoene2016). Residual elemental fractionation and instrumental mass bias were corrected by normalisation to the natural TS-Mnz monazite from Arendal (Norway) with an ID-TIMS 207Pb/235U age of 910.42 ± 0.34 Ma (Budzyń et al., Reference Budzyń, Sláma, Corfu, Crowley, Schmitz, Williams, Jercinovic, Kozub-Budzyń, Konečny, Rzepa and Włodek2021a). The monazite reference materials, Itambe (TIMS 207Pb/235U age of 506.4 ± 0.7 Ma, Gonçalves et al., Reference Gonçalves, Lana, Scholz, Buick, Gerdes, Kamo, Corfu, Marinhof, Chaves, Valeriano and Nalini2016) and Bananeira (TIMS 207Pb/235U age of 507.7 ± 1.3 Ma, Gonçalves et al., Reference Gonçalves, Lana, Scholz, Buick, Gerdes, Kamo, Corfu, Marinhof, Chaves, Valeriano and Nalini2016) were analysed periodically during measurements for quality control. No common Pb correction was applied to the data due to the significant Hg contamination of the commercially available He carrier gas, which precludes accurate correction of the interfering 204Hg on the low signal of 204Pb. The U–Pb and Th–Pb data are presented on plots generated using ISOPLOT v. 4.16 (Ludwig, Reference Ludwig2012).
Sample preparation for transmission electron microscopy (TEM) investigations was performed using focused ion beam (FIB) milling with a HELIOS G4 UC FIB/SEM system at the German Research Centre for Geosciences (GFZ Potsdam). Areas of interest, 20 × 2 μm in size on two thick sections, were selected. The final size of the FIB foils cut directly from the carbon-coated thick sections was ∼20 μm × 10 μm × 0.1 μm (see Wirth, Reference Wirth2004, Reference Wirth2009 for details of the sample preparation). The TEM investigations were conducted using a FEI Tecnai G2 F20 X-Twin TEM with a Schottky field emitter as an electron source. The TEM was equipped with a Fishione high-angle annular dark field detector, an EDAX X-ray analyser and a Gatan electron energy-loss spectrometer. The TEM procedure follows that used in a previous study (Budzyń et al., Reference Budzyń, Wirth, Sláma, Birski, Tramm, Kozub-Budzyń, Rzepa and Schreiber2021b).
Results
Mineralogical and textural characterisation
The main mineral assemblage of the syenite consists of albite, K-feldspar (microcline), feldspathoids, mainly nepheline partially replaced by cancrinite and, to a lesser degree, analcime, and biotite (annite). Common accessory minerals include zircon, monazite-(Ce), monazite-(La), pyrochlore, fergusonite-(Y), allanite-(Ce), fluorcalciobritholite-(Ce), bastnäsite-(Ce), britholite-(Ce), gadolinite-(Ce), gadolinite-(Y), ThSiO4 (thorite or huttonite, not distinguishable due to irradiation damage) and cerianite. Zircon forms subhedral grains, up to a few hundred microns in size, that are strongly altered and show irregular zoning in high-contrast BSE imaging. Zircon contains numerous inclusions of secondary minerals (the alteration processes of zircon are the subject of a separate study and are not discussed here in detail). In most cases, the accessory minerals form polymineralic microstructures, where REE-bearing phosphates, silicates, carbonates, and oxides are intergrown with K-feldspar, albite, biotite and, occasionally, zircon or Fe oxides. Most of the REE and Nb mineralisation in the nepheline syenite occurs in these microstructures. Detailed descriptions of the REE-bearing minerals are given below. Results of the EPMA compositional measurements of major and accessory minerals are presented in the Supplementary Material Tables S2.1–S2.8.
Whole-rock composition of the Čistá nepheline syenite
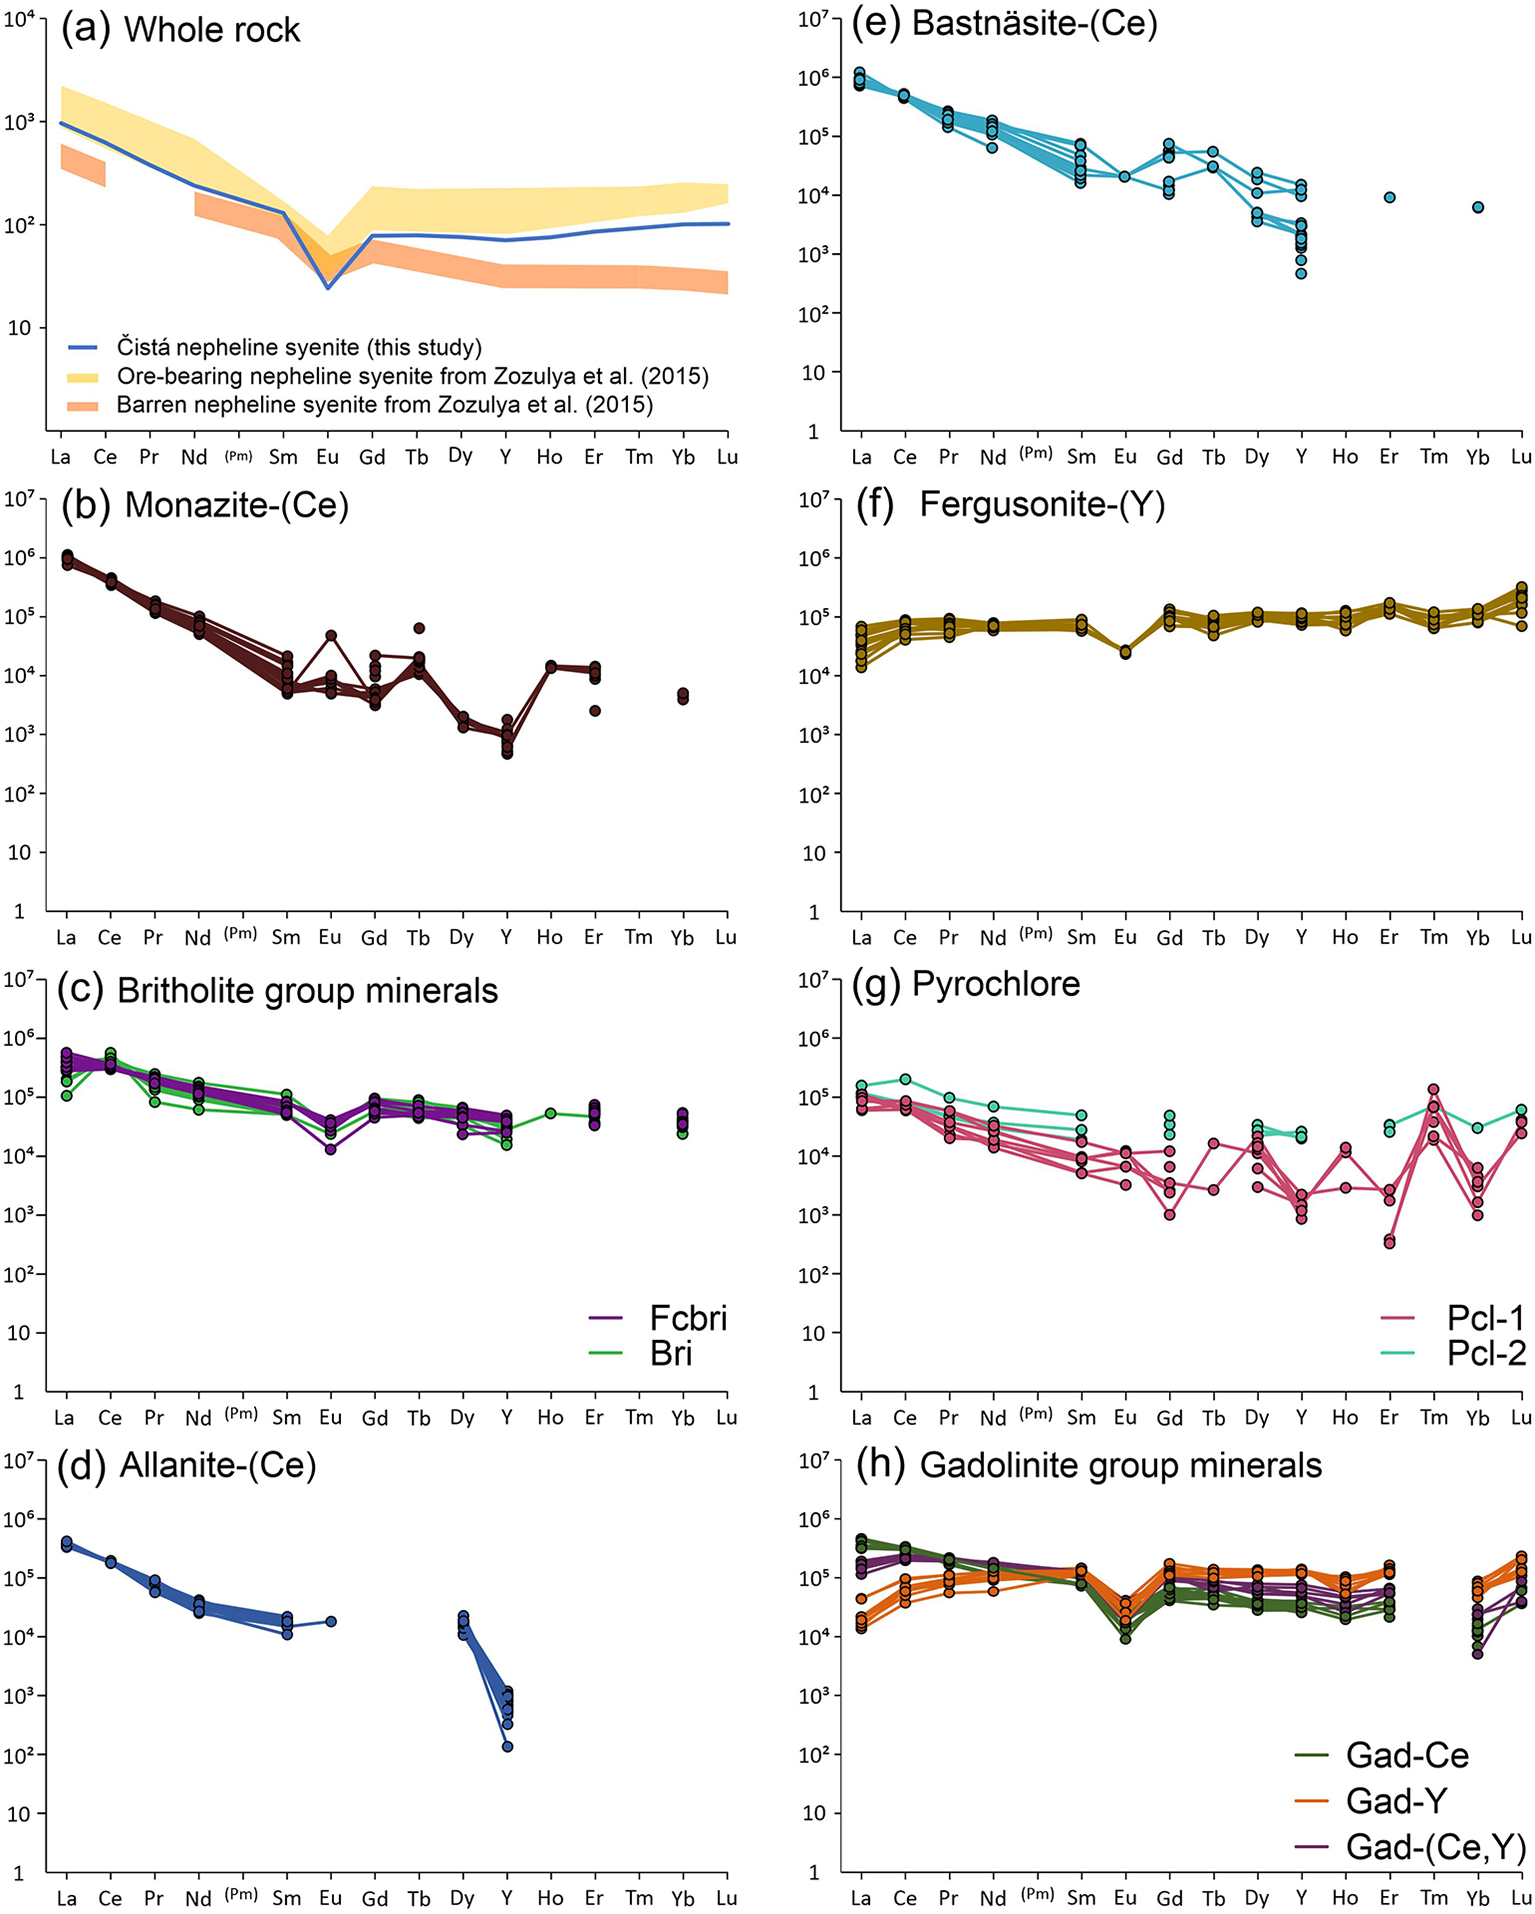
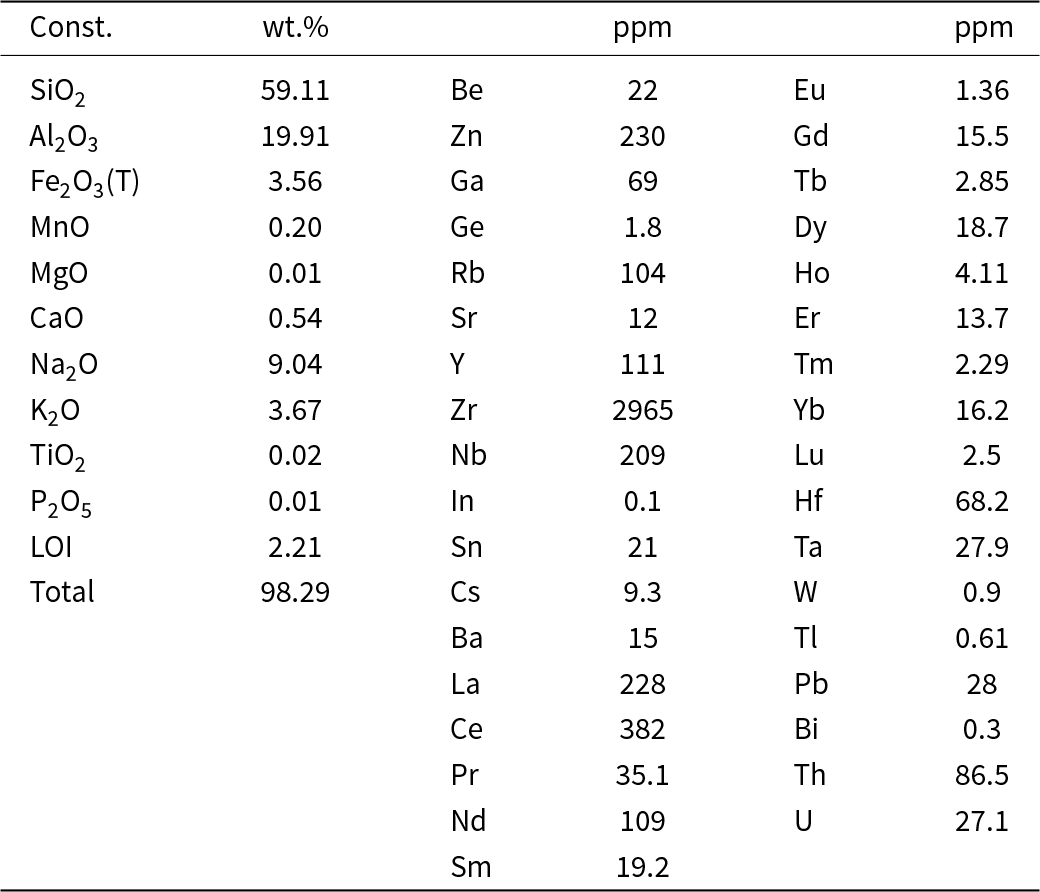
The bulk composition of the nepheline syenite is 59.11 wt.% SiO2, 19.91 wt.% Al2O3 and 3.56 wt.% Fe2O3(total), with high concentrations of alkali components, i.e. 9.04 wt.% Na2O and 3.67 wt.% K2O, and small amounts of 0.54 wt.% CaO (Table 1). The modified alkali-lime index (MALI = Na2O + K2O – CaO; Frost et al., Reference Frost, Barnes, Collins, Arculus, Ellis and Frost2001) value of 12.17 confirms the alkaline character of the sample. Based on the alkalinity index (A/CKN = molar Al/(Ca +Na +K)) and the peralkalinity index (A/NK = molar Al/(Na + K); after Maniar and Piccoli, Reference Maniar and Piccoli1989), the sample with A/CKN = 1.00 and A/NK = 1.06 is classified as slightly peralkaline to mildly peraluminous. In addition, the nepheline syenite is strongly ferroan with an Fe index (Fe# = Fe2O3(Total)/(MgO + Fe2O3(Total)); after Whalen et al., Reference Whalen, Currie and Chappell1987) value of 0.99. Trace-element concentrations in the bulk-rock composition gave elevated concentrations of HFSE, i.e.: 2965 ppm Zr; 209 ppm Nb; 961 ppm REE (including Y); 27 ppm U; and 86 ppm Th (Table 1). Light rare earth elements (LREE) are enriched compared to HREE, i.e. 774 ppm vs. 186 ppm, respectively, with a LaN/YbN ratio of 9.56. The chondrite-normalised distribution pattern has a decreasing slope from La to Gd with a strong negative Eu anomaly (Eu/Eu* = 0.22), and nearly flat HREE pattern with slight increase from Gd to Lu (Fig. 2a). Based on the main mineral composition, including feldspathoids, and the HFSE enrichment, in particular Zr, Nb and REE, the sample can be described as agpaitic. However, the lack of strong peralkalinity with its index barely above 1 (A/NK = 1.06) reflects more balanced conditions between the alkalis and alumina in the system; therefore, the transitional agpaitic type should better match the syenite studied.
Chondrite-normalised REE distribution patterns for (a) whole-rock and (b–h) REE-bearing accessory minerals. C1 chondrite composition after McDonough and Sun (Reference McDonough and Sun1995). (a) The average compositions of ore-bearing (yellow) and barren (orange) nepheline syenite are given as a comparison to similar mineralisation in the nepheline syenites from the Sakharjok deposit from Zozulya et al. (Reference Zozulya, Lyalina and Savchenko2015). Mineral-name abbreviations after (Warr, Reference Warr2021): Bri – britholite-(Ce), Fcbri – fluorcalciobritholite-(Ce), Gad-Ce – gadolinite-(Ce), Gad-Y – gadolinite-(Y), Gad-(Ce,Y) – solid-solution of gadolinite-(Ce) and gadolinite-(Y), Pcl1 – first generation pyrochlore, Pcl2 – second generation pyrochlore.

Bulk rock composition of the Čistá nepheline syenite

Notes: Sc, V, Cr, Co, Ni, Cu, As, Mo, Ag and Sb values below the detection limit
REE-bearing accessory minerals
Monazite-(Ce)
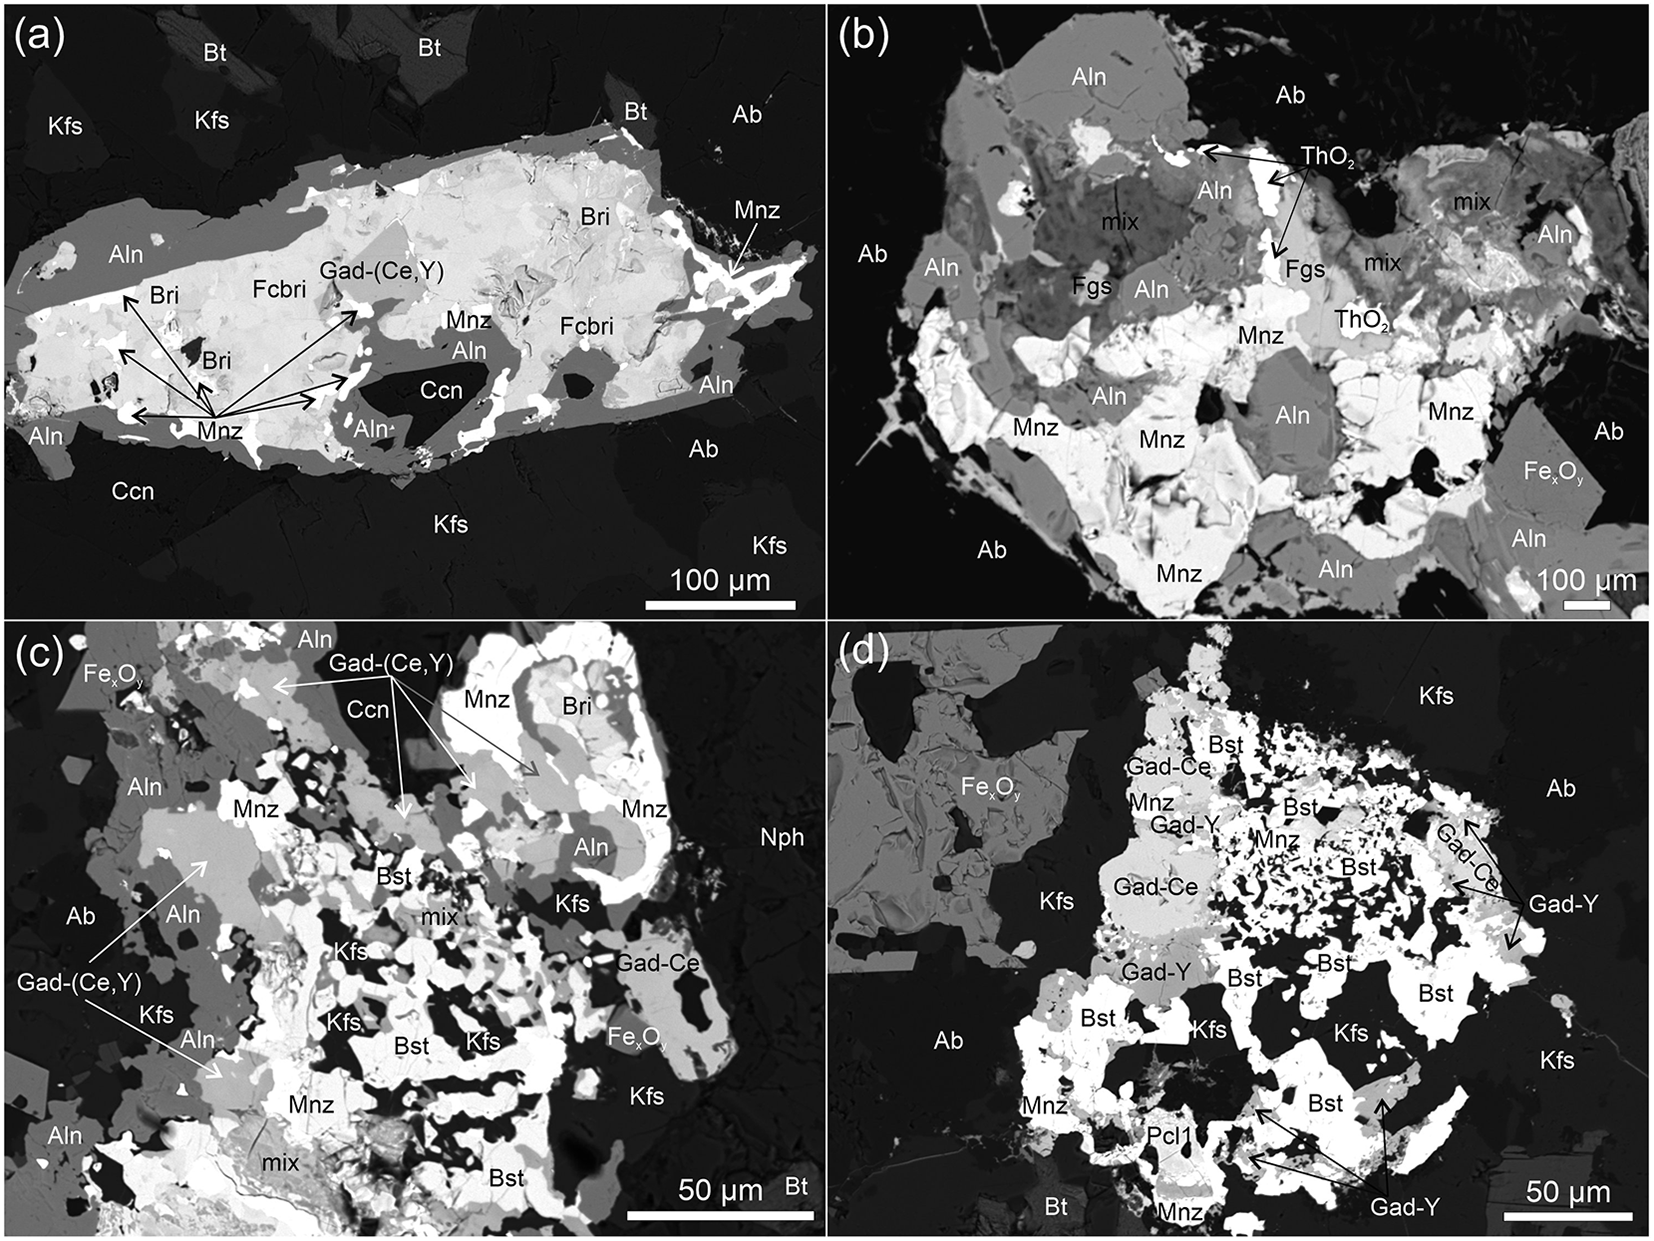
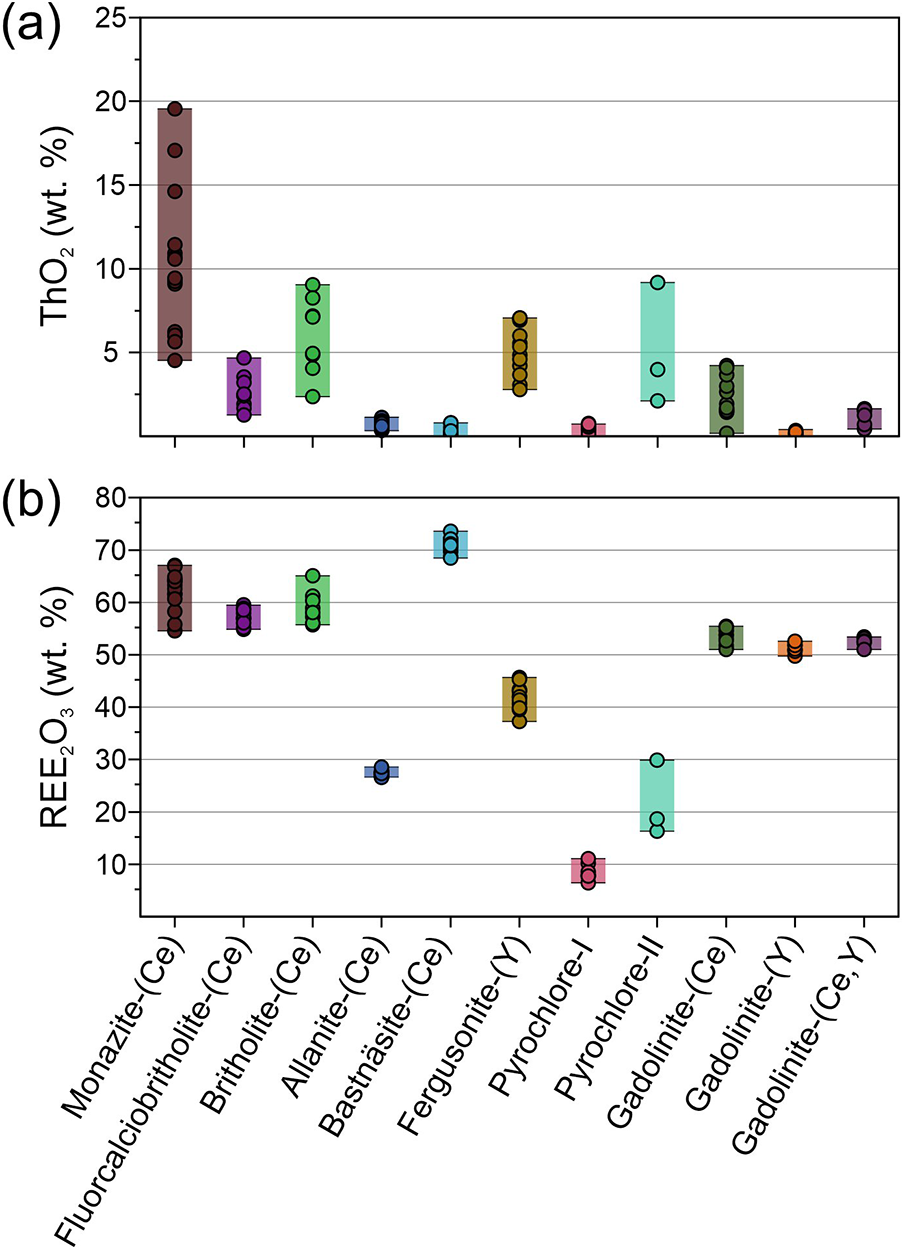
Monazite-(Ce) forms irregular grains of ∼10–50 µm in size, which occur commonly in the aggregates of REE-bearing accessory minerals (Figs 3, 4), although individual grains are also occasionally present. Monazite-(Ce) contains 54.7–67.3 wt.% REE2O3 (Fig. 5b), which are dominated by Ce and La (24.8–32.4 wt.% Ce2O3, 20.9–31.1 wt.% La2O3; Supplementary Material Table S2.1). Monazite-(Ce) is the dominant type, with rare occurrences of monazite-(La). Monazite-(Ce) grains contain minor U (up to 0.11 wt.% UO2) and variable amounts of Th (4.5–19.5 wt.% ThO2; Fig. 5a), with high Th/U ratios in the range 87.3–266.5. Elevated amounts of ThO2 in the monazite-(Ce) are related primarily to the substitution of a huttonite (ThSiO4) component (1.3–5.3 wt.% SiO2) rather than that of cheralite (CaTh(PO4)2; <0.29 wt.% CaO). Chondrite-normalised REE distribution patterns are typical of monazite-(Ce), with the presence of a positive Eu anomaly (Eu/Eu* ranging from 0.75 to 11.06; Fig. 2b) and a steep slope in the REE distribution pattern from La to Sm (LaN/SmN ratios of 109.38–201.16), reflecting the lesser amount of middle rare earth elements (MREE) and HREE (Supplementary Material Table S2.1).
(a–d) BSE images showing examples of microstructures with aggregates of REE-bearing minerals in the nepheline syenite. Mineral-name abbreviations after Warr (Reference Warr2021): Ab – albite, Aln – allanite-(Ce), Bt – biotite, Ccn – cancrinite, Fgs – fergusonite, Kfs – K-feldspar, mix – fine-grained mixture of phases (britholite, bastnäsite, apatite), Mnz – monazite-(Ce) and Nph – nepheline.

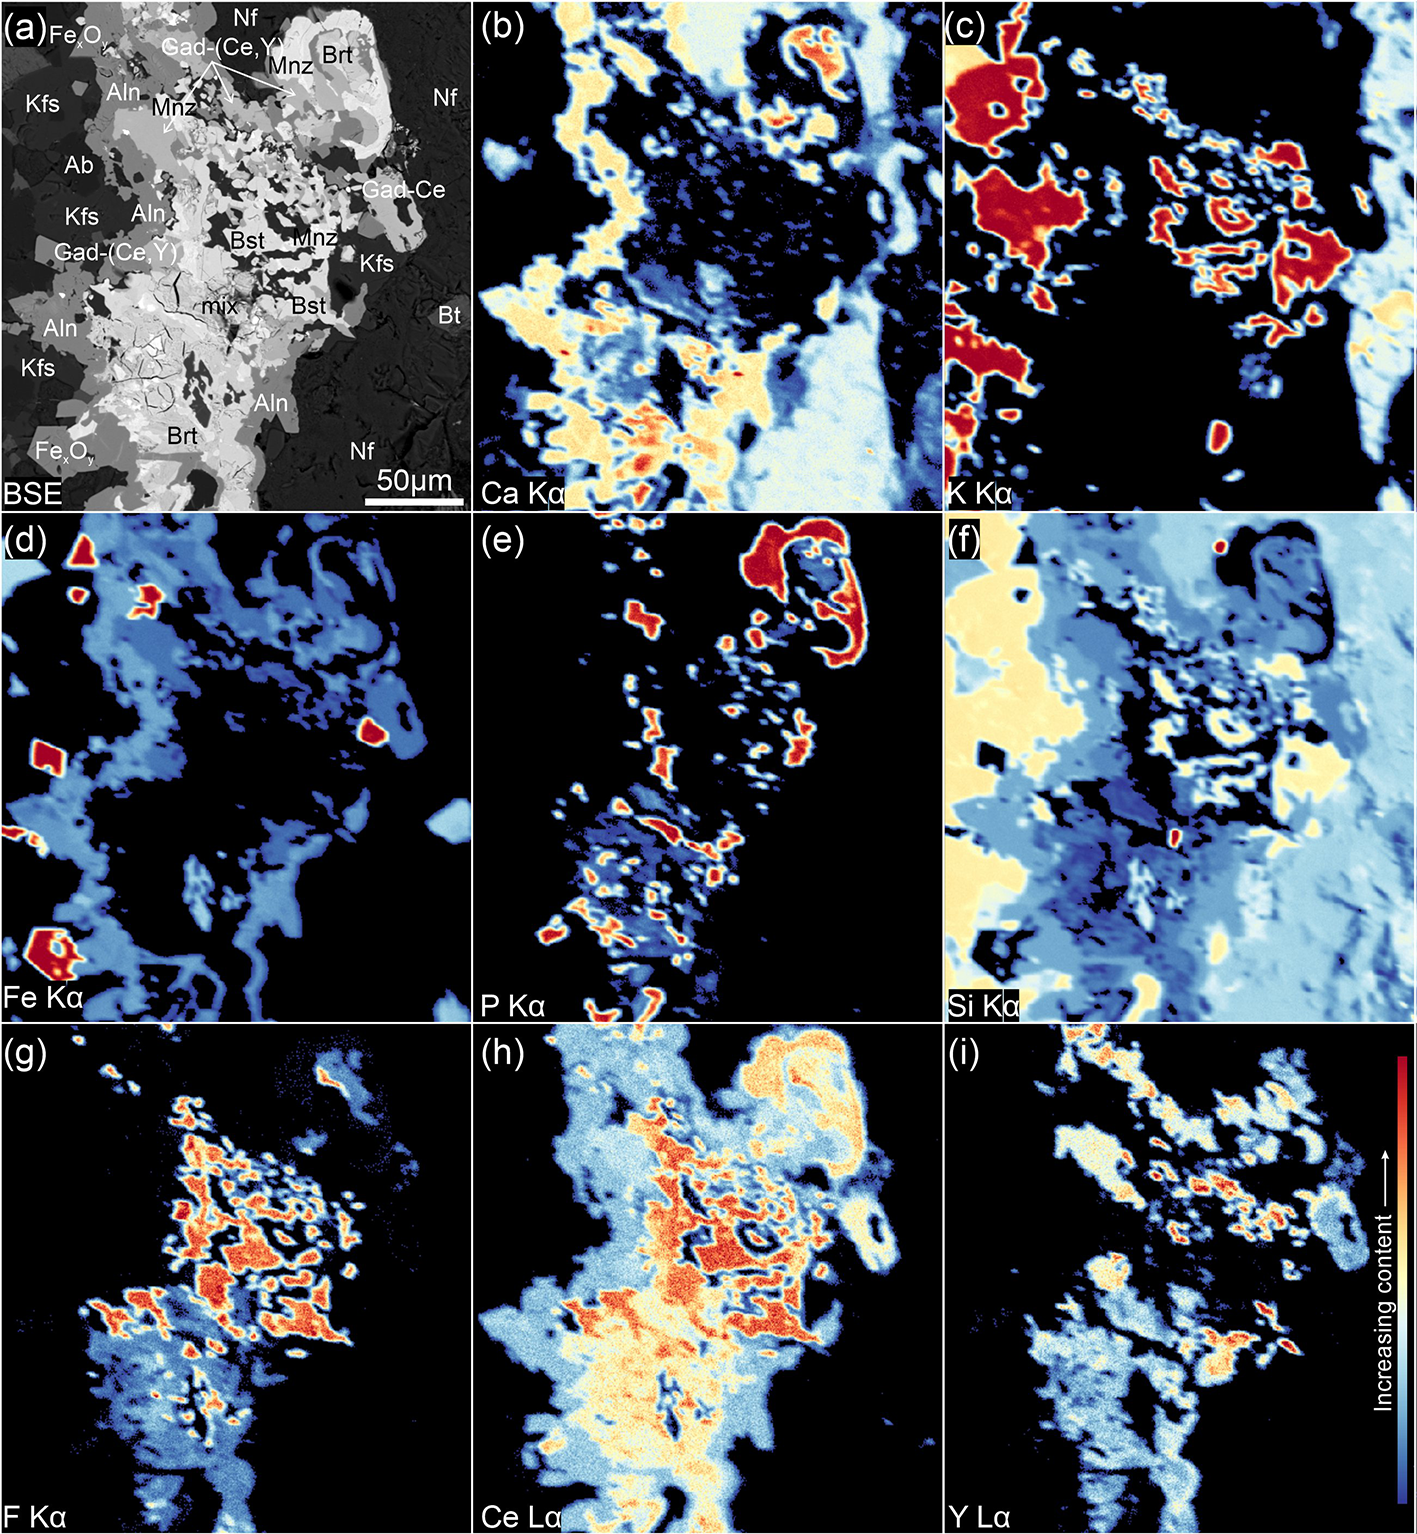
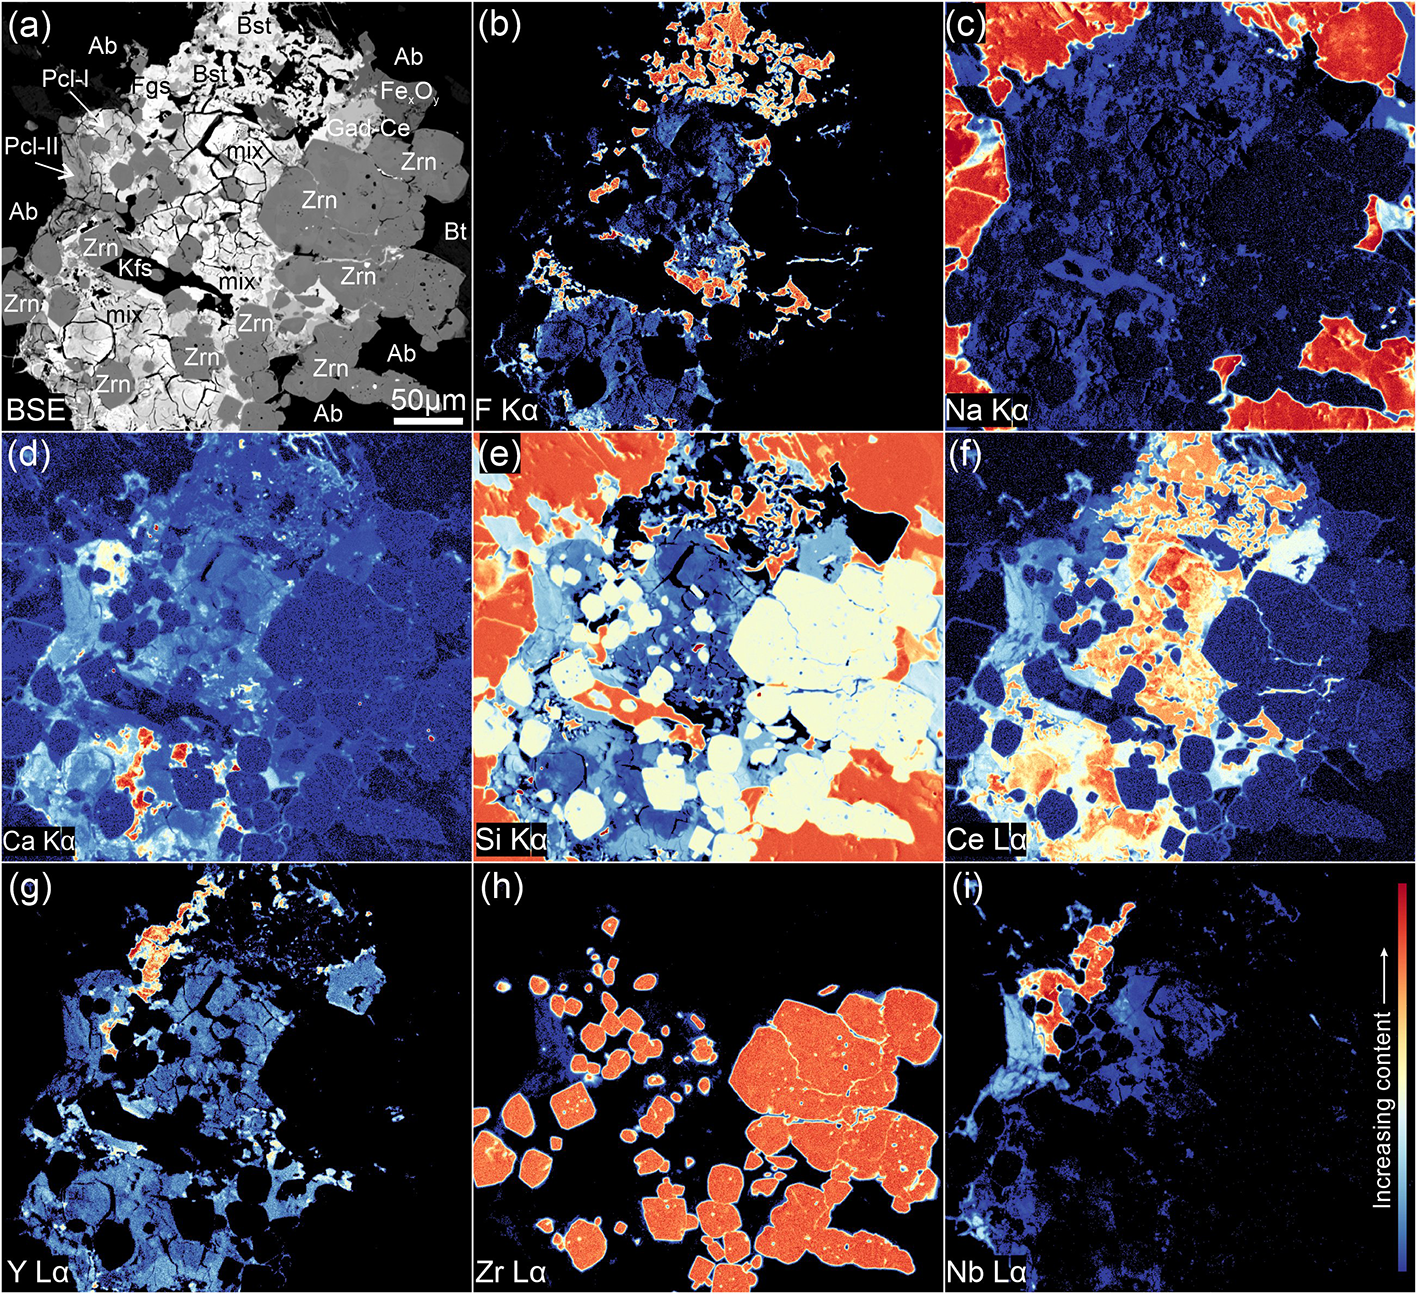
BSE image (a) and compositional X-ray WDS maps (b–i) of the REE-bearing accessory minerals aggregate.

Diagrams representing the concentrations of: (a) ThO2 and (b) REE2O3 in the REE-bearing accessory minerals.

Britholite-group minerals
Fluorcalciobritholite-(Ce) and britholite-(Ce) are the two members of the britholite-group occurring in the Čistá nepheline syenite. Fluorcalciobritholite-(Ce) and britholite-(Ce) are usually intergrown with monazite-(Ce) or occur in the intersections between other REE-bearing minerals (Figs 3a,c, 4). Both britholite-group minerals have a heterogeneous composition of major elements, with britholite-(Ce) showing smaller concentrations of Ca (0.4–2.7 wt.% CaO), P (0.2–2.7 wt.% P2O5) and F (0.6–1.4 wt.%) compared to fluorcalciobritholite-(Ce) (10.4–12.1 wt.% CaO; 1.2–4.1 wt.% P2O5; 2.6–3.2 wt.% F; Supplementary Material Table S2.2). The trace-element composition of britholite-group minerals is characterised by high concentrations of REE ranging from 54.8 to 65.1 wt.% REE2O3 (Fig. 5b) and share similar chondrite-normalised REE distribution patterns, consisting of a subtle negative slope from the LREE towards the HREE (LaN/YbN ranging from 2.69 to 15.93), as well as a weak negative Eu anomaly (0.31–0.50 Eu/Eu*, where Eu was above detection limit; Fig. 2c). Britholite-(Ce) has higher concentrations of Ce than fluorcalciobritholite-(Ce) (23.9–40.7 vs. 21.5–26.2 wt.% Ce2O3, respectively), and also higher Th contents (2.4–9.0 wt.% vs. 1.3–4.7 wt.% ThO2, respectively; Fig. 5a; Supplementary Material Table S2.2). In addition, britholite-(Ce) occasionally contains elevated concentrations of Al2O3 (0.4–4.3 wt.%), which might be related to impurities and nanoscale inclusions. Low analytical totals in the EPMA data for britholite-(Ce) (85.1–92.1 wt.%; Supplementary Material Table S2.2) suggest the presence of structural water. The britholite-group minerals commonly form fine grains distributed irregularly in the aggregates of REE-bearing minerals; therefore we cannot excluded the possibility that the analytical data are partially compromised by the presence of submicron grains of other phases not detected using BSE imaging and possibly dispersed in the volume of the analysed material (Figs 3c, 4).
Allanite-(Ce)
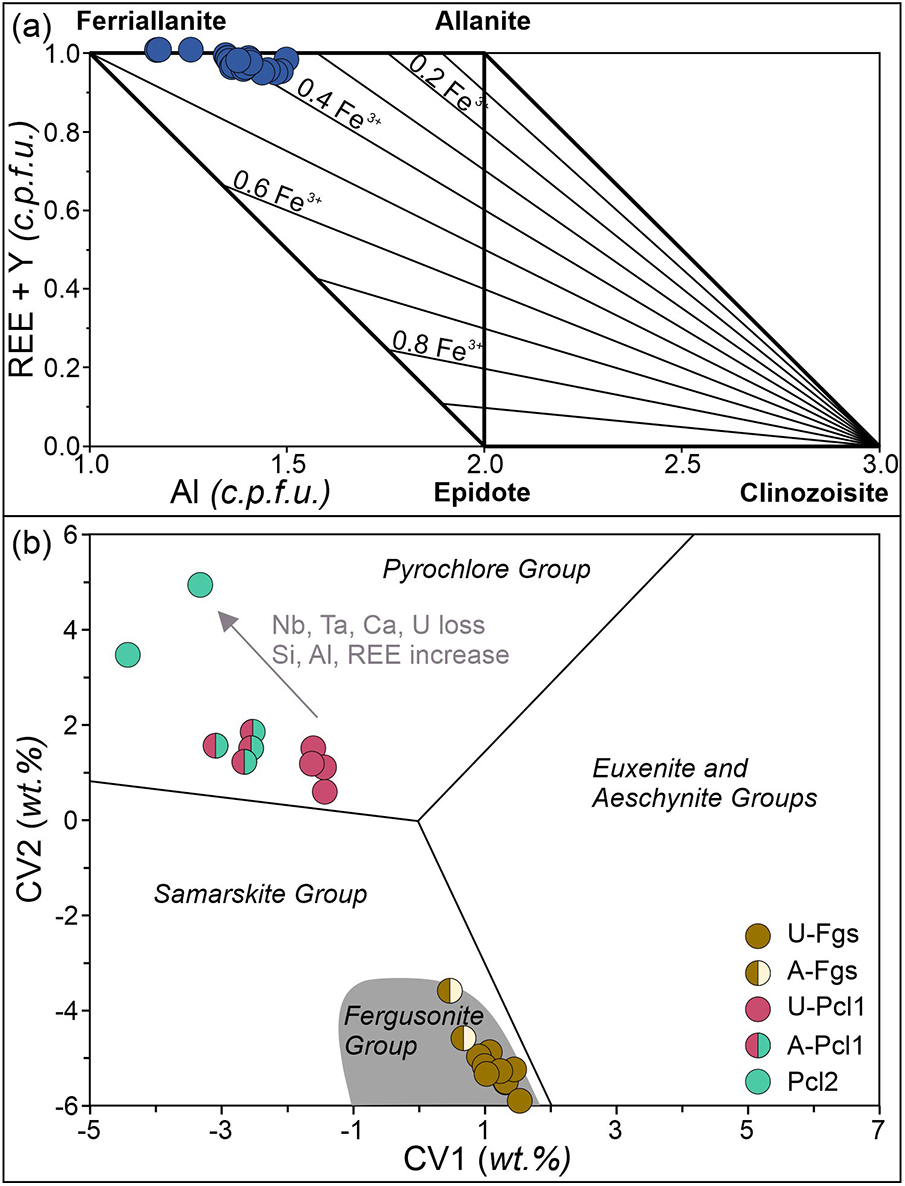
Allanite-(Ce) forms subhedral to anhedral grains, varying in size from a few microns to ∼250 µm, surrounding aggregates of REE-bearing minerals in corona-like microstructures (Figs 3a–c, 4). Allanite-(Ce) shows no zonation in BSE imaging. They have a generally homogeneous composition that includes: 28.3–30.5 wt.% SiO2; 26.3–27.5 wt.% REE2O3 (with Ce dominating over other REE, 12.7–14.3 wt.% Ce2O3); 16.3–20.0 wt.% FeO; and small Al contents (9.8–12.9 wt.% Al2O3; Fig. 5b; Supplementary Material Table S2.3). Chondrite-normalised REE distribution patterns show a steep slope for LREE with HREE below the detection limit (Fig. 2d). Analytical data plotted in an Al vs. REE+Y diagram (Petrik et al., Reference Petrík, Broska, Lipka and Siman1995) indicate that the allanite is a solid-solution of allanite-(Ce) and ferriallanite-(Ce) (Fig. 6a).
(a) Analytical data for allanite-(Ce) plotted on the REE+Y diagram (after Petrík et al., Reference Petrík, Broska, Lipka and Siman1995). (b) Analytical data for fergusonite-(Y) and pyrochlore plotted on the classification diagram for REE–Nb–Ta–Ti oxides (after Ercit, Reference Ercit2005). A-Fgs – altered fergusonite-(Y), U-Fgs – unaltered fergusonite-(Y), A-Pcl1 – altered first generation pyrochlore, U-Pcl1 – unaltered first generation pyrochlore, Pcl2 – second generation pyrochlore.

Bastnäsite-(Ce)
Bastnäsite-(Ce) is a common mineral in the aggregates of REE-bearing minerals, where it commonly forms irregular intergrowths with K-feldspar ranging from ∼10 to 50 µm in size (Fig. 3c,d). In some cases, bastnäsite-(Ce) occurs in fine-grained aggregates with britholite-group minerals (Figs 3c, 4d). In addition, bastnäsite-(Ce) forms small inclusions, a few microns in size, in other accessory minerals. Bastnäsite-(Ce) contains 68.5–72.1 wt.% REE2O3 (Fig. 5b), 20.6–24.7 wt.% CO3, 4.1–7.0 wt.% F and small amounts of CaO (0.1–0.3 wt.%; Supplementary Material Table S2.4). The mineral incorporates mostly LREE with Ce making up the majority among the REE (31.8–37.5 wt.% Ce2O3) and with HREE mostly below the detection limit (Fig. 2e). Because bastnäsite-(Ce) occurs in the fine-grained aggregates or as intergrowths, in common with britholite-group minerals, it is possible that the EPMA data for bastnäsite-(Ce) reflect partially the presence of the submicron grains of other phases dispersed in the volume of the analysed material.
Fergusonite-(Y)
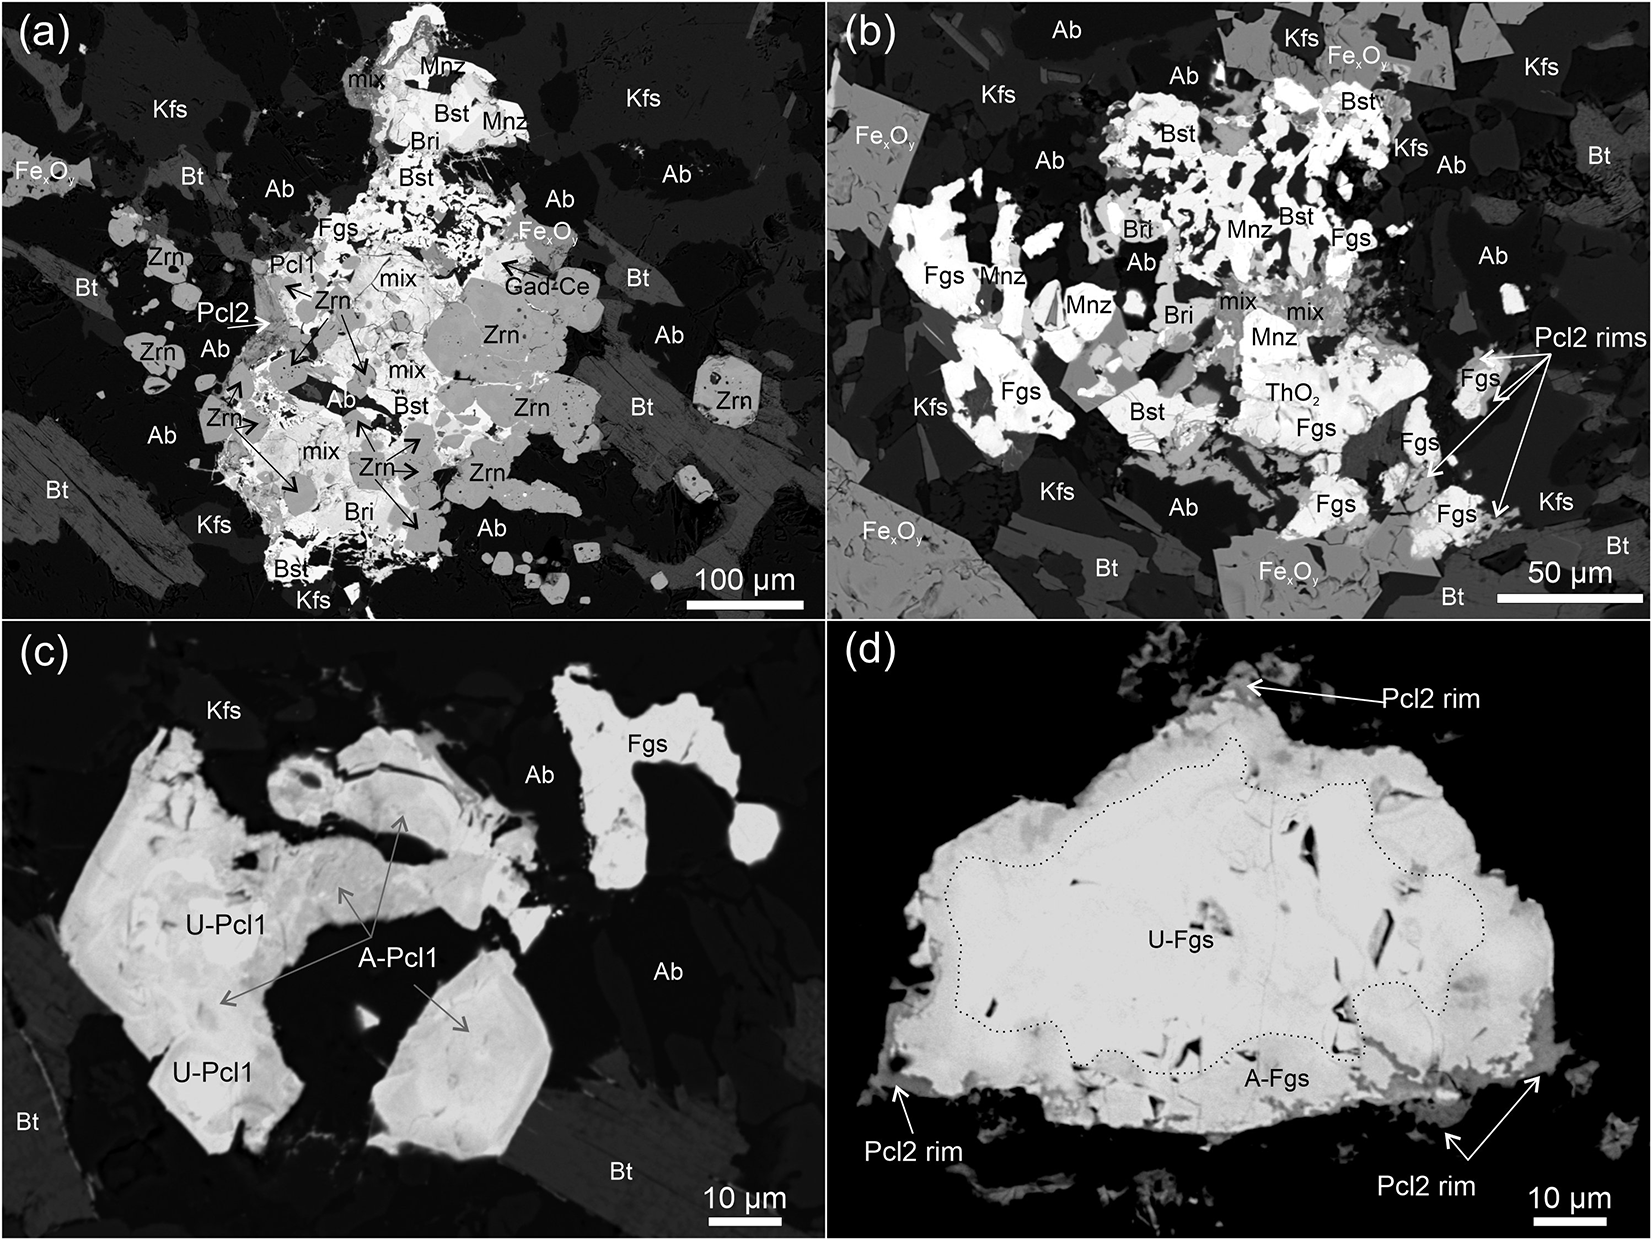
Fergusonite-(Y) forms individual, irregular grains, ∼20–100 µm in size (Fig. 7d) or is present in the aggregates intergrown with other REE-bearing minerals (Figs 3b, 7a,b, 8). Larger fergusonite-(Y) grains (50 µm × 100 µm) are partially altered along the rims, with pyrochlore-II formed in the outermost part of the rim (Fig. 7d). Unaltered fergusonite-(Y) contains 40.8–45.7 wt.% REE2O3 (Y being the dominant REE component, 18.8–23.0 wt.% Y2O3), 42.9–44.4 wt.% Nb2O5, and 3.1–5.4 wt.% ThO2 (Fig. 5a,b; Supplementary Material Table S2.5). In contrast, the altered rims are depleted in Nb and Y (41.5–42.7 wt.% Nb2O5, 14.6–16.8 wt.% Y2O3) and have greater Th contents (7.0–7.1 wt.% ThO2) compared to unaltered domains. The analytical totals of EPMA measurements of fergusonite-(Y), both altered and unaltered domains, are in the range of 92.4–94.5 wt.%, which suggests potential water in the structure. All of the compositional data plot in the field of fergusonite on the classification diagram for REE–Nb–Ta–Ti oxides (Fig. 6b). Chondrite-normalised REE distribution patterns for fergusonite-(Y) are uniform and generally flat (La/Yb ratios of 0.11–0.85) with a subtly negative Eu anomaly (Eu/Eu* = 0.22–0.32; Fig. 2f).
(a, b) BSE images of aggregates of REE-bearing minerals with pyrochlore. (c) Individual pyrochlore grains in a high-contrast BSE image showing the heterogeneous internal structure of the grains with altered domains of first generation pyrochlore. (d) Individual fergusonite grain in a high-contrast image showing an altered rim and second generation pyrochlore forming in the outermost parts of the grain. Mineral-name abbreviations after Warr (Reference Warr2021).

BSE image (a) and compositional X-ray WDS maps (b–i) of the REE-bearing accessory minerals aggregate with pyrochlore and fergusonite-(Y).

Pyrochlore
Pyrochlore, in common with fergusonite, occurs in the aggregates of REE-bearing minerals or forms individual subhedral grains ∼20–30 µm in size (Fig. 7a,c). The composition suggests the presence of two generations of pyrochlore, both of which plot within the pyrochlore group field in the three-group model of Ercit (Reference Ercit2005) (Fig. 6b). The pyrochlore-I grains have a heterogeneous internal texture (Fig. 7c), and are characterised by high Nb, U and Ca contents (43.9–54.4 wt.% Nb2O5, 8.8–17.0 wt.% UO2, 5.8–9.0 wt.% CaO), with the lowest concentrations of REE among the accessory REE-bearing minerals described (8.4–12.6 wt.% of REE2O3; Fig. 5b), and highly variable Ta contents (1.3–21.3 wt.% of Ta2O5; Supplementary Material Table S2.5). Chondrite-normalised REE distribution patterns of pyrochlore-I vary considerably, especially in the MREE to HREE range (Fig. 2g). Pyrochlore-II usually forms rims around fergusonite grains (Fig. 7d), and less commonly forms small (∼20 µm), irregular grains (Fig. 8). The composition of pyrochlore-II varies significantly with depleted Nb (10.0–40.0 wt.% Nb2O5), Ta (<2.25 wt.% Ta2O5), Ca (1.6–5.4 wt.% CaO) and U (0.03–7.1 wt.% UO2), and elevated Si (12.6–22.4 wt.% SiO2), Al (0.7–7.6 wt.% Al2O3), and REE (17.2–30.6 wt.% REE2O3) (Figs 2g, 5b; Supplementary Material Table S2.5). Low totals of 79.8–91.1 wt.% in EPMA data suggest the presence of water in the structure.
Gadolinite-group minerals
The gadolinite-group minerals are represented by gadolinite-(Ce) and, less commonly, gadolinite-(Y). In many cases these minerals occur as a solid solution. Gadolinite-(Ce) forms anhedral to subhedral grains, 10–50 µm in size (Fig. 3d), whereas gadolinite-(Y) usually forms overgrowths on the gadolinite-(Ce) grains or fills the interspaces within the aggregates of REE-bearing accessory minerals (Figs 3d, 4). Gadolinite-(Ce) has a relatively homogeneous composition with respect to major elements with 21.5–22.1 wt.% SiO2, 10.3–11.5 wt.% FeO, 50.9–55.3 wt.% REE2O3 and 8.0–8.9 wt.% BeO, whereas gadolinite-(Y) contains 23.7–24.3 wt.% SiO2, 49.7–52.4 wt.% REE2O3 and 7.6–8.5 wt.% BeO (Fig. 5b; Supplementary Material Table S2.6). The chondrite-normalised REE distribution pattern has a slope of LREE and nearly flat HREE patterns in gadolinite-(Ce) (LaN/YbN ratios of 21.20–67.07) with a negative Eu anomaly (Eu/Eu* = 0.18–0.44; Fig. 2h). The gadolinite-(Y) data show nearly flat chondrite-normalised patterns with a slightly increasing slope from LREE towards HREE (LaN/YbN ratios of 0.15–0.85) and, similar to the gadolinite-(Ce), negative Eu anomaly (Eu/Eu* = 0.20–0.25; Fig. 2h).
The solid solution of gadolinite-(Ce) and gadolinite-(Y) is only present within the REE-bearing aggregates (Figs 3a,c, 4, 8). The composition of gadolinite-(Ce) and gadolinite-(Y) solid-solution is characterised by varying concentrations of Ce (14.0–17.9 wt.% Ce2O3) and Y (9.8–15.3 wt.% Y2O3), as well as increased amounts of Nd (9.0–9.8 wt.% Nd2O3) compared to gadolinite-(Ce) and gadolinite-(Y) (Supplementary Material Table S2.6).
U–Th–Pb geochronology of monazite
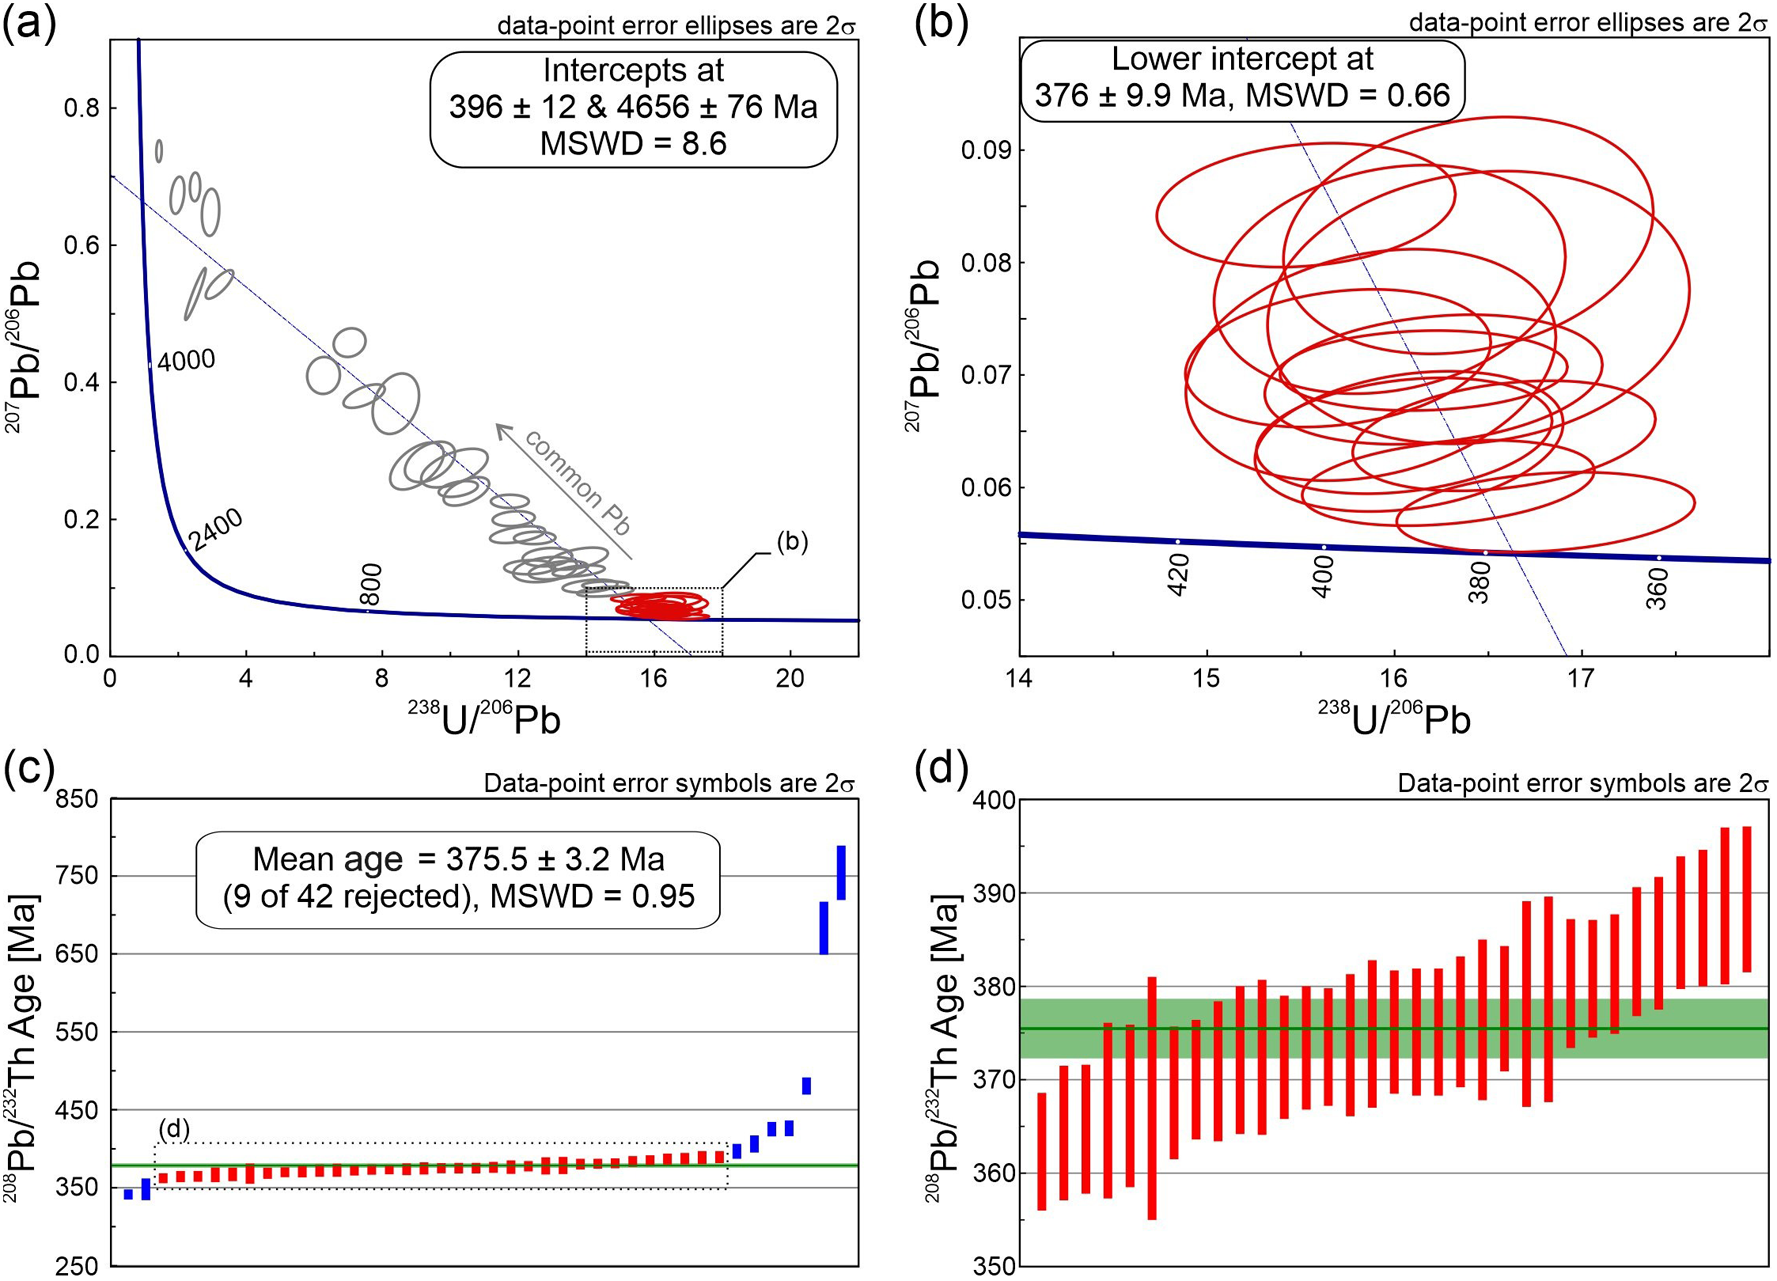
Forty-two LA-ICP-MS U–Th–Pb measurements were performed in 26 grains of monazite-(Ce) with sizes of >20 µm, i.e. suitable for LA-ICP-MS measurements (Supplementary Material Table S3.1). Analyses included monazite-(Ce) grains occurring both in aggregates and as individual grains. The 207Pb/206Pb vs. 238U/206Pb data are highly discordant from 5.7 to 70.0% and scattered along the regression trend on the Tera-Wasserburg concordia diagram, indicating the presence of common Pb with a lower intercept of 396 ± 12 Ma (n = 42; Fig. 9a). A large mean square weighted deviation (MSWD) value of 8.6 and a high discordance indicate that this age should be interpreted with caution. However, data filtered to a discordance of <20% provided a lower intercept of 376 ± 9.9 Ma with MSWD = 0.66 (n = 12; Fig. 9b), which is consistent with a 208Pb/232Th mean age of 375 ± 3.2 Ma (MSWD = 0.95; n = 33; Fig. 9c,d).
Results of LA-ICP-MS U–Th–Pb measurements of monazite-(Ce).

Submicron investigations using transmission electron microscopy (TEM)
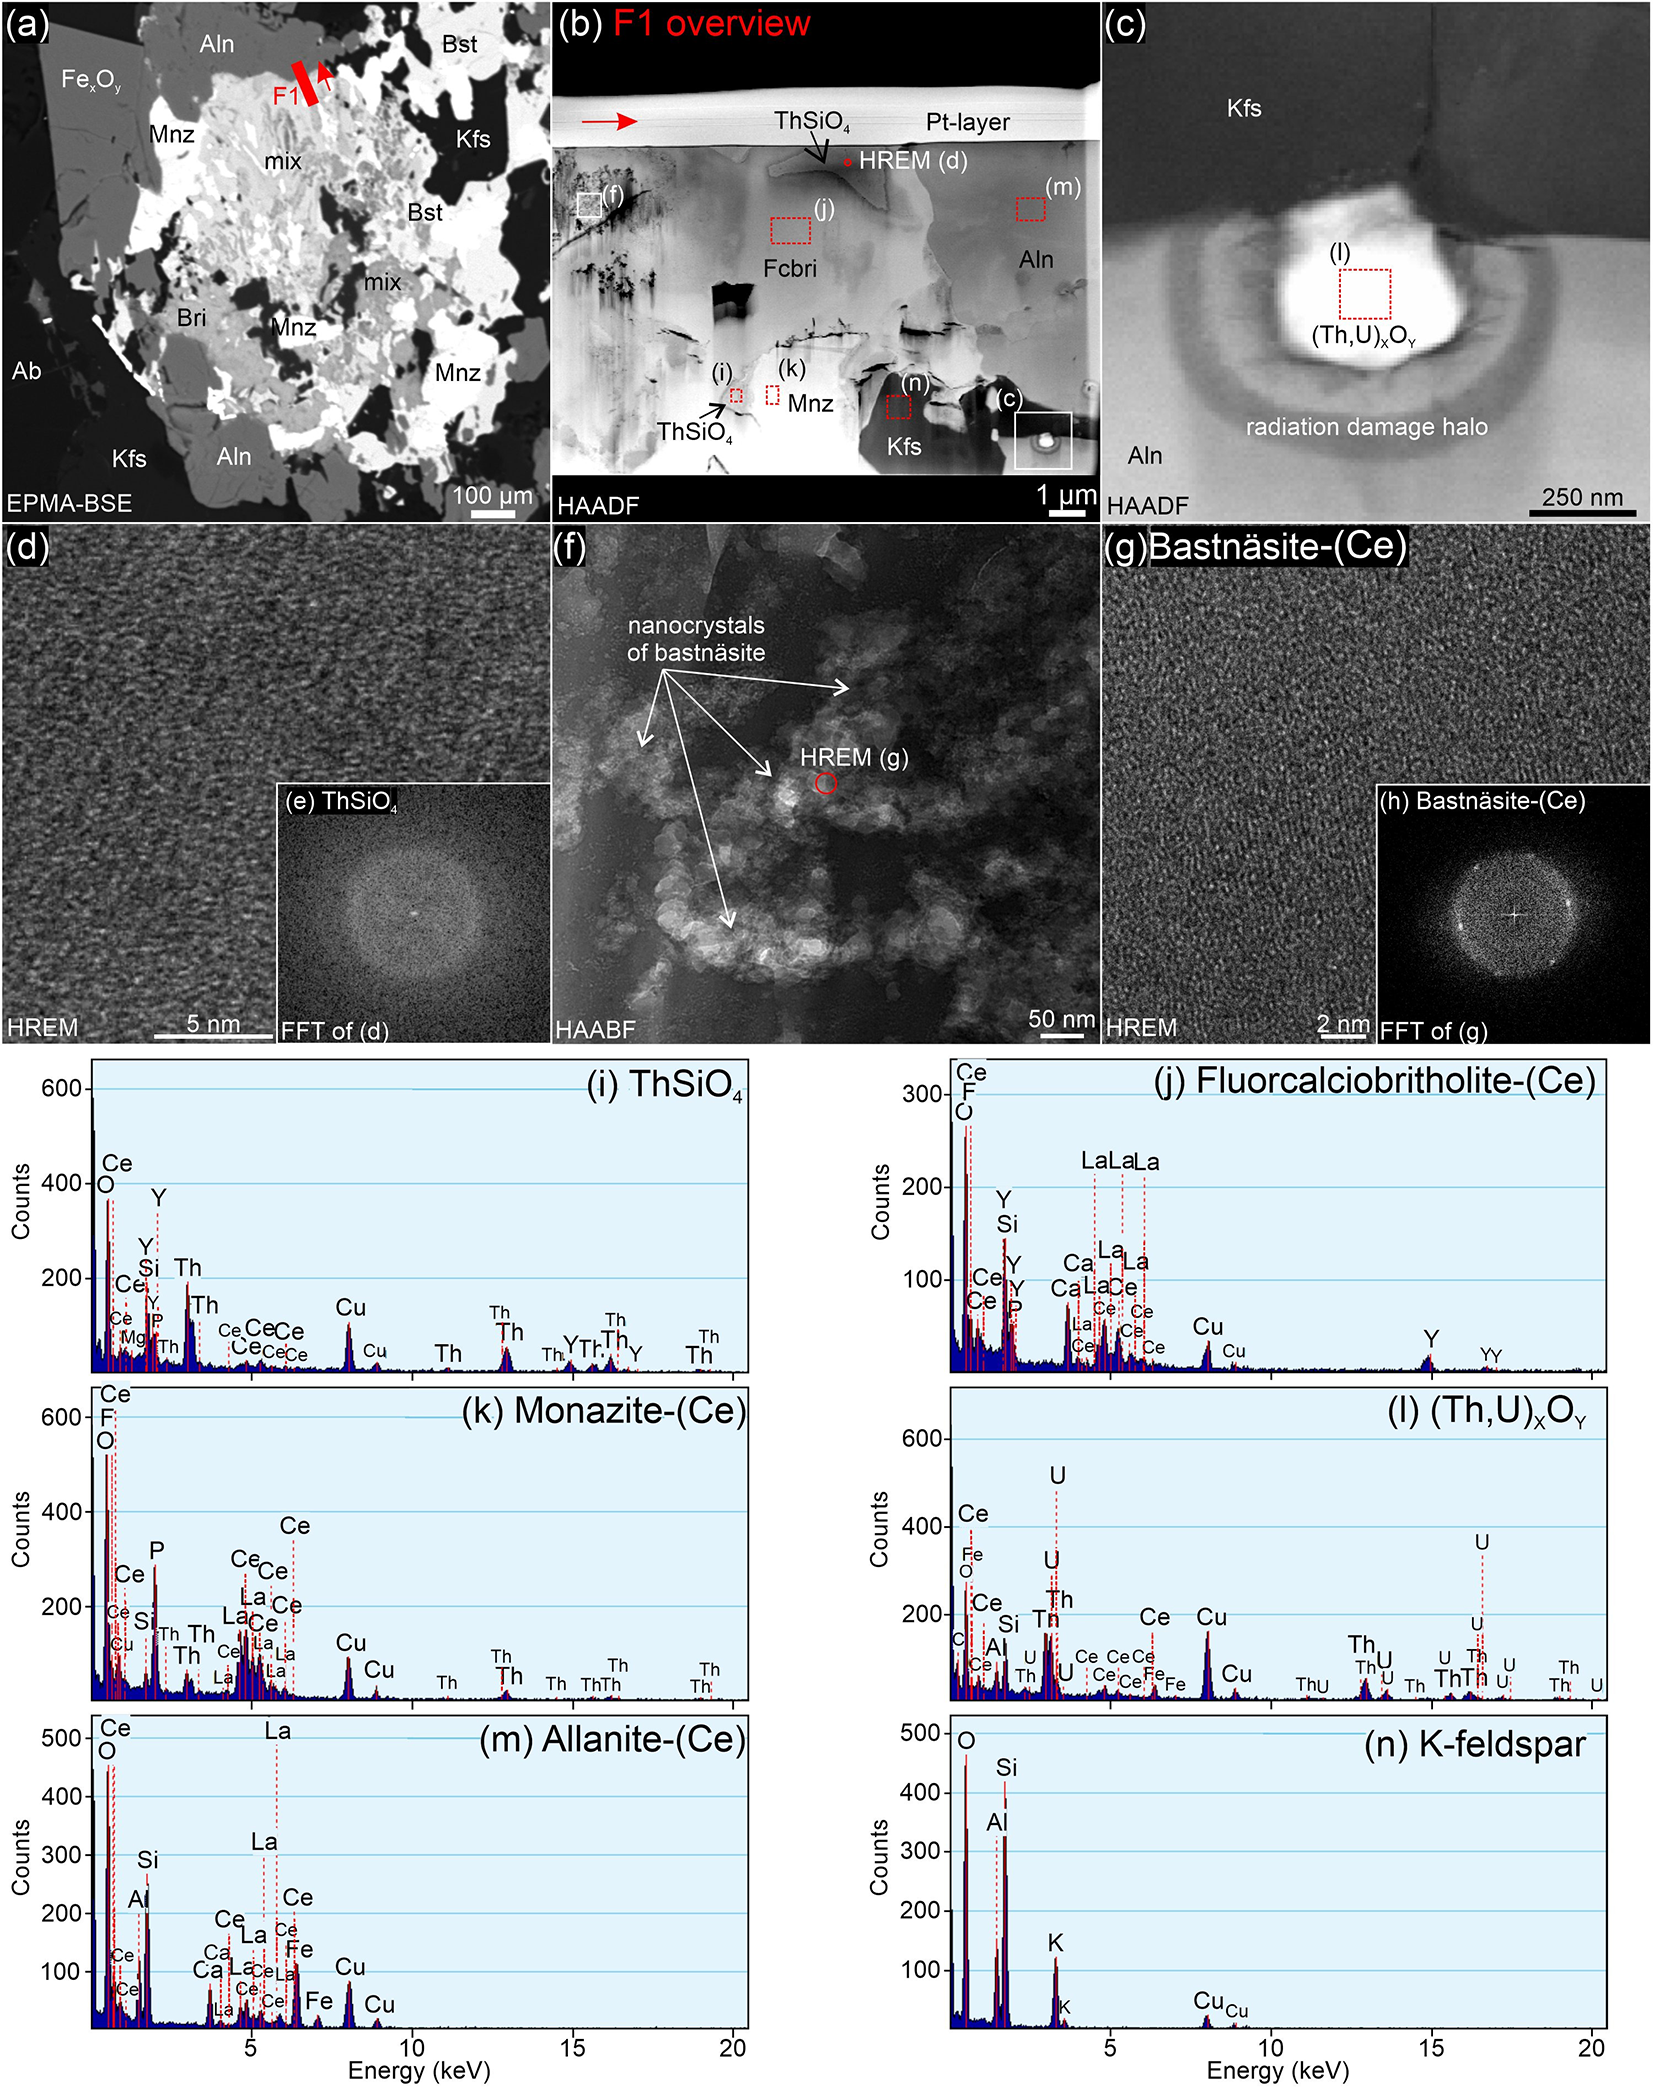
REE-bearing accessory minerals were investigated using TEM in eight FIB foils at the submicron-scale. The FIB foil F1 was prepared from an aggregate where relatively large allanite-(Ce) crystals are in contact with a mixture of fine-grained REE phases (Fig. 10a). The fine-grained aggregate consists mostly of fluorcalciobritholite-(Ce), monazite-(Ce) and ThSiO4 (Fig. 10b,d,e). The fluorcalciobritholite-(Ce) shows patchy zoning in the high-angle annular dark field (HAADF) images and contains porosity, which indicates the presence of a fluid, including empty space (fluid that escaped during FIB sample preparation) along the boundary with monazite-(Ce) (Fig. 10b). In addition, fluorcalciobritholite-(Ce) can contain aggregates of bastnäsite-(Ce) and britholite-(Ce) nanocrystals with poor crystallinity (Fig. 10b,f,g,h). ThSiO4 grains form intergrowths with fluorcalciobritholite-(Ce) or monazite-(Ce) (Fig. 10b). Because ThSiO4 is completely metamict due to irradiation damage from radioactive decay of Th, it was not possible to discriminate between thorite and huttonite (Fig. 10d,e). An irregular grain of K-feldspar is intergrown with fluorcalciobritholite-(Ce), allanite-(Ce) and monazite-(Ce) (Fig. 10b,c). An allanite-(Ce) contains an inclusion of (Th,U)-oxide with a pronounced radiation damage halo in allanite-(Ce) (Fig. 10c). Porosity and small crack systems developed at the interface between allanite-(Ce) and (Th,U)-oxide caused by recoil effects during radioactive decay of Th and U.
TEM images illustrating textural relations at the boundary between the fine-grained mixture of REE-bearing minerals and the allanite-(Ce) in foil F1. (a) BSE image with the location from where the foil was cut. (b–c) High-angle annular dark field (HAADF) images. (d, g) High-resolution lattice fringe (HREM) images. (e, h) Diffraction patterns (FFT). (f) High-angle annular bright field (HAABF) image. (i–n) EDX spectra collected from individual minerals in the foil (Cu peaks on the EDX spectra appear due to the copper grid on which the foils are mounted for measurements). Red arrow indicates the orientation of the FIB foil in the BSE overview image.

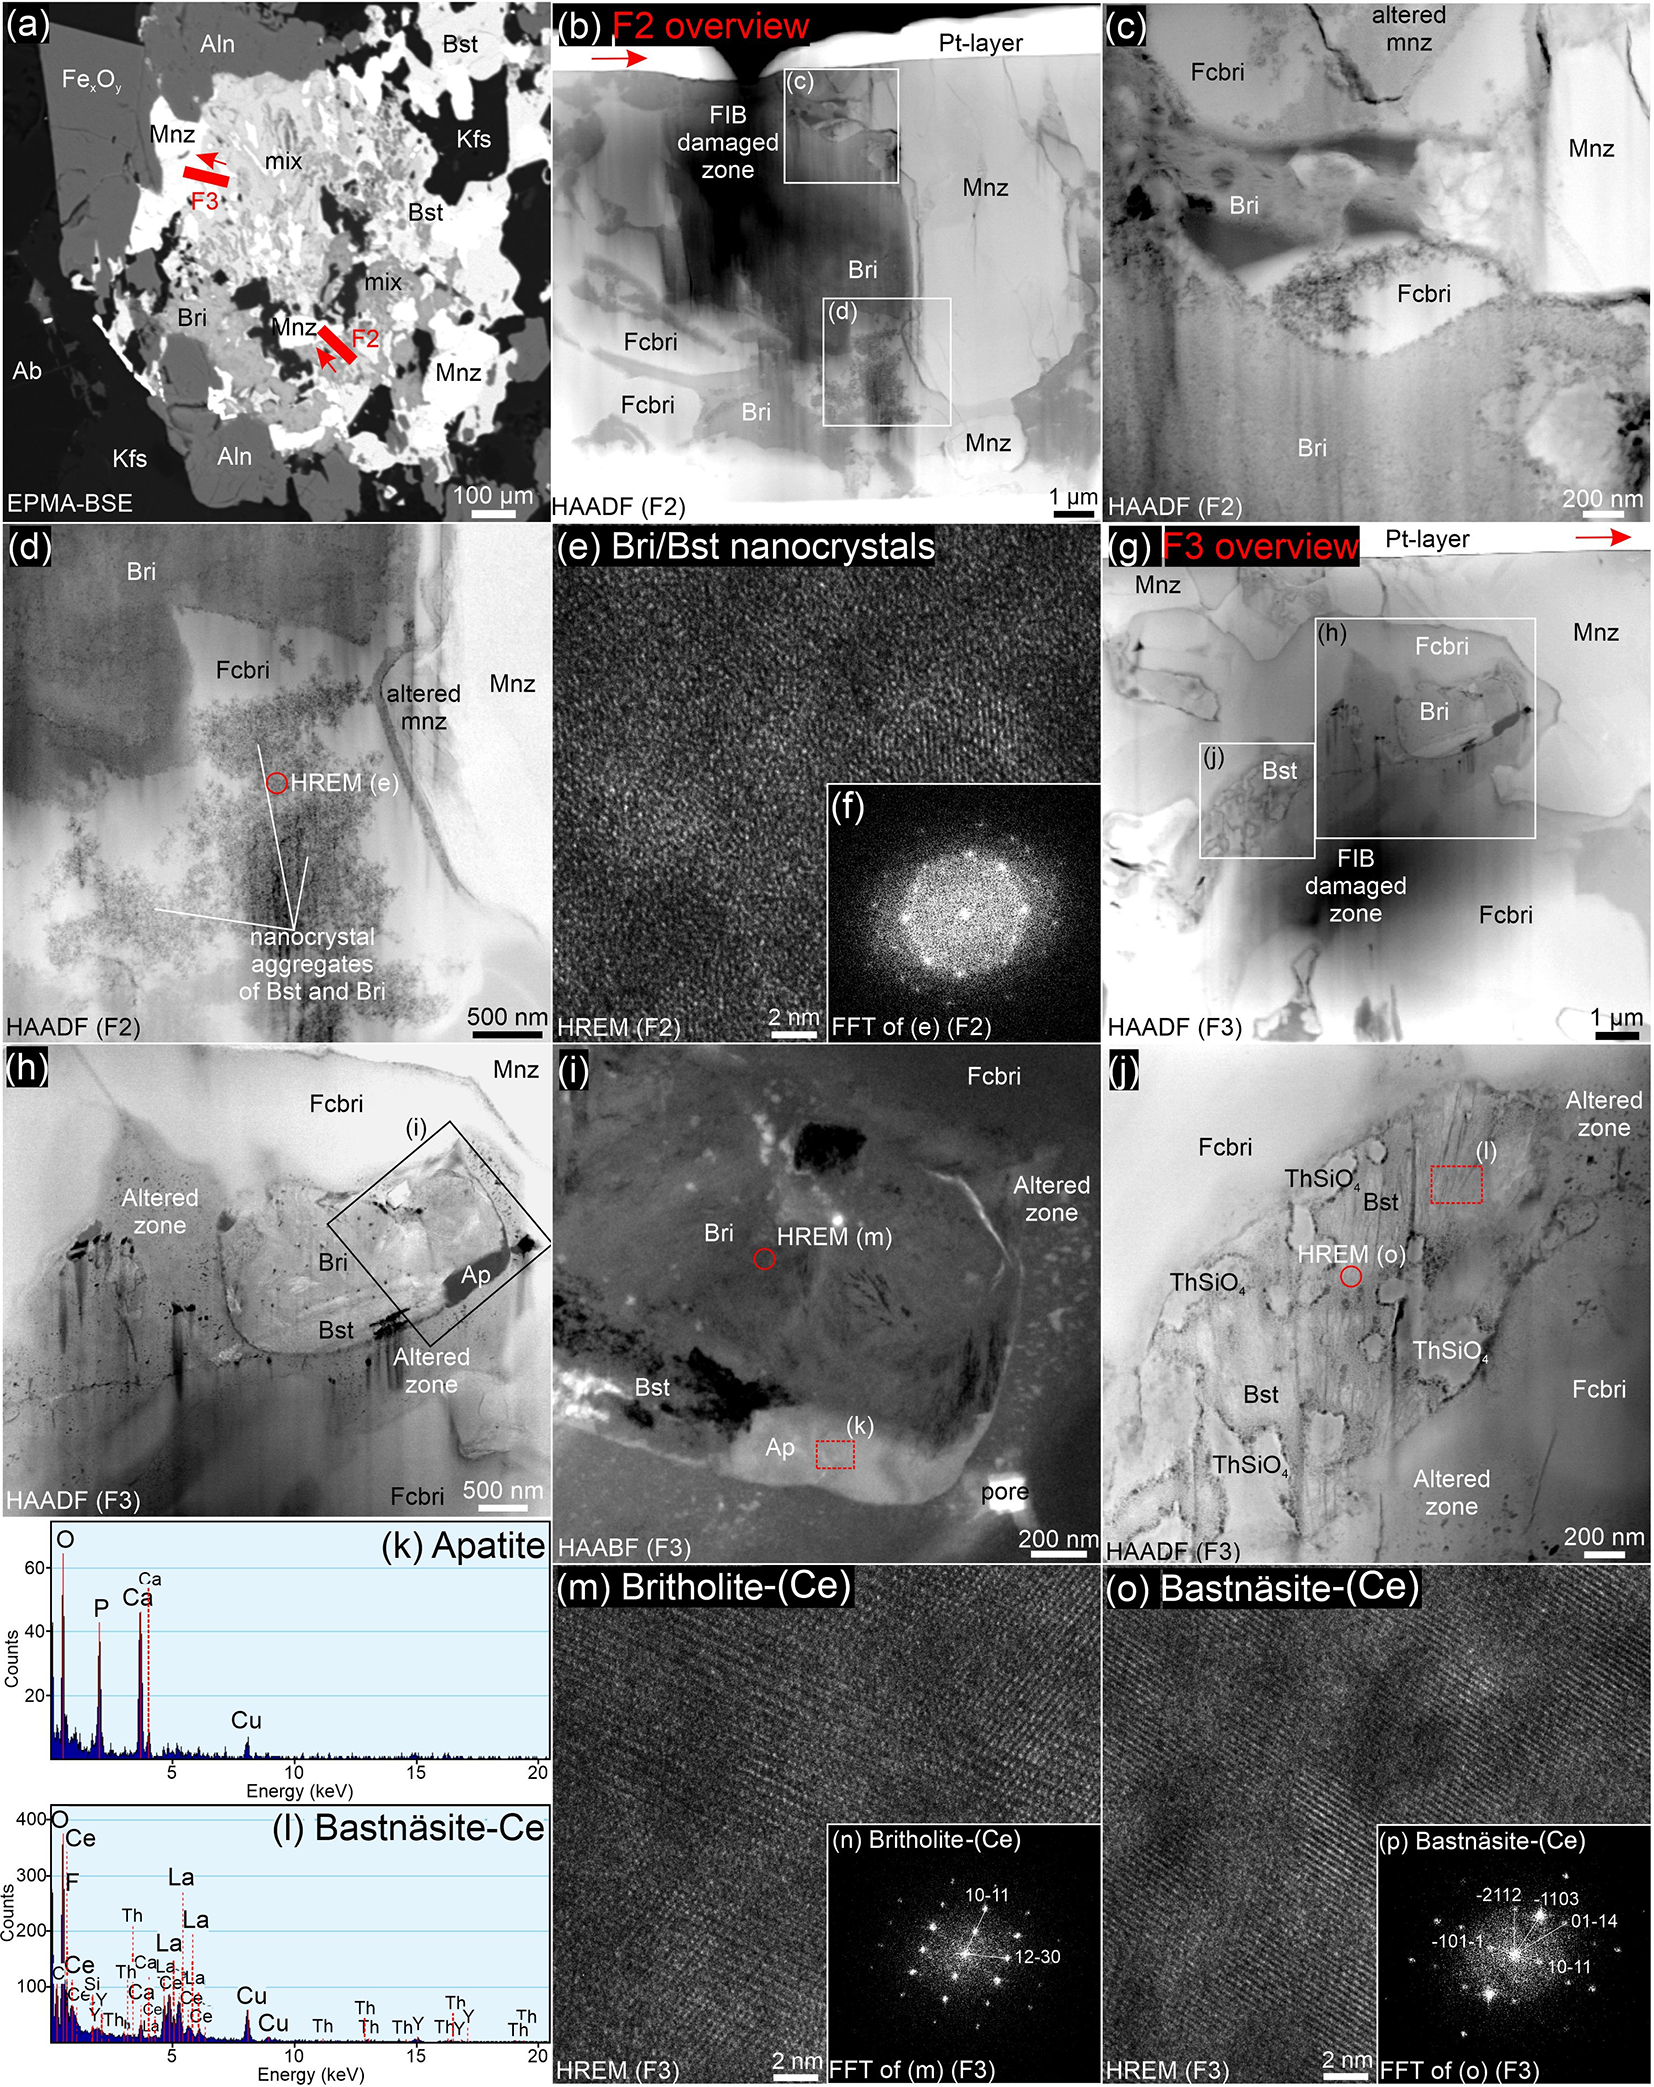
Two FIB foils (F2, F3) were lifted out across a boundary between monazite-(Ce) and fine-grained aggregate of britholite-group minerals (Fig. 11a). In the FIB foil F2, a large monazite-(Ce) grain is partially altered along the contact with fluorcalciobritholite-(Ce), with cracks running through it, and with altered areas up to ∼100 µm in size (Fig. 11b–d). A fine-grained aggregate of britholite-group minerals includes fluorcalciobritholite-(Ce) intergrown with britholite-(Ce) (Fig. 11b–d). In the fluorcalciobritholite-(Ce), aggregates of poorly crystalline bastnäsite-(Ce) and britholite-(Ce) nanocrystals are present (Fig. 11c–f).
TEM images demonstrating two foils lifted from the boundary between monazite-(Ce) and fine-grained aggregate (F2, F3). Foil F2 has been partially damaged during FIB preparation, partially obscuring the images. (a) BSE image with the locations of the foils. (b–d, g, h, j) HAADF images. (e, m, o) HREM images. (f, n, p) Diffraction patterns (FFT). (i) HAABF image. (k, l) EDX spectra acquired from individual minerals in the foil F3 (Cu peaks on the EDX spectra appear due to the copper grid on which the foils are mounted for measurements). Red arrow indicates the orientation of the FIB foil in the BSE overview image.

Monazite-(Ce) in FIB foil F3 is intergrown with fluorcalciobritholite-(Ce) with an irregular boundary, along which nanoporosity has developed (Fig. 11g,h). Fluorcalciobritholite-(Ce) is partially altered along the contact with britholite-(Ce), followed by bastnäsite-(Ce) and apatite (Fig. 11g,h,i). Additionally, the fluorcalciobritholite-(Ce) contains patches of altered domains with developed porosity and nano-inclusions of apatite (Fig. 11h,i). Apatite also occurs as a thin layer between fluorcalciobritholite-(Ce) and britholite-(Ce), and as a ∼800 nm × 250 nm overgrowth with poor crystallinity (Fig. 11i). Additionally, an accumulation of ThSiO4 grains is present, encompassed within bastnäsite-(Ce) (Fig. 11j). ThSiO4 grains are surrounded by porosity, most likely caused by the radiation damage of the bastnäsite-(Ce) structure. The high resolution electron microscopy (HREM) and fast-Fourier transform (FFT) images of britholite-(Ce) and bastnäsite-(Ce) revealed that both are well crystallised but with patches of damaged crystal structure, which are more pronounced in bastnäsite-(Ce) (Fig. 11m,o). The darker contrasts in the HREM image (Fig. 11o) are indicative of blurred or absent lattice fringes, thus indicating radiation damage. The corresponding diffraction pattern of bastnäsite-(Ce) shows strong diffuse scattering intensity due to non-crystalline volumes in the bastnäsite-(Ce) structure also caused by radiation damage (Fig. 11p). In the case of britholite-(Ce), these features are limited and less pronounced (Fig. 11n,m), suggesting that britholite-(Ce) is less affected by radiation damage than bastnäsite-(Ce).
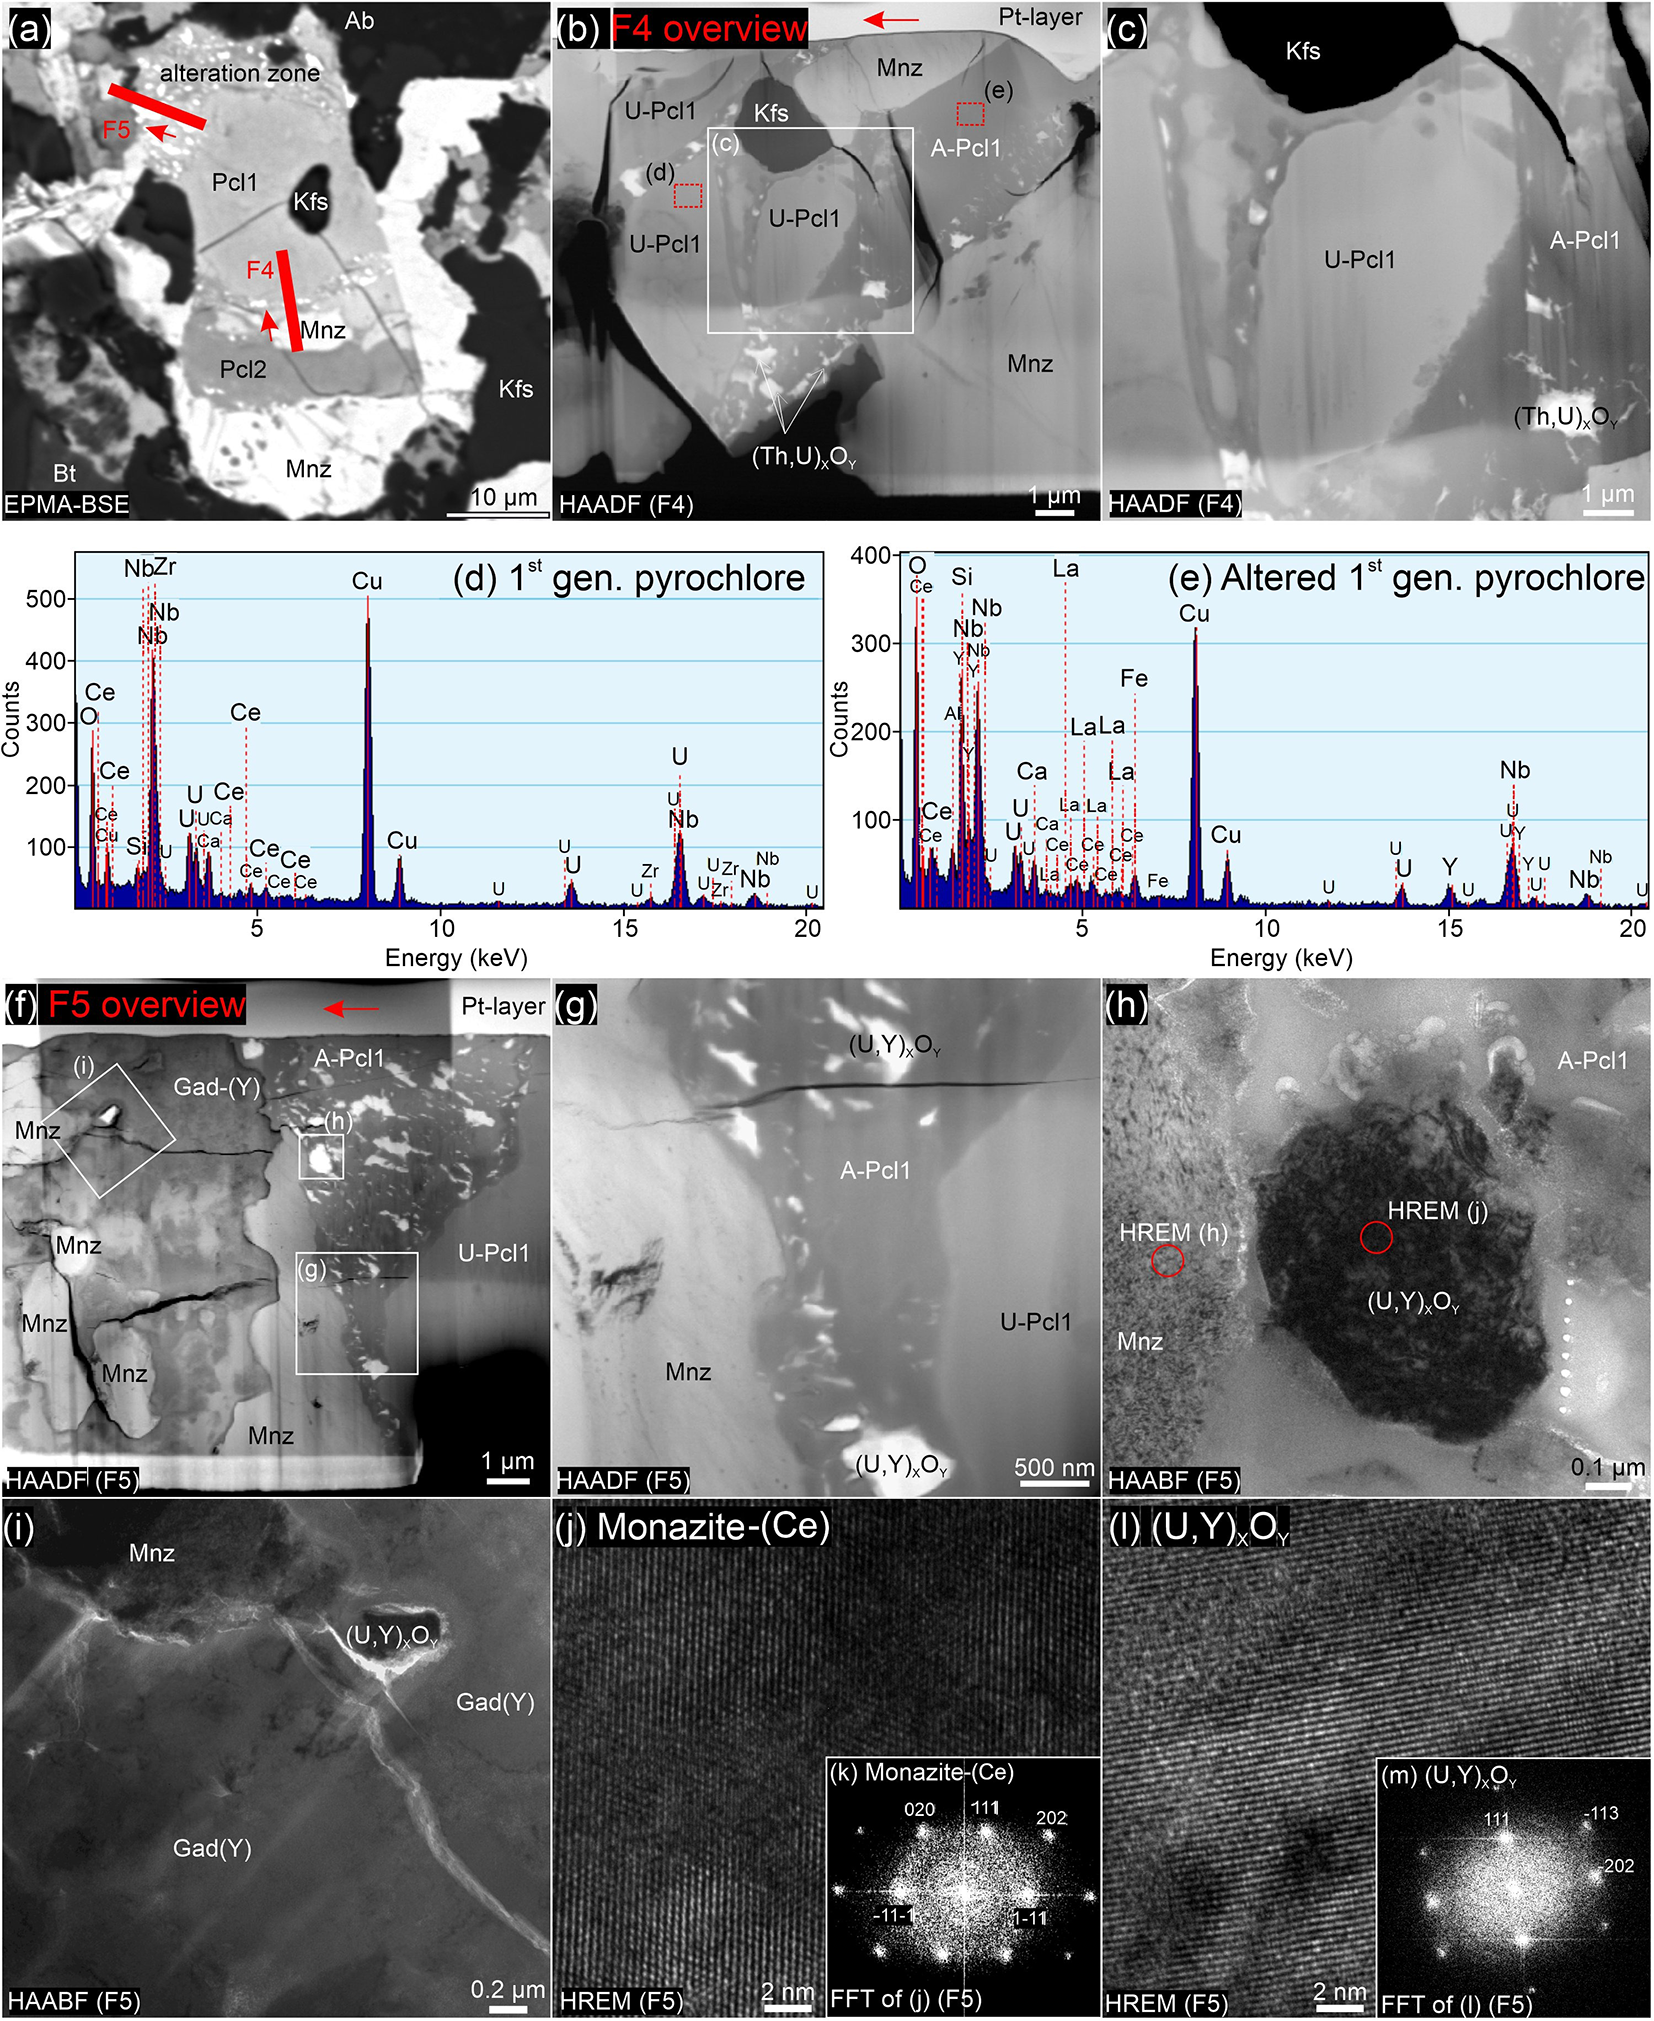
The FIB foils, F4, F5, focus on pyrochlore grains located in the REE-bearing aggregates and were extracted from the pyrochlore-I with an alteration front (Fig. 12a). Foil F4 intersects a monazite-(Ce) inclusion in the alteration zone of pyrochlore-I (Fig. 12a,b,c). Pieces of unaltered and altered pyrochlore-I varying in size are embedded in the matrix of the altered domain, together with monazite-(Ce) grains and a K-feldspar grain (Fig. 12b). The altered pyrochlore matrix contains irregular, micro- to nano-inclusions of (Th,U) oxides (Fig. 12b,c). Inclusions of (Th,U) oxides at the contact of altered pyrochlore-I with monazite-(Ce) appear to accumulate in a zone close to the contact with monazite-(Ce) (Fig. 12b).
TEM images displaying pyrochlore grains located in the REE-bearing aggregates with an alteration front (foils F4, F5). (a) BSE image with the foil location. (b, c, f, g) HAADF images. (d, e) EDX spectra acquired from individual minerals in the foil (Cu peaks on the EDX spectra appear due to the copper grid on which the foils are mounted for measurements). (h, i) HAABF images. (j, l) HREM images. (k, m) Diffraction patterns (FFT). Red arrow indicates the orientation of the FIB foil in the BSE overview image.

The FIB foil F5 contains a boundary between pyrochlore-I and surrounding gadolinite-(Y) (Fig. 12a,f). Grains of monazite-(Ce) of various sizes also occur in the area intergrown with gadolinite-(Y). One larger anhedral monazite-(Ce) grain is located directly between the altered pyrochlore-I zone and gadolinite-(Y) (Fig. 12f). The contact between altered and unaltered domains of pyrochlore-I is sharp, with a series of irregular inclusions of (U,Y) oxides appearing throughout the altered domain bearing characteristic unmixing-like textures (Fig. 12f,g). HAADF images revealed the disturbed internal structure of the (U,Y) oxide inclusions (Fig. 12h,l) and their influence on other nearby minerals, such as a monazite-(Ce) with moderate radiation damage (Fig. 12j). Gadolinite-(Y), based on the changes in the diffraction contrast in HAADF images, has a heterogeneous internal structure with irregular brighter domains possibly due to compositional changes (Fig. 12f,i). A halo of radiation damage and even small cracks formed in gadolinite-(Y) around the (U,Y) oxides inclusion (Fig. 12i). Strong diffuse scattering intensity in the diffraction patterns (FFT) of monazite-(Ce) and (U,Y) oxides indicates a greater contribution of the amorphous material related to the damaged structure due to irradiation (Fig. 12k,m).
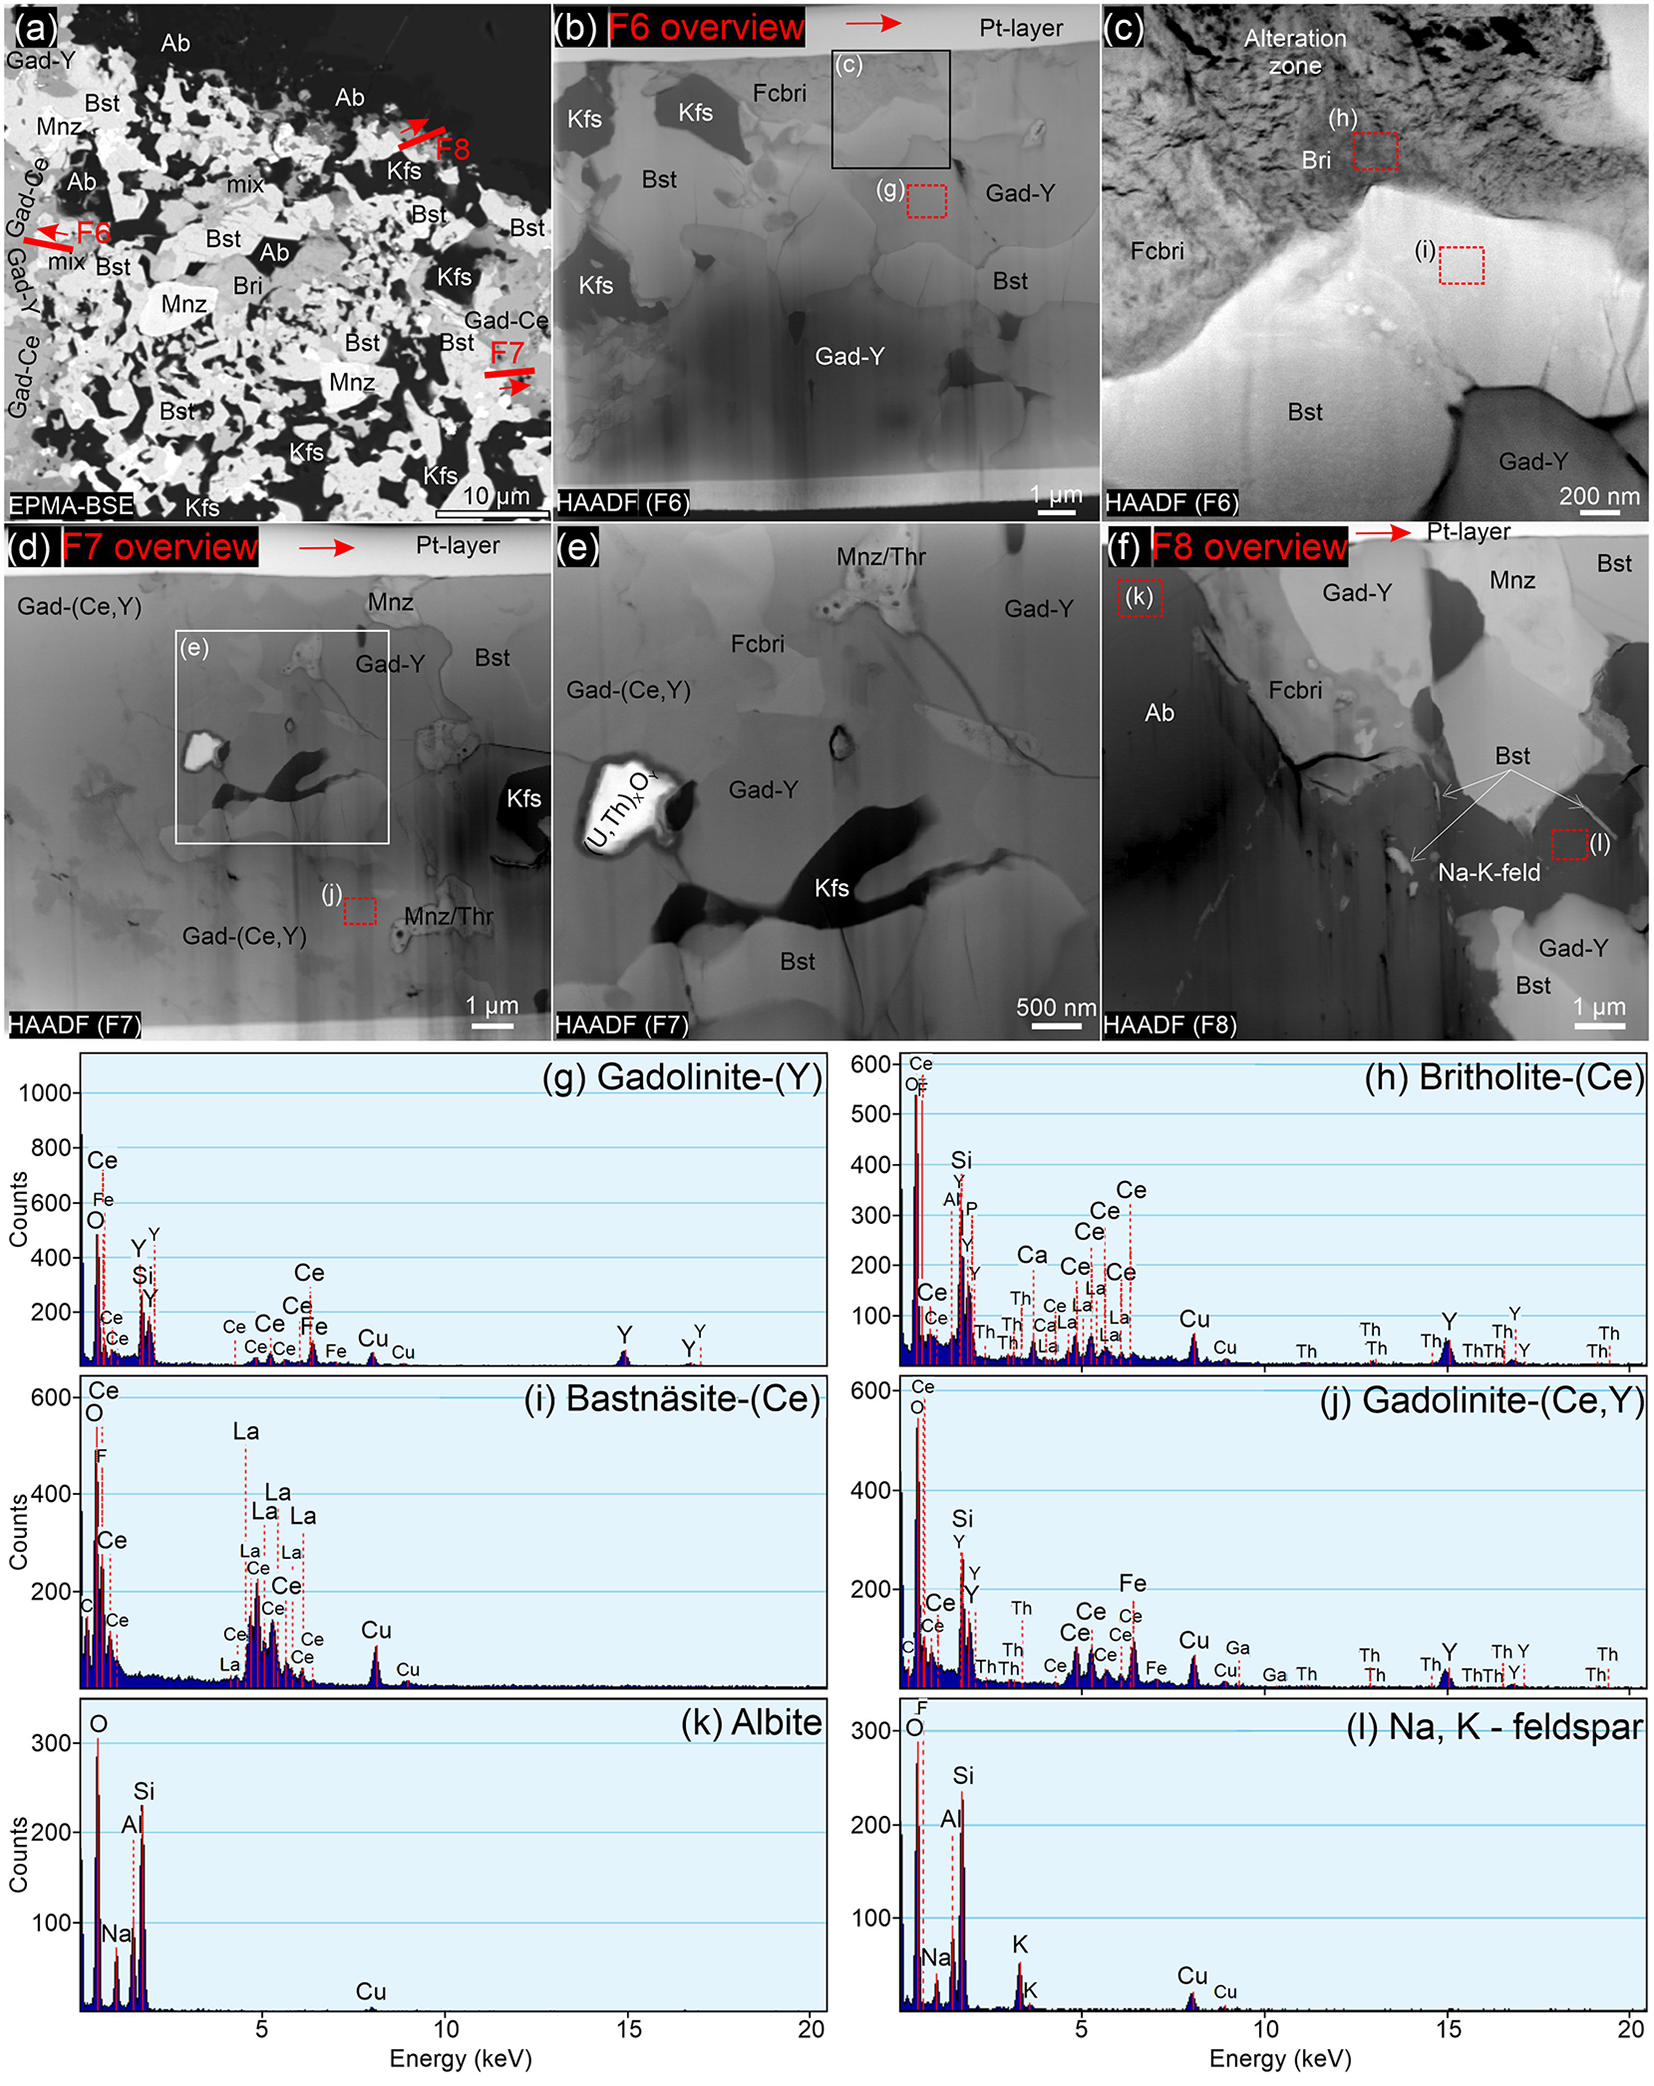
The FIB foils F6 and F7 were extracted from the areas where gadolinite-group minerals occur in the aggregates of REE-bearing minerals at the boundary between gadolinite-(Y) and the fine-grained mixtures (Fig. 13a). In the FIB foil F6, gadolinite-(Y) is intergrown with anhedral grains of bastnäsite-(Ce), fluorcalciobritholite-(Ce) and K-feldspar (Fig. 13b,c). In the gadolinite-(Y), larger cavities connected by cracks are filled with smaller K-feldspar grains (Fig. 13b,d,e). Some fluorcalciobritholite-(Ce) grains are strongly altered with patches of porous altered domains and partial replacement by britholite-(Ce) (Fig. 13c). The FIB foil F7 contains gadolinite-(Y), and also the gadolinite-(Ce) and gadolinite-(Y) solid-solution enriched in Ce based on the energy-dispersive X-ray (EDX) spectra (Fig. 13d,j). The gadolinite-(Ce) and gadolinite-(Y) solid solution exhibit patchy zoning with varying composition based on changing diffraction contrasts in HAADF images (Fig. 13d,e). Both gadolinite-group minerals create a matrix in which inclusions of fluorcalciobritholite-(Ce), bastnäsite-(Ce), K-feldspar, (U,Th) oxide, and altered monazite-(Ce) grains reside. Heavily altered monazite-(Ce) grains are porous and partially replaced by ThSiO4 (Fig. 13d,e).
TEM images displaying the phase boundary between gadolinite-(Ce) and the fine-grained mixtures (foils F6, F7) and the external part of the aggregates at the interface with the surrounding albite (foil F8). (a) BSE image with the foils location (b–f) HAADF images. (g–l) EDX spectra collected from individual minerals (Cu peaks on the EDX spectra appear due to the copper grid on which the foils are mounted for measurements). Red arrow indicates the direction of the FIB foils.

The FIB foil F8 was extracted from the external part of the aggregates at the border with the surrounding albite (Fig. 13a). Albite in the foil is homogeneous and has almost ideal endmember composition (Fig. 13k). In the bottom part of the F8 foil, a second type of Na- and K-bearing feldspar is present with streaks of bastnäsite-(Ce) inclusions running through it (Fig. 13f). Bastnäsite-(Ce) grains are homogeneous and create intergrowths with monazite, gadolinite-(Y) and feldspars. A fluorcalciobritholite-(Ce) grain directly at the contact with albite has a disturbed structure with patches of altered domains (Fig. 13f).
Discussion
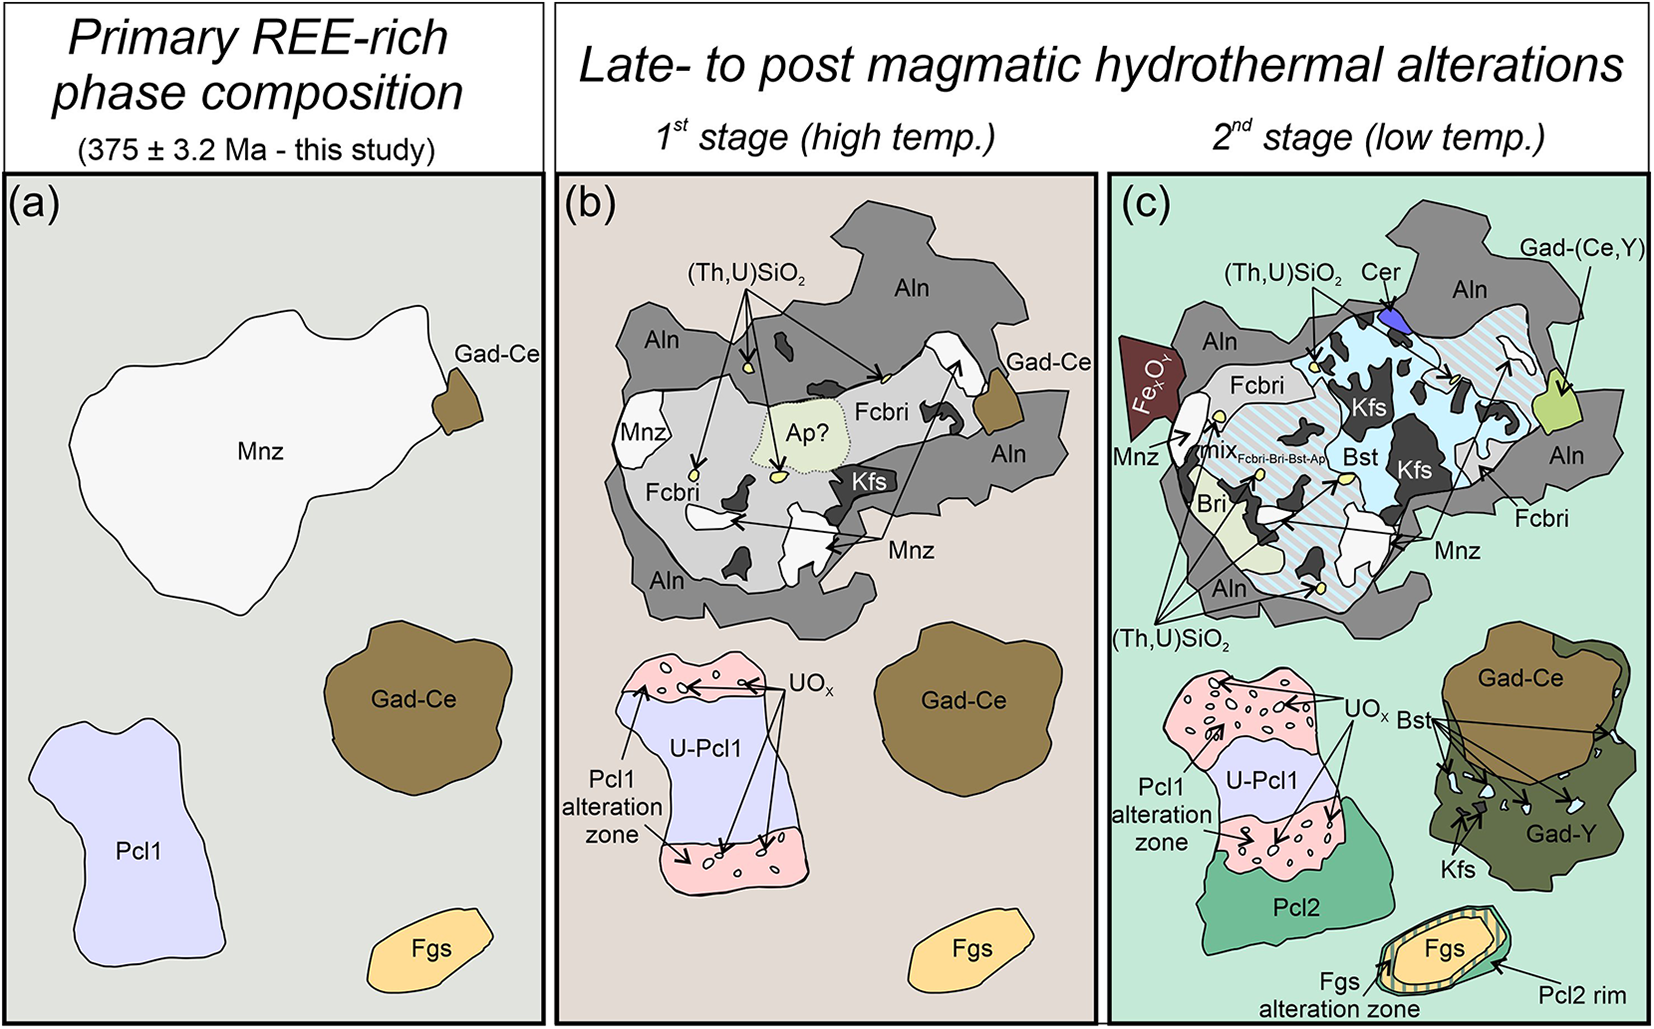
REE-bearing accessory minerals in the nepheline syenite occur primarily as polymineralic aggregates that form complex microstructures. However, monazite-(Ce), fergusonite-(Y), pyrochlore-I and gadolinite-(Ce) also appear as individual crystals. Based on their compositional characteristics and textural context within the aggregates, these four minerals are interpreted as the primary assemblage of the REE mineralisation (Fig. 14a). Other REE-bearing accessory minerals present in the samples are therefore considered to be secondary, formed as a result of late- to post-magmatic alteration of the primary minerals.
Schematic representation of the progress of mineralisation in the Čistá nepheline syenite by fluid-induced metasomatic alteration. (a) Initial state of the host rock with primary REE-bearing minerals. (b) First stage of alteration during cooling. (c) Second stage of post-magmatic hydrothermal alteration mediated by alkali-rich fluids. Mineral-name abbreviations after Warr (Reference Warr2021), MixFcbri-Bri-Bst-Ap – fine-grained mixture of fluorcalciobritholite-(Ce), britholite-(Ce), bastnäsite-(Ce), apatite.

Alteration of monazite-(Ce) and related secondary minerals
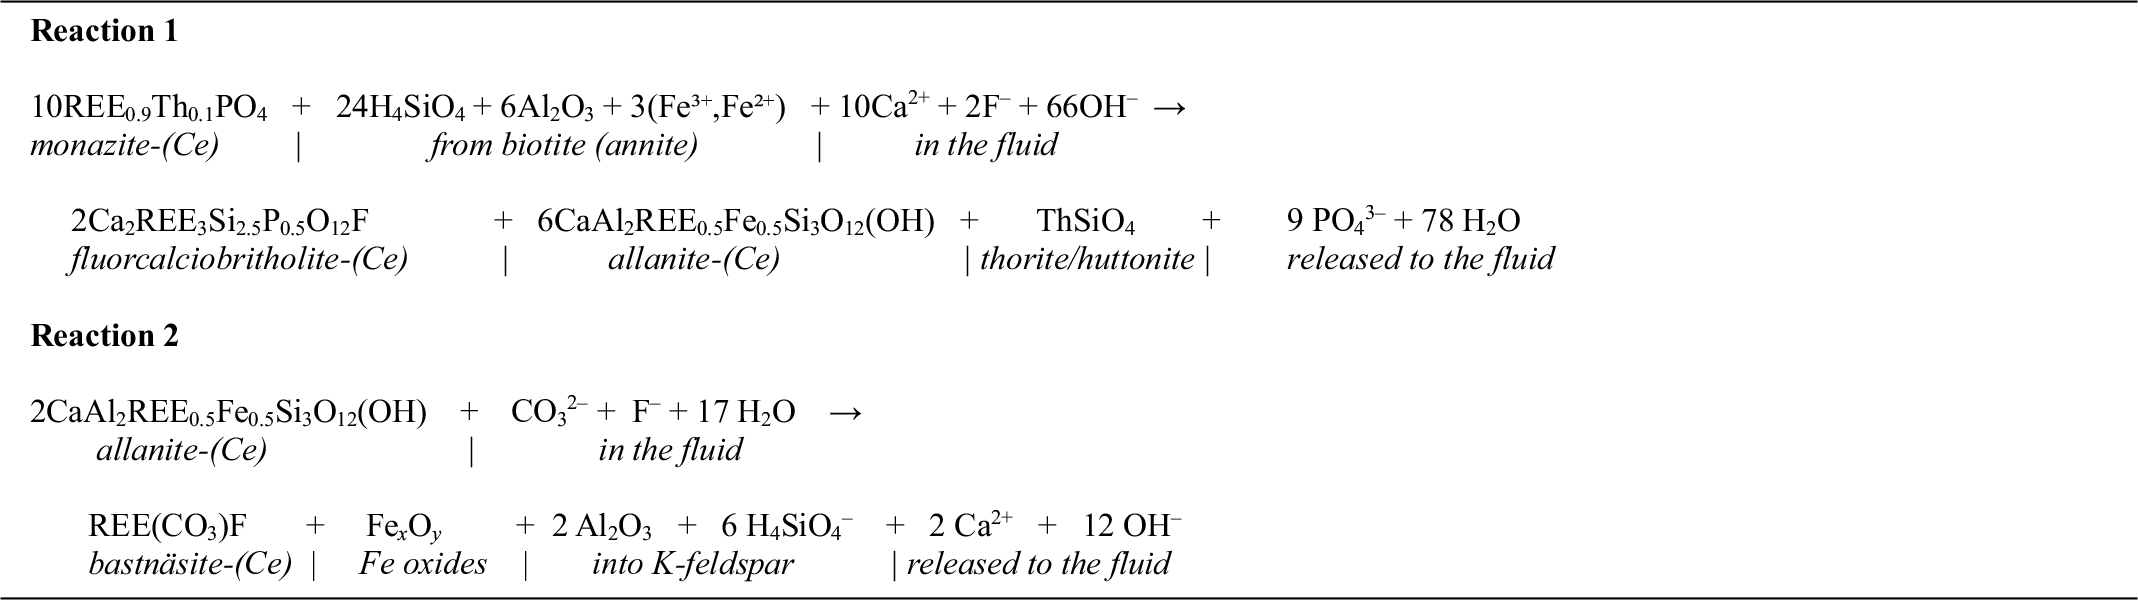
Monazite-(Ce) is present in almost all of the aggregates examined and is characterised by high concentrations of ThO2 (4.5–19.5 wt.%) and high Th/U ratios (87.3–266.5, Supplementary Material Table S2.1) indicating its igneous origin rather than formation during hydrothermal processes (cf. Poitrasson et al., Reference Poitrasson, Chenery and Bland1996, Reference Poitrasson, Chenery and Shepherd2000; Schandl and Gorton, Reference Schandl and Gorton2004; Zi et al., Reference Zi, Muhling and Rasmussen2023). The textural evidence indicates that monazite-(Ce) has been strongly affected by fluid-induced metasomatic processes and replaced by REE-bearing secondary minerals, which include allanite-(Ce), fluorcalciobritholite-(Ce), britholite-(Ce), bastnäsite-(Ce), ThSiO4 and, rarely, Th and U oxides. Considering the textural relationships and the compositional differences between the secondary minerals, they can be divided into two groups. The first group includes allanite-(Ce) and fluorcalciobritholite-(Ce), characterised by high concentrations of Ca, and the unidentified ThSiO4 grains (Figs 10, 11; Supplementary Material Tables S2.2, S2.3). The second group includes britholite-(Ce) and bastnäsite-(Ce), which have lower Ca concentrations compared to allanite-(Ce) and fluorcalciobritholite-(Ce). Britholite-(Ce) and bastnäsite-(Ce) are typically intergrown with each other and form fine-grained mixtures filling cracks and intersections between other REE-bearing minerals (Figs 4, 8). These observations suggest two separate stages of alteration during the evolution of REE mineralisation in the syenite. The first stage involved a partial breakdown of monazite-(Ce) and the formation of allanite-(Ce), fluorcalciobritholite-(Ce) along with release of Th, thus triggering the formation of ThSiO4 (Fig. 14b). This breakdown can be illustrated by the schematic Reaction 1 using average compositions of the minerals based on the EPMA data shown in Table 2.
Reactions 1 and 2, described in the text

This mechanism is similar to monazite-(Ce) replacement by apatite, allanite and REE-rich epidote during metamorphism (Broska and Siman, Reference Broska and Siman1998; Finger et al., Reference Finger, Broska, Roberts and Schermaier1998; Ondrejka et al., Reference Ondrejka, Molnárová, Putiš, Bačík, Uher, Voleková, Milovská, Mikuš and Pukančík2022). Based on the components participating in reaction 1, particularly the PO4 released from monazite-(Ce), as well as Ca and F present in the fluid, it is expected that apatite and/or fluorite should have formed amongst secondary minerals. However, in case of the samples investigated, even if apatite or fluorite were formed, they were not preserved at the microscale as only allanite-(Ce) and remnants of fluorcalciobritholite-(Ce) are present. At the submicron-scale, a small (∼600 nm in diameter) inclusion of poorly crystalline apatite formed near the altered domain of fluorcalciobritholite-(Ce) (Fig. 11g–i). Similar apatite inclusions can potentially be present in small quantities throughout the fine-grained aggregates replacing fluorcalciobritholite-(Ce). These occasional apatite occurrences can be the remnants from the initial monazite-(Ce) breakdown that could have been lost during further metasomatic evolution (Fig. 14b). These observations suggest a greater stability of fluorcalciobritholite-(Ce) compared to apatite when large amounts of REE are available in the alkali-rich environment (cf. Budzyń et al., Reference Budzyń, Harlov, Kozub-Budzyń and Majka2017, Reference Budzyń, Wirth, Sláma, Birski, Tramm, Kozub-Budzyń, Rzepa and Schreiber2021b).
The formation of allanite-(Ce) and fluorcalciobritholite-(Ce) as a result of monazite-(Ce) breakdown indicates elevated activities of Si and Ca in the system during alteration, promoting the formation of REE-silicates (Janots et al., Reference Janots, Engi, Berger, Allaz, Schwarz and Spandler2008; Budzyń et al., Reference Budzyń, Hetherington, Williams, Jercinovic and Michalik2010, Reference Budzyń, Harlov, Williams and Jercinovic2011, Reference Budzyń, Konečný and Kozub-Budzyń2015, Reference Budzyń, Harlov, Kozub-Budzyń and Majka2017). In order for allanite-(Ce) to form, Al3+ and Fe3+ must have been provided, probably by partial breakdown of annite (cf. Broska and Siman, Reference Broska and Siman1998; Finger et al., Reference Finger, Broska, Roberts and Schermaier1998). Additionally, a key factor constraining the stability of allanite-(Ce) is the amount of Ca in the system and the bulk Ca/Na ratio of the rock, as well as the temperature conditions during alteration (Lee and Dodge, Reference Lee and Dodge1964; Lee and Bastron, Reference Lee and Bastron1967; Petrík et al., Reference Petrík, Broska, Lipka and Siman1995; Gieré and Sorensen, Reference Gieré and Sorensen2004; Janots et al., Reference Janots, Negro, Brunet, Goffé, Engi and Bouybaouene2006, Reference Janots, Brunet, Goffé, Poinssot, Burchard and Cemič2007, Reference Janots, Engi, Berger, Allaz, Schwarz and Spandler2008; Spear, Reference Spear2010; Budzyń et al., Reference Budzyń, Harlov, Williams and Jercinovic2011, Reference Budzyń, Harlov, Kozub-Budzyń and Majka2017). In the case of granitoids with bulk Ca/Na ratios of ∼0.5 and below, allanite-(Ce) does not precipitate and monazite-(Ce) is stable (Lee and Dodge, Reference Lee and Dodge1964). The presence of allanite-(Ce) in the samples suggests that the host rock and fluids during the first stage of alteration must have contained more Ca than at present, and possibly less Na. In addition, the occurrence of unaltered monazite in the matrix suggests that the REE-bearing aggregates reflect localised geochemical conditions (micro-environments), where Ca-rich fluids penetrating the rock promoted the local precipitation of allanite-(Ce). Considering the stability relations between allanite-(Ce) and monazite-(Ce) in both natural and experimental studies, along with thermodynamic modelling, the temperature conditions at which allanite-(Ce) replaces monazite-(Ce) typically range from 450 to 600°C, depending on pressure conditions and the bulk amounts of Ca, Na and Al (Broska and Siman, Reference Broska and Siman1998; Finger et al., Reference Finger, Broska, Roberts and Schermaier1998; Wing et al., Reference Wing, Ferry and Harrison2003; Broska et al., Reference Broska, Williams, Janák and Nagy2005; Janots et al., Reference Janots, Brunet, Goffé, Poinssot, Burchard and Cemič2007, Reference Janots, Engi, Berger, Allaz, Schwarz and Spandler2008; Spear, Reference Spear2010; Budzyń et al., Reference Budzyń, Hetherington, Williams, Jercinovic and Michalik2010, Reference Budzyń, Harlov, Williams and Jercinovic2011, Reference Budzyń, Harlov, Kozub-Budzyń and Majka2017). As a result, the first stage of alteration in the Čistá nepheline syenite can be related to late-magmatic hydrothermal processes that occurred during cooling, roughly below ∼600°C, resulting in the breakdown of monazite-(Ce) and its replacement by allanite-(Ce), fluorcalciobritholite-(Ce), ThSiO4 and, possibly, apatite (Fig. 14b).
The second stage of alteration is related to the formation of new secondary minerals, including bastnäsite-(Ce), britholite-(Ce) and occasionally cerianite-(Ce), as a result of further fluid-induced metasomatic alteration (Fig. 14c). The formation of bastnäsite-(Ce) and cerianite-(Ce) can be explained by the transformation of allanite-(Ce) induced by the fluid enriched in F– and CO32–, as illustrated by the schematic reaction (cf. Gieré and Sorensen, Reference Gieré and Sorensen2004; Janots et al., Reference Janots, Negro, Brunet, Goffé, Engi and Bouybaouene2006, Reference Janots, Engi, Berger, Allaz, Schwarz and Spandler2008; Budzyń et al., Reference Budzyń, Hetherington, Williams, Jercinovic and Michalik2010) given in Reaction 2 in Table 2.
This type of allanite-(Ce) breakdown resulted in the formation of a symplectite-like intergrowth of bastnäsite-(Ce) and K-feldspar observed in the REE-bearing aggregates and also explains the formation of Fe oxides occurring in their vicinity (Figs 3, 4, 7, 8, 14c). Annite was one of the sources of K for K-feldspar, and F for bastnäsite-(Ce) formation, similarly to the initial reaction of monazite-(Ce) breakdown (reaction 1). The preserved allanite-(Ce) appears homogeneous in BSE imaging (Figs 3a–c, 4). However on the submicron-scale the grains exhibit weak internal zoning and form a well-defined irregular phase boundary with aggregates of britholite-group minerals located in the internal parts of the clusters (FIB foil F1 in Fig. 10a,b). In the environment of the syenite, which has a small amount of CaO (0.54 wt.%; Table 1), allanite-(Ce) seems to be a metastable phase. Because both the depletion of Ca from the rock and alteration of the REE-bearing minerals were probably caused by the same episode of hydrothermal activity. The unusual preservation of allanite-(Ce) suggests that the alteration episode was relatively short-lived and ceased before all of the available allanite-(Ce) reacted, thus resulting in an incomplete replacement. It is possible that the formation of polymineral aggregates between allanite-(Ce) and other REE minerals restricted the alteration to some degree.
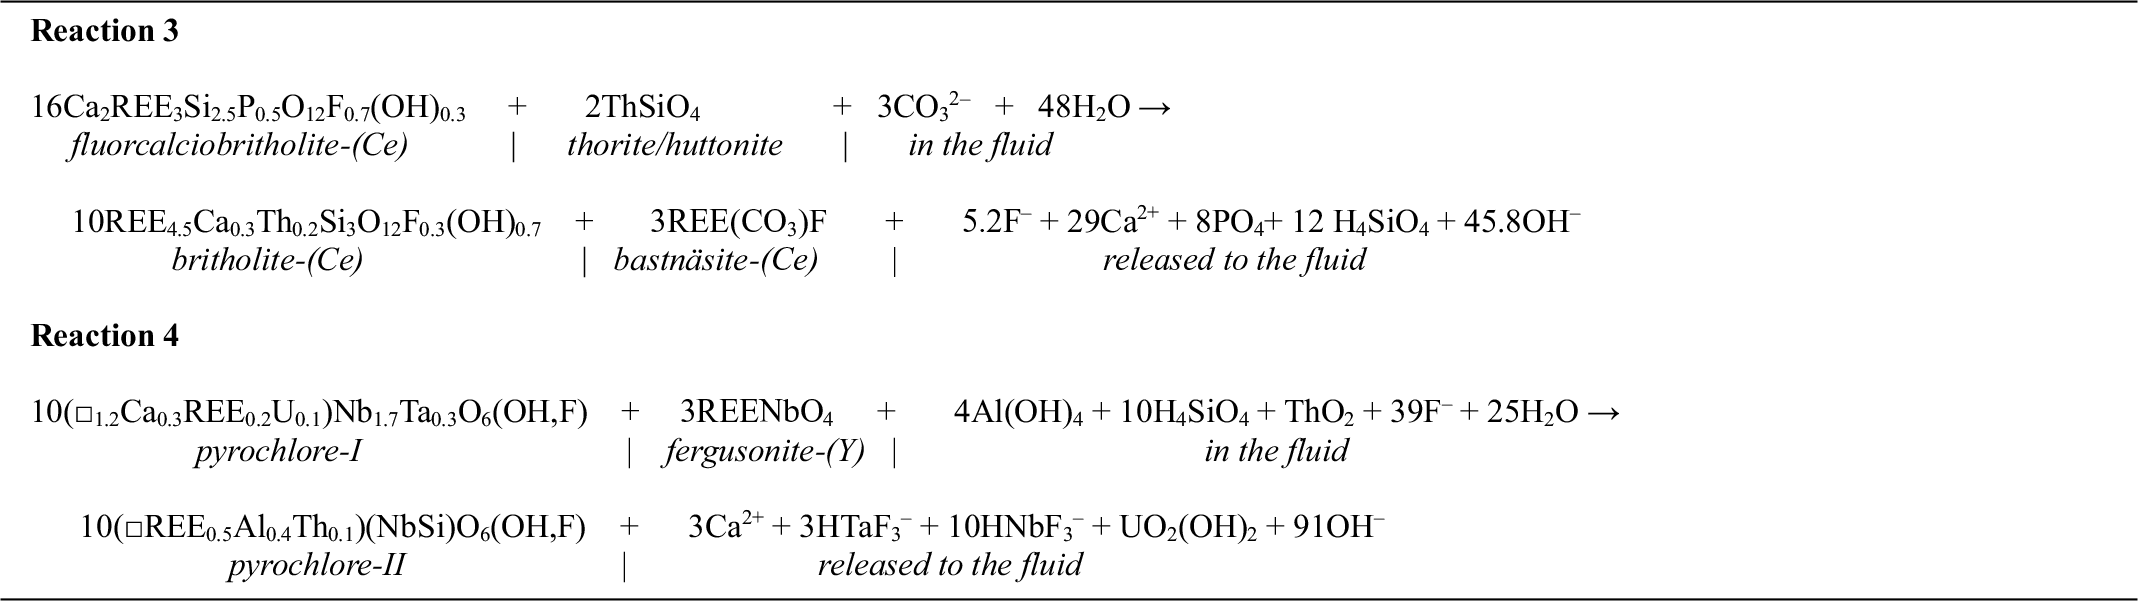
Fluorcalciobritholite-(Ce), compared to allanite-(Ce), is more severely affected by the second stage of alteration. Fluorcalciobritholite-(Ce) is heterogeneous and exhibits patchy zoning on a micro- and submicron-scale (Figs 4, 10b, 11b, g–j). As a result of the alteration, fluorcalciobritholite-(Ce) is partially replaced by Ca- and P-depleted britholite-(Ce) and fine-grained aggregates of britholite-group minerals commonly intergrown with bastnäsite-(Ce) (Figs 3c, 4, 11b–j). The process of fluorcalciobritholite-(Ce) breakdown can be illustrated by the schematic Reaction 3 given in Table 3.
Reactions 3 and 4, described in the text

Secondary britholite-(Ce) is depleted in Ca, P and F, and contains much more Th than fluorcalciobritholite-(Ce) (Supplementary Material Table S2.2). Additionally, it is free of ThSiO4 inclusions, indicating that the Th enrichment in the crystal lattice of britholite-(Ce) may be related to the incorporation of Th as ThSiO4 inclusions in fluorcalciobritholite-(Ce) during the second stage of alteration. The presence of nanocrystalline aggregates of bastnäsite-(Ce) and britholite-(Ce) within the altered fluorcalciobritholite-(Ce) (Figs 10d,e, 11d) suggests simultaneous formation of secondary britholite-(Ce) and bastnäsite-(Ce) during the second stage of alteration. Incomplete breakdown of fluorcalciobritholite-(Ce) supports the hypothesis of the alteration ceasing before the complete formation of the secondary minerals. Fine-grained aggregates represent the intermediate step in the replacement of fluorcalciobritholite-(Ce).
The presence of bastnäsite-(Ce) among the secondary minerals clearly indicates that CO2 was available in the fluid during the second stage of alteration. This is further supported by the presence of cancrinite in the sample, partially replacing the nepheline in a reaction caused by CO2-rich fluids (Słaby, Reference Słaby1999; Bonaccorsi and Merlino, Reference Bonaccorsi and Merlino2005; Pekov et al., Reference Pekov, Olysych, Chukanov, Zubkova, Pushcharovsky, Van, Giester and Tillmanns2011; Dumańska-Słowik et al., Reference Dumańska-Słowik, Pieczka, Heflik and Sikorska2016). The formation of bastnäsite-(Ce) during hydrothermal reactions in alkali-rich environments has been reported to proceed in the lower temperature range of 200–450°C (Smith et al., Reference Smith, Henderson and Campbell2000; Gysi and Williams-Jones, Reference Gysi and Williams-Jones2015; Guo and Liu, Reference Guo and Liu2019). Therefore, metasomatic processes affected the REE-bearing assemblage during the second stage of alteration after cooling approximately below 450°C. There is no evidence of precipitation of any secondary REE-bearing phosphates in the sample during the second stage of alteration, which together with the depletion in Ca and PO4 in the composition of bulk rock and secondary britholite-(Ce) and bastnäsite-(Ce) indicates removal of these components from the system by the acting fluids. Strongly alkaline conditions with high-activity of CO2 and low Ca/Na ratios destabilised allanite-(Ce), promoting the formation of bastnäsite-(Ce) and hindering the activity of PO4 in the system allowing for its transport (Janots et al., Reference Janots, Engi, Berger, Allaz, Schwarz and Spandler2008; Budzyń et al., Reference Budzyń, Harlov, Williams and Jercinovic2011, Reference Budzyń, Konečný and Kozub-Budzyń2015, Reference Budzyń, Harlov, Kozub-Budzyń and Majka2017; Louvel et al., Reference Louvel, Etschmann, Guan, Testemale and Brugger2022; Di and Ding, Reference Di and Ding2024). The second stage of alteration clearly differs from the first stage both in terms of the temperature conditions and the composition of the active fluids, and therefore it is interpreted as related to the post-magmatic hydrothermal processes in the evolution of the syenite.
Alteration of pyrochlore, fergusonite-(Y) and gadolinite group minerals
Pyrochlore, fergusonite-(Y) and gadolinite-group minerals were also affected during the first and second stages of alteration, although their metasomatic transformations resulted only in limited precipitation of new secondary minerals. Instead, altered domains and/or a second generation of the same minerals with a changed composition were formed. Hydrothermal alteration of primary pyrochlore-I caused the formation of altered domains depleted in Ta (8.9–21.3 vs. 1.3–5.4 wt.% Ta2O5 in unaltered and altered domains, respectively; Fig. 7c). Recrystallisation started at the edges of the grains and progressed inwards (Fig. 12a), which resulted in a well-defined alteration front typical of fluid-induced, coupled dissolution–reprecipitation reactions (cf. Putnis, Reference Putnis2002; Putnis et al., Reference Putnis, Hinrichs, Putnis Ch, Golla-Schindler and Collins2007; Fig. 12f,g). Inclusions of U-rich oxides formed in the altered domains of the first pyrochlore-I, whereas Ta was probably removed by the fluids (Green and Pearson, Reference Green and Pearson1987; Figs 12a–c,f,g, 14b). The presence of U-rich inclusions explains the high U content in the altered pyrochlore in the EPMA data (Supplementary Material Table S2.5). Because U incorporated into the pyrochlore structure is considered to be relatively stable (Lumpkin and Ewing, Reference Lumpkin and Ewing1995; Lumpkin, Reference Lumpkin2001), high-temperature conditions of ∼450–500°C are required for U to be released and precipitate as U-oxide inclusions in the altered domains (Lumpkin and Ewing, Reference Lumpkin and Ewing1995; Lumpkin, Reference Lumpkin2001; Wu et al., Reference Wu, Hu, Bonnetti, Xu, Wang, Zhang, Li and Yin2021; Bollaert et al., Reference Bollaert, Chassé, Neto, Horbe, Allard, Menguy, Le Guillou, Courtin, Quantin, Vantelon, Troadec, Galoisy and Calas2024). These temperature conditions, together with only minor changes in REE and Ca concentrations between altered and unaltered pyrochlore-I domains, support the conclusion that this alteration is related to the late-magmatic hydrothermal processes in the first stage of alteration.
The formation of pyrochlore-II represents a definitive shift in the nature of processes affecting the environment. Pyrochlore-II is depleted in Ca, U, Ta and Nb, which, considering Ca, is a similar characteristic as in other secondary minerals that formed during the second stage of alteration (Fig. 14c; Supplementary Material Table S2.5). At the same time, other components, such as Si, Al, Th and REE, are enriched in the crystal structure of pyrochlore-II. Similar cation exchange and incorporation of these elements into pyrochlore structure were reported in natural and experimental studies on pyrochlore, generally in the context of alteration under temperature conditions of 150–300°C (Lumpkin and Ewing, Reference Lumpkin and Ewing1995; Lumpkin, Reference Lumpkin2001; Geisler et al., Reference Geisler, Berndt, Meyer, Pollok and Putnis2004; Pöml et al., Reference Pöml, Menneken, Stephan, Niedermeier, Geisler and Putnis2007; Deditius et al., Reference Deditius, (Skomurski) Smith, Utsunomiya and Ewing2015). Based on these observations, the formation of pyrochlore-II is interpreted to be a result of post-magmatic metasomatic processes related to the second alteration stage. Fluid-mediated alteration of pyrochlore-I, and probably also of fergusonite-(Y), caused the release of Nb, Y and other REE, which facilitated the formation of the secondary pyrochlore generation (Green and Pearson, Reference Green and Pearson1987). The enrichment of pyrochlore-II in Si, Al and REE possibly occurred simultaneously with the process of allanite-(Ce) breakdown and its replacement by bastnäsite-(Ce), which was one of the potential sources of these elements. A possible mechanism for the described alteration can be illustrated with the following simplified Reaction 4, given in Table 3.
With respect to fergusonite-(Y) and gadolinite group minerals, the effect of late- to post-magmatic alteration is less clear. There is no direct evidence of alteration of these minerals during the first stage of hydrothermal activity. The presence of pyrochlore-II as intergrowths with altered domains of fergusonite-(Y) suggests that the alteration of the fergusonite-(Y) occurred at the late stage of fluid-induced metasomatic processes.
Fluid-induced alteration has two effects on gadolinite-(Ce), depending on the accompanying minerals in the REE-bearing mineral aggregates. In the first type, where gadolinite-(Ce) is enclosed in the aggregates and accompanied by monazite-(Ce), britholite-(Ce), allanite-(Ce) and bastnäsite-(Ce), its composition is changed towards solid-solution of gadolinite with higher concentrations of Y, MREE, and especially Nd (Supplementary Material Table S2.6; Figs 2h, 3a,c, 14c). The second type of alteration affected gadolinite-(Ce) grains located in the vicinity of fergusonite and pyrochlore-I. In this case, an alteration rim formed around the gadolinite-(Ce) grains, where irregular gadolinite-(Y) appears (Figs 3d, 14c). Gadolinite-(Y) fills the intersections and is typically intergrown with bastnäsite-(Ce), which suggests that it formed during the later stages of hydrothermal alteration (Fig. 13c). The previously described replacement of fergusonite-(Y) by pyrochlore-II and the potential release of REE, including large amounts of Y, acted as a trigger for the precipitation of gadolinite-(Y) around gadolinite-(Ce).
Geochronology of monazite-(Ce) in the context of the Čistá pluton
Previous geochronological studies which focused on zircon from the Čistá pluton indicated that the initial magmatic event for the granodiorite intrusion occurred between ∼390 and 370 Ma (Venera et al., Reference Venera, Schulmann and Kröner2000; Žák et al., Reference Žák, Kratinová, Trubač, Janoušek, Sláma and Mrlina2011; Deiller et al., Reference Deiller, Štípská, Ulrich, Schulmann, Collett, Peřestý, Hacker, Kylander-Clark, Whitechurch, Lexa, Pelt and Míková2021). Here, U-(Th)-Pb age determination of monazite-(Ce) provides new geochronological data related to the emplacement of REE mineralisation with a potential link to the emplacement of the Čistá intrusion. Highly discordant monazite-(Ce) data, with 238U/206Pb ages ranging from 373 to 3373 Ma (Supplementary Material Table S3.1) and scattered along the regression line on the Tera-Wasserburg concordia diagram, indicate the presence of substantial amounts of common Pb (Fig. 9a), which has been increasingly reported in monazite-(Ce) from igneous and metamorphic rocks (cf., Seydoux-Guillaume et al., Reference Seydoux-Guillaume, Montel, Bingen, Bosse, De Parseval, Paquette, Janots and Wirth2012; Didier et al., Reference Didier, Bosse, Boulvais, Bouloton, Paquette, Montel and Devidal2013; Skrzypek et al., Reference Skrzypek, Bosse, Tetsuo Kawakami, Martelat and Štípská2017; Jastrzębski et al., Reference Jastrzębski, Żelaźniewicz, Budzyń, Sláma and Konečný2020, Reference Jastrzębski, Budzyń, Żelaźniewicz, Konečný, Sláma, Kozub-Budzyń, Skrzypek and Jaźwa2021, Reference Jastrzębski, Żelaźniewicz, Stawikowski, Budzyń, Krzemińska, Machowiak, Madej, Białek, Sláma, Czupyt and Jaźwa2023; Barnes et al., Reference Barnes, Majka, Jeanneret, Ziemniak, Kooijman, Kośmińska, Kielman-Schmitt and Schneider2021; Budzyń et al., Reference Budzyń, Sláma, Corfu, Crowley, Schmitz, Williams, Jercinovic, Kozub-Budzyń, Konečny, Rzepa and Włodek2021a, Reference Budzyń, Wirth, Sláma, Kozub-Budzyń, Rzepa and Schreiber2022). Regardless of the strong alteration of monazite-(Ce) and its replacement by secondary minerals, there is no evidence of fluid-induced reactions that might have resulted in compositional alteration and age disturbance related to U- or Pb-loss in the preserved monazite-(Ce) grains. In contrast to U-Pb data, 208Pb/232Th age determinations are uniform and mostly undisturbed, with only several outliers (Fig. 9). The lower intercept of 376 ± 9.9 Ma at the Tera-Wasserburg concordia diagram, which is roughly the same as the 208Pb/232Th mean age of 375 ± 3.2 Ma, together with the compositional evidence for igneous origin of the monazite-(Ce) and textural relations showing its replacements during late-magmatic alteration, indicate the crystallisation age of the primary mineralisation during the main magmatic event of the Čistá pluton (Figs 9c,d, 14a). Further geochronological investigations are required to reconstruct later history of the post-magmatic hydrothermal and low-temperature events.
Conclusions
The nepheline syenite from the Čistá pluton contains diverse REE-bearing minerals, which exhibit a wide variety of microtextures related to complex replacement processes. The application of comprehensive analytical methods provided new insights on the stability relations of REE-bearing minerals and on different alteration processes during late- to post-magmatic processes. The primary REE and HFSE mineralisation is related to the magmatic event during the emplacement of the Čistá granodiorite pluton at 375 ± 3.2 Ma. Later alteration is related to two stages, the first of which occurring during cooling below ca. 600°C, and resulting in monazite-(Ce) breakdown and its replacement by allanite-(Ce) and fluorcalciobritholite-(Ce). Simultaneously, the first generation of pyrochlore (primary pyrochlore-I) was altered via coupled dissolution–reprecipitation processes, resulting in precipitation of U-oxide inclusions in the altered pyrochlore-I domains. The second stage of alteration is related to alkali-rich fluids interacting with the REE-bearing assemblage under temperature conditions of ca. 200–350°C inducing depletion in Ca and further transformation of the primary minerals. Metasomatic processes induced by fluid with high activity of CO2 resulted in bastnäsitisation of allanite-(Ce) and the replacement of fluorcalciobritholite-(Ce) by britholite-(Ce) and bastnäsite-(Ce) aggregates. During this stage, primary pyrochlore-I and fergusonite-(Y) were also affected and supplied Nb and Y for precipitation of pyrochlore-II. Gadolinite-(Ce) was partially altered and replaced by the gadolinite-(Ce) and gadolinite-(Y) solid-solution and/or gadolinite-(Y).
In summary, the petrochronological data provide new insights into the formation of REE and HFSE mineralisation in nepheline syenite from the Čistá pluton. A detailed characterisation of the accessory minerals hosting the mineralisation is crucial for assessing the site’s potential as a deposit for critical elements. Additionally, constraints on the stability of these minerals during fluid-induced alteration enhance our understanding on REE and HFSE enrichment processes in alkali-rich environments.
Supplementary material
The supplementary material for this article can be found at https://doi.org/10.1180/mgm.2025.10094
Acknowledgements
Josef Klomínský is acknowledged for discussions and providing the sample for this study. The authors acknowledge R. Mitchell for editorial handling, and S. Salvi and anonymous reviewer for insightful and constructive comments.
Financial statement
This work was supported by the National Science Centre research grant no. 2017/27/B/ST10/00813 (to B.B.). J.S. was supported by the ASCR institutional support RVO67985831.
Conflict of interest
The authors declare that there are no known conflicts of interest that affected data acquisition or the interpretations presented.