

1. Introduction
In 1960, the economy of west Cork, located in the extreme south west of Ireland, was principally dependent on small-scale, low-productivity agriculture and was overwhelmingly experiencing long term decline. Two generations on, economic activity has been strikingly and largely unexpectedly transformed, symbolised by the appearance of enterprise parks and art galleries, at least before a sharp deterioration in 2007–9. This article surveys west Cork's economic history over the fifty-year period from 1960 to 2009 inclusive, providing a sub-county case study to complement national level analyses of rural change (e.g. O'Connor et al., Reference O'Connor, Gorman, Wilson, Kinsella, O'Connor, Renting, Gorman and Kinsella2006; McDonagh et al., Reference McDonagh, Varley and Shortall2009) and Irish research on convergence over time in regional per capita income/productivity (e.g. O'Leary, Reference O'Leary2003). What follows builds upon a report by Commins (Reference Commins1999) which tracked selected changes in west Cork up until the mid-1990s. As well as updating it, this article extends Commins’ work by incorporating additional indicators and analysis. The approach, then, adheres to a ‘rural observatory’ method, whereby researchers re-examine a locality to ascertain continuity and change (e.g. Havinden, Reference Havinden1999). The very significant alterations in Ireland's macroeconomy and economic policies since the mid-1990s (Clinch et al., Reference Clinch, Convery and Walsh2002; Matthews, Reference Matthews, O'Hagan and Newman2008; O'Donoghue, Reference O'Donoghue and Kinsella2010) make revisiting west Cork a worthwhile exercise. Although selective, the discussion herein provides a more rigorous overview than was possible in other recent insightful accounts (Crowley, Reference Crowley2006: chapter 7; Sheehan, Reference Sheehan2007;Footnote 1 Hopkin, Reference Hopkin2008).
Section 2 below defines the study region and outlines the largely depressed state of its economy at the beginning of the 1960s, when Boland's 1958 polemic described west Cork as ‘Ireland's blackest emigration district’ (p. 10). The early 1960s provide an opportune baseline due to the availability of data in the pioneering West Cork Resource Survey (Murphy, Reference Murphy1963). In section 3, subsequent economic changes up until around 2006 are summarised chiefly using statistics from Censuses of Population and Agriculture. Major post-1960 developments include the rapid reversal of long-standing depopulation and the growth of employment in services. Section 4 discusses some causes of the region's regeneration. West Cork has been able to take advantage of several national and global socioeconomic changes, such as advances in information and communication technologies and the remarkable increases in Irish disposable income arising from the ‘Celtic tiger’ macroeconomic growth. Local initiatives, including a pioneering regional brand network, and net inmigration have also contributed to the turnaround. Unfortunately it is not easy to isolate the relative importance of the various causal factors. Section 5 concludes, in the context of west Cork's troubled economic position in 2007–9.
2. The west Cork economy, c.1960
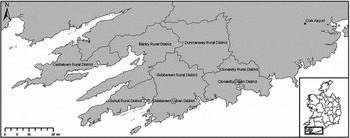
West Cork is situated on the south-west Irish coast, with three peninsulas and several small islands. Its geographical location is not formally defined, but following Commins (Reference Commins1999) the study area is demarcated as the six census rural districts of Bantry, Castletown, Clonakilty, Dunmanway, SchullFootnote 2 and Skibbereen, together with the two urban districts, or towns, of Clonakilty and Skibbereen (Figure 1). These eight rural and urban districts contain ninety-four electoral divisions, the smallest spatial unit for which many statistics are published.Footnote 3 Their boundaries have remained unchanged over the time period discussed herein (personal communication, Department of the Environment, Heritage and Local Government).
West Cork, Ireland.
Source: Urban Institute Ireland, University College Dublin. Mapping by Ordnance Survey Ireland, permit APL0001910, © Government of Ireland.

Responding to a request for assistance from concerned local organisations, during the period 1960 to 1962 researchers from An Foras Talúntais,Footnote 4 now part of Teagasc, surveyed the socioeconomic and physical resources of the region as defined above, except for Clonakilty rural district and urban district. A confidential summary of this major undertaking, the first of its kind in Ireland, was sent to the Department of An Taoiseach (Prime Minister) in August 1962: changes in local cropping patterns and livestock numbers seemingly attracted most attention there. After an unexpected delay, the full survey was published nine months later (Murphy, Reference Murphy1963).Footnote 5 It can be supplemented with other sources, including the handwritten Small Area Population Statistics from the 1961 Population Census.Footnote 6
2.1. Appraisal
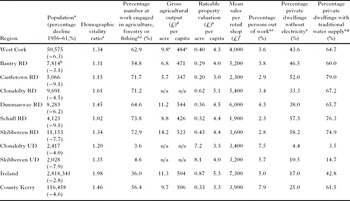
West Cork at this time was in general long term economic decline. The study region in Murphy (Reference Murphy1963) was ‘a low income area for the major portion of the farm families and for a considerable portion of the non-farm families’, with the community facing ‘serious problems’ (p. D23). The chronic reduction in population is the most salient indicator of long run decline. By the turn of the 1960s, depopulation had been ongoing for more than a hundred years – Skibbereen is notorious for the suffering it endured during Ireland's great potato famine of the 1840s – and parts of west Cork possessed less than a third of their population of 1861. Table 1 shows data on population and other economic indicators in c.1960 for west Cork, its eight constituent rural districts and urban districts and two comparator areas that will be used throughout this article, the Republic of Ireland as a whole and county Kerry, located immediately north west of the study region. West Cork's then current rate of population decline was relatively heavy and was accelerating because there was no longer a natural increase of births over deaths to partially offset the very sizeable net outmigration from the area (Commins, Reference Commins and Murphy1963). Moreover the population lacked strong representation of the age groups typically associated with economic dynamism. The ‘demographic vitality’ ratio (Commins et al., Reference Commins, Walsh and Meredith2005) measures the number of twenty to thirty-nine year olds expressed as a ratio of persons aged sixty-five and over: west Cork's ratio was lower than in Ireland as a whole and neighbouring county Kerry.
Economic indicators, west Cork and comparator areas, c.1960.

Notes: Data pertain to 1960 unless otherwise stated. Population is de facto, that is including visitors and omitting usual residents absent on census night. RD denotes rural district and UD denotes urban district.
a In 1961.
b Including 2,234 in Bantry town.
c Principal status of those aged fourteen years and over.
d Includes consumption of own produce. Based on total land and males engaged in agriculture.
e Across the five rural districts for which figures are reported.
f In c.1956, rounded to nearest £100. Stevens (Reference Stevens and Murphy1963) attempted to adjust for non-response, but his estimates do not materially differ.
g Sourced from a public well, pump etc. (not public mains or private piped).
Sources: Unpublished and published Central Statistics Office Small Area Population Statistics from 1961 Population Census; Central Statistics Office (n.d.; 1962); Attwood and Fennell (Reference Attwood, Fennell and Murphy1963); Attwood and Geary (Reference Attwood and Geary1963).
More than three-fifths of west Cork workers were principally occupied in agriculture, forestry or fishing (column three), with agriculture being dominant (Central Statistics Office, n.d.: table 27; Murphy, Reference Murphy1963: B80, B82). Almost all farms were mixed enterprises (generally owner-occupied) but the key farming system was livestock, especially dairying. Even excluding the large tracts of rough grazing land, seventy per cent of farmland was under pasture. Dairying accounted for nearly two-fifths of the total value of agricultural output in the five rural districts west of Clonakilty rural district, with cattle and pigs each comprising just over a further fifth and crops only 7.6 per cent (Attwood and Fennell, Reference Attwood, Fennell and Murphy1963: table 13). West Cork's agricultural output per acre and per capita may not have been greatly below the national average (Table 1), but as many as forty per cent of holdings west of Clonakilty were just one to thirty acres in size (0.4–12.1 hectares) and ‘a very high proportion’ of farms were very low output operations lacking financial viability (Attwood, Reference Attwood and Murphy1963; Attwood and Fennell, Reference Attwood, Fennell and Murphy1963: quotation at p. C42). Grassland production was characterised by poor sward management, insufficiently widespread use of fertilisers and inadequate winter feed; hence stocking rates were well below what was technically feasible (Conway and Nolan, Reference Conway, Nolan and Murphy1963). Mechanisation was extremely limited; for instance, approximately four-fifths of dairy farmers milked by hand (Curran et al., Reference Curran, Cowhig, O'Grady and Murphy1963: B63–5). Meanwhile west Cork's second major primary industry, fishing, was still suffering from the collapse of the United States salted mackerel trade in the 1930s. Most employment was part-time and excessively concentrated on coastal waters. Downstream fish-handling and upstream boatyards were adversely affected by low demand (State Fisheries Division, Reference Murphy1963; Nolan, Reference Nolan2003: chapters 4–5). More positively, the local area of state forestry land, and associated employment, had increased considerably in recent years (State Forestry Division, Reference Murphy1963).
The accuracy of rateable property valuations was seriously questioned at the time because they had not been systematically updated since the mid-nineteenth century (Walker, Reference Walker1962: 13–15; idem, 1964). For what the comparison in Table 1 is worth, west Cork's per capita mean was one pound below that for the state but one pound above that for county Kerry. The west Cork-Ireland gap widens further when property valuations are expressed in per acre terms, with the west Cork figure being only about half the national average. This is also the order of magnitude of the gap when comparing mean sales per shop, with the west Cork figure again being a little above that for Kerry. The study area's reported unemployment rate was low in both absolute and relative terms, but this statistic needs to be treated with great caution because there must have been much hidden unemployment in agriculture and through outmigration. The final two columns of Table 1 show that many dwellings lacked electricity (partly because power lines had not yet reached all areas and partly because households were unwilling, or could not afford, to purchase it) or a modern form of water supply. Indeed up to a third of households outside the towns had to draw water from a well or other source over one hundred yards distant (Commins, Reference Commins and Murphy1963: C97–9).
Cuddy (Reference Cuddy, Phelan, Bogue and Mulhall2005) highlighted three factors that generally inhibit rural economic growth. Each more or less applied to early-1960s west Cork. The first was a relatively low degree of integration into the global market economy. West Cork is geographically distant from major national and European markets, being situated on the periphery of Ireland which itself is on Europe's periphery. The region's road infrastructure was poor, and despite vehement local opposition, its rail network was closed in April 1961 (Johnson, Reference Johnson2005). Cork airport, situated outside Cork city to the east of the study area, did open in the same year, but flights were few and very expensive. In addition, as noted above west Cork's farm structure was numerically dominated by inefficient smallholdings producing only a small marketable surplus. Although its mild climate gave the region the advantage of a long grass growing and early growing season, agricultural intensification was seriously hindered by an extremely unfavourable land endowment. Only about a third of the area west of Clonakilty rural district contains medium or high quality soils (Conry and Ryan, Reference Conry, Ryan and Murphy1963). Much of the north and west is mountainous rocky terrain, suitable for little more than extensive grazing. Cuddy secondly noted the problem of specialisation in agriculture: typically the low price and income elasticities of demand for commodities contribute to making real farm gate output prices unstable and decline on trend over time, pressurising family farm incomes. Murphy (Reference Murphy1963) made almost no mention of output prices, understandably considering the small marketable surplus produced on most west Cork holdings, but national data indicate clear price volatility and some suggestion of a ‘cost-price squeeze’ (O'Carroll, Reference O'Carroll1962: chapter 9) which might have been experienced by the largest local farmers. More seriously, as Attwood (Reference Attwood and Murphy1963) identified, west Cork lacked the non-agricultural employment opportunities necessary to absorb surplus labour pushed out of farming. This was in some degree due to Cuddy's third, spatial factor. Low population density severely inhibited entrepreneurial activity not linked to agriculture because local demand, labour supply and infrastructure were very limited compared to urban centres such as Dublin.
These problems were exacerbated by a low level of human capital. Just thirteen per cent of residents surveyed by Murphy (Reference Murphy1963: C100–3) had received full-time education beyond primary school, and the figure fell to four per cent among the farming community. Jackson (Reference Jackson1967: 18–24) found far higher rates of post-primary education around Skibbereen town, unsurprisingly since secondary schools were situated there, yet still almost no one in his survey had been educated to third (University) level. Finally, Boland (Reference Boland1958) argued that west Cork had been neglected by the national government and state-controlled agencies who had allocated their capital spending, and grant aid to attract new industries, to other depressed regions. This ‘disgraceful scandal’, he railed, was due to west Cork's lack of political influence, since it had no marginal seats or senior level politicians, and was distant from Dublin-based civil servants.Footnote 7 Despite initiatives such as upgrading Castletownbere harbour, locals agreed that the state was insufficiently committed to assisting the depressed fishing industry (Nolan, Reference Nolan2003: chapter 5). All these and other factors, then, combined to produce outmigration as local people sought opportunities elsewhere, thereby producing a cumulative process of economic decline. Morale was low. And this was occurring against a national backdrop also characterised by chronic poverty and emigration, albeit with recent improvement coinciding, inter alia, with the government's shift away from a policy of protectionism (Ó Gráda, Reference Ó Gráda and Miley2008b).
2.2. Intra-region variation
Economic decline was not, however, homogenous across west Cork. There was a reasonably clear division between Bantry, Castletown and Schull rural districts in the west and the generally better positioned eastern rural districts of Clonakilty, Dunmanway and Skibbereen. The three western rural districts were particularly disadvantaged in terms of, among other things, land quality and distance from markets; correspondingly agricultural productivity, population decline and retail sales were typically worse there than in the east (Table 1). Average family farm income was as much as forty-four per cent higher in Dunmanway and Skibbereen rural districts compared to Bantry, Castletown and Schull (weighted average, Attwood and Fennell, Reference Attwood, Fennell and Murphy1963: table 15), reflecting the greater extent of productive dairy and cattle farming in the eastern rural districts and the more low-intensity sheep production in the west. The far west peninsula rural district of Castletown clearly had the most acute economic problems; Clonakilty rural district was at the other extreme. For example, on the estates of the Shelswell-White family of Bantry House, which provided a small amount of employment, accumulated rent arrears in June 1961 which were ‘probably irrecoverable’ totalled 37.7 per cent of the annual rental on the Castletownbere estate compared to almost zero on the Bantry and Glengarriff estates.Footnote 8 Despite concerns about the rateable property valuations in Table 1, they appear to be a reasonable measure of relative prosperity, since as expected the values fall from east to west.
Taking the indicators in Table 1 at face value, the two urban districts do not seem to have been more affluent than the rural hinterlands for which they acted as service centres. The urban districts' rateable property valuations per capita are among the lowest, and their unemployment rates the highest, in west Cork. Of course allowance must be made for the non-updating of property valuations and underemployment in agriculture, but equally their sales per shop are below the regional mean. Depopulation in Clonakilty urban district was low by local standards, but that in Skibbereen was the greatest of all the urban districts in county Cork. Skibbereen was a small market town which now lacked manufacturing industry and large employers. Many of its businesses were under pressure because the farm trade on which they traditionally relied was declining, due to factors such as increased competition from out-of-town creamery outlets and the decline of the customary fair days arising from the use of the mart for livestock sales (Jackson, Reference Jackson1967). The minutes of Clonakilty Urban District Council meetings during 1960–1, meanwhile, reveal a concern with the lack of industry in the town, along with perennial problems such as the condition of the roads and access to public transport.Footnote 9 The study area's third major town, Bantry, was also losing its traditional fairs, although a hospital and a very small-scale, foreign-owned pharmaceutical company (Rowa) had just opened (Eipper, Reference Eipper1986: chapter 3). In west Cork's towns and villages there was generally a surplus of uneconomic family-run shops and bars, and shops-come-bars, with low turnover and no paid employees which eventually would have to close.Footnote 10
2.3. Apparent prospects
Economic theory gives no unambiguous prediction of whether laggard regions will ‘catch-up’ on their more advanced counterparts. Absolute β convergence among regions to a similar steady state of per capita income is possible, if diminishing returns to capital and labour apply; but conversely endogenous growth theory predicts that favoured regions will move further ahead (Barro and Sala-i-Martin, Reference Barro, Sala-i-Martin, Barro and Sala-i-Martin2003). For Ireland, the empirical evidence across multi-county regions is also mixed (Boyle et al., Reference Boyle, McCarthy and Walsh1998/9; O'Leary, Reference O'Leary2001; idem, 2003). Certainly contemporaries believed that despite, or perhaps because of, the obvious problems, early-1960s west Cork had clear development potential, at least in farming, forestry and fishing if the resources required were available (Murphy, Reference Murphy1963). Nonetheless Attwood and Fennell (Reference Attwood, Fennell and Murphy1963: C42) warned that it ‘seems most unlikely that any feasible scheme of development would turn the great majority of the unviable [farm] holdings into strong economic units’, and they predicted continuing concentration through amalgamation of smallholdings on the death/retirement of their occupiers. Presciently, tourism was seen as a key future growth sector: west Cork's scenic beauty, alongside the diffusion of the motor car, was already attracting increasing visitor numbers to areas beyond the traditionally popular Glengarriff village. Improvements to Clonakilty's townscape and a bird observatory on Cape Clear Island were among the initiatives to promote tourism. ‘Steep’ rises in property prices were occurring along the coast on the back of such developments (Jackson, Reference Jackson1967: 9; Eipper, Reference Eipper1986: 30). Yet while there was potential, in Skibbereen at least Jackson also identified some complacency about the scale of the changes required to achieve economic sustainability and a possible barrier arising from small farms and shops being a customary part of community life. Boland (Reference Boland1958: 3, 16) was blunter: ‘Will things [depopulation] improve? Certainly not’, unless there was ‘immediate capital investment’.
3. Subsequent changes, c.1960–c.2006
Commins (Reference Commins1999), a member of the original survey team, updated parts of Murphy (Reference Murphy1963) by outlining changes in population, numbers at work and the farm economy. This section updates his study for the years up to the 2006 Population Census, and extends it by additionally describing developments in tourism, now ‘the mainstay’ of the local economy (Cork County Council, 2006a, b: 21). Most of the trends Commins identified appear to have largely continued.
3.1. Population
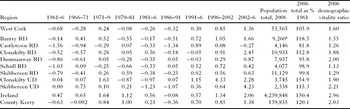
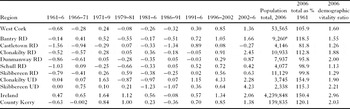
Boland's (Reference Boland1958) ‘black outlook’ of continued population decline turned out to be accurate, for depopulation in west Cork persisted during the 1960s and returned in the 1980s after a short-lived reversal during the 1970s (Table 2). Aggregate population reached a nadir of 47,608 in 1991. Strikingly, depopulation was subsequently quickly reversed. By 2002 population had exceeded its 1961 level, and the annual growth rate accelerated again in the 2002–6 intercensal sub-period. Observers such as Hopkin (Reference Hopkin2008) highlight net inmigration as the chief cause of population growth. Indeed, west Cork's fertility rate fell from an estimated 110 live births per thousand females aged fifteen to forty-four in 1961 to seventy-eight in 1991 and seventy in 2006.Footnote 11 This sustained population growth was unprecedented by west Cork's historical standards, and was not expected by Cork County Council planners who in the early 1990s were projecting more or less static numbers at best over the decade (West Cork Enterprise Board, 1994: 4–5). However west Cork's post-1991 growth rates were not as impressive as those in Ireland as a whole, and were no higher than in Kerry (Table 2). Moreover, despite the new net inmigration, concerns remain about the continued outmigration of young persons, especially those educated to third level (Cork County Council, 2006a, b: 17; West Cork Enterprise Board, 2007: 21). West Cork's demographic vitality ratio has improved over time, from 1.34 in 1961 to 1.45 in 1991 and 1.6 in 2006. Yet both comparator areas have at least two inhabitants aged twenty to thirty-nine for every one aged sixty-five or over; and the total number of children in west Cork aged five to fourteen years has continued to fall, from 9,150 and 8,595 in 1961 and 1991 respectively to 7,636 in 2006, hitting school enrolments.
Intercensal rates of population change, west Cork and comparator areas, 1961–2006 (percentage change per annum) and 2006 population totals.
Note: a Including 3,309 in Bantry town.
Sources: Central Statistics Office Census of Population; Small Area Population Statistics Microdata File © Government of Ireland.
The post-1991 population turnaround occurred to a greater or lesser extent in every rural and urban district. Table 2 shows that the improvement has been least pronounced in Castletown rural district, which even lost inhabitants in the latest intercensal sub-period and whose 2006 population is still nearly a fifth below that forty-five years previously. The populations of Dunmanway, Schull and Skibbereen rural districts have almost recovered to their 1961 levels, while in Bantry and Clonakilty rural districts those levels have been significantly surpassed. Generally, however, the best experience over the period covered by Table 2 was in the two urban districts, especially Clonakilty: they usually avoided depopulation before 1991 and subsequently experienced many of the highest annual growth rates.
3.2. Numbers at work and sectoral change
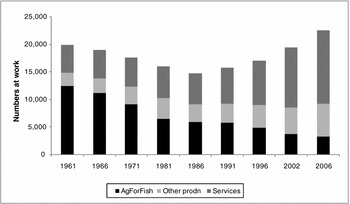
The fall and rise in west Cork's aggregate population is broadly mirrored in total numbers at work (Figure 2). One difference is that the revival in employment began during 1986–91, one intercensal sub-period earlier than population growth. This is in line with the experience nationally and reveals the true timing of the commencement of economic revitalisation, since employment typically reacts faster to economic stimuli than population. Total numbers at work surpassed their 1961 level in 2006, a little later than population. Yet the overall increase of 53.6 per cent during the expansion period 1986 to 2006 looks less impressive when compared to Ireland as a whole and Kerry (76.9 and 71.3 per cent rises respectively). Figure 2 also shows the significant, but familiar, structural change which has occurred in the west Cork economy, although the sectoral breakdowns, by principal employment, must be interpreted cautiously if only because of high local levels of pluriactivity.Footnote 12
Total numbers at work by sector, west Cork, 1961–2006.
Notes: Classification by principal status. Labels denote, respectively, agriculture, forestry and fishing; ‘other production’ (mining, quarrying and turf production; manufacturing; building and construction; electricity, gas and water supply); and services (the remainder). The 1979 census did not request this information, and in 1981 the data capture changed from persons aged fourteen years and over to fifteen and over following a rise in the school-leaving age.
Sources: As for Table 2, together with unpublished Central Statistics Office Small Area Population Statistics.

As is the near universal experience, numbers chiefly occupied in agriculture, forestry or fishing have declined very substantially. By 2006 they comprised just 14.6 per cent of total employment, although this was still nearly twice Kerry's 8.3 per cent. Changes in farming are discussed in subsection 3.3 below. The forested area has expanded over the years covered by Figure 2, the most significant concentration being sited on the hillsides and uplands of the region's northern and western parts. Even if many plantations have yet to reach maturity, forestry has generated notable employment, although this is enhanced greatly due to the presence of timber processing mills in the locality (Crowley et al., Reference Crowley, Ni Dhubhain and Moloney2001; West Cork Development Partnership, 2008: 53). The recent economic history of west Cork's fishing industry, meanwhile, is one of almost perpetual troubles, despite very significant modernisation of the fleet and some of the ports, especially at Castletownbere, now Ireland's largest whitefish port, and the much-progressed Union Hall. Industry complaints centre on the European Union's Common Fisheries Policy and the challenges associated with quota restrictions and the allegedly generous access of Spanish vessels to Irish offshore waters after Spain's accession in 1986. Other problems include structural imbalances and high fuel costs (Nolan, Reference Nolan2003; West Cork Development Partnership, 2008: 56–7). Aquaculture has, however, been a growth sector, most prominently from mussel farming in Bantry Bay from experimental beginnings in 1982 (Hegarty, Reference Hegarty1997: 180–1).
Numbers at work in ‘other production’, largely manufacturing and construction, increased until 1981. A very considerable, but predominately transitory, source of jobs was the Gulf Oil terminal on Whiddy Island, Bantry Bay. This opened in 1968 and was the sole introduction of heavy industry during the period under review, excluding new quarrying activity and attempts to reopen nineteenth-century copper and barytes mines. Building the storage facilities involved approaching a thousand workers for two years, with £30,000 per week estimated to have flowed into a booming Bantry. Once constructed, however, the economic benefits of the terminal and the visiting supertankers were disappointing. This was principally because far fewer employees were required to run the operation than to build it, although the direct employment of approximately 150 to 200 people in often high-wage jobs was still very significant (Somerville-Large, Reference Somerville-Large1972: 148, 153; Eipper, Reference Eipper1986: 53–7, chapter 8; Carroll, Reference Carroll2008: 170, 273–5). Another cause of increased employment in ‘other production’ in the 1960s and 1970s was the establishment of several light industries scattered across the region's towns, including a crabmeat processing facility in Schull, the Carbery cheese processing plant at Ballineen (a joint venture between the four west Cork agricultural co-operativesFootnote 13 and a British-based firm), a vegetable processing factory in Skibbereen and a handweaving factory in Clonakilty. By 1970 the last three together employed over 230 people (Somerville-Large, Reference Somerville-Large1972: 17, 89, 111; Eipper, Reference Eipper1986: 37, 47–53). These plants generated some local spin-off and sub-supply industries, such as vegetable growing and haulage. Yet, as Figure 2 shows, these valiant initiatives were insufficient to offset jobs lost in traditional agriculture and other natural resource based industries. During the 1980s the contribution of ‘other production’ stagnated; indeed, many of the factories closed, having lost markets to competitors or having manufactured products with a relatively short life-cycle (West Cork Enterprise Board, 1994: 26–8). The Whiddy oil terminal also ceased operations in 1979 after a tanker exploded, killing fifty-one people. It later reopened but on a much more limited scale.
Numbers working in ‘other production’ picked up from the 1990s onwards. One cause was the establishment of small and medium sized enterprises and micro-enterprises engaged in food processing. For instance, small-scale fish processing grew from the mid-1990s, particularly around Skibbereen, and the core of the companies that were established then remains. Food processors currently comprise about half of all local manufacturing firms (West Cork Enterprise Board, 2007: 21–2; O'Reilly and Cashman, Reference O'Reilly, Cashman, Dempsey and O'Reilly2008: 7). With now over 200 workers manufacturing premium cheeses (notably the Dubliner brand), food ingredients and flavours, including research and development activities, the very highly-regarded Carbery plant is one of west Cork's major employers (O Driscoll, Reference O Driscoll2010). Yet unsurprisingly the study area has continued to lack a large-scale industrial base. In 1991, for example, just nine manufacturing plants possessed a workforce in excess of fifty, including four dairy co-operatives, two timber processors and two multinational branch plants, and altogether they only employed about 1,000 people (Crowley, Reference Crowley2006: 187). Furthermore the incidence of manufacturing activity falls geographically from east to west (West Cork Enterprise Board, 1994: figure 5), although still providing much needed employment in the latter, and many employees receive little more than the national minimum wage. As elsewhere in Ireland, most local creamery branches have been closed or converted to trading outlets under a long-standing process of rationalisation. Nowadays west Cork's agricultural co-operatives are ‘strong’, diversified businesses, with combined employment of over 450 (West Cork Enterprise Board, 2007: 21; company profiles, Irish Farmers Journal Agriculture 2010 supplement, December 2009). Thanks largely to the success of Carbery, in the past two decades their suppliers have consistently received among the highest prices for manufacturing milk in the country (Irish Farmers Journal, 18th July 2009: 12–13).
Craft is perhaps the manufacturing sector that is the least unevenly distributed geographically. Growing on trend since around 1970 (Hopkin, Reference Hopkin2008: 200), currently there may be up to about 150 professional craft workers in west Cork. Most of these overwhelmingly one-person operations do not make a full-time living from sales. Yet if the craft sector's direct economic impact is relatively small, it makes an important wider contribution in terms of creative reputation and tourism appeal (McCutcheon, Reference McCutcheon, Dempsey and O'Reilly2008). Finally, as throughout Ireland, the booming construction industry was a crucial job-creating sector from the late 1990s. Taking advantage of national tax incentives, easy credit availability and burgeoning demand, large locally-based developers such as Fleming Construction and Murnane and O'Shea expanded greatly alongside many smaller builders. According to Population Census data, in 2006 14.2 per cent of west Cork workers described themselves as principally engaged in construction, up from 8.9 per cent in 1996 (and the same percentage in 1986). Well before the sudden national crash in construction from 2007, researchers were warning of potential over-reliance (e.g. Commins, Reference Commins2005). By the census measure, which ignores the importance of employment in other sectors dependent on construction through forward and backward linkages, west Cork was marginally more exposed to construction on the eve of its collapse than was Kerry (13.5 per cent of employment principally in construction in 2006).
Yet clearly the dominant increase in jobs in Figure 2 was in the catch-all residual category ‘services’, which employed practically three-fifths of those at work in 2006, up from a quarter in 1961. In addition to tourism (discussed in subsection 3.4), retail and professional services, information and communication technologies have been an important source of job creation. Small and medium sized enterprises engaged in information and communication technologies exist throughout the study area, but the industry's node is the West Cork Technology Park, just outside Clonakilty town, which opened at the turn of the millennium and houses, inter alia, a branch of the United States company Premiere Global Services. In 2007, employment in the Park exceeded 800 (West Cork LEADER Co-operative, 2007: 2). Unlike much of rural Ireland, then, the locality is playing a part in the national drive to expand internationally traded services. New employment in the public sector, meanwhile, was not prominent in the post-1986 expansion: numbers principally working in the census category ‘public administration’ did rise, but their weight remained negligible (3.2 per cent of total employment in 2006, marginally increased from 2.8 per cent twenty years earlier). Under the government's 2003 decentralisation programme, 131 civil service posts have been relocated to Clonakilty, with ninety-seven due to follow (as at April 2009, www.decentralisation.gov.ie). A crucial factor facilitating west Cork's impressive service sector growth was the near doubling of female labour force participation, following well-known sociocultural changes regarding the role of women, from 22.0 per cent in 1961 and 24.7 per cent in 1986 to 45.0 per cent in 2006.
3.3. Agriculture
Tracking post-1960 change in farming is hindered by data problems. In addition to altering categorisations, statistics from the last full Census of Agriculture, taken in 2000 (Central Statistics Office, 2002), are now outdated, and due to confidentiality restrictions are not fully available for every rural district (rural district level data from Central Statistics Office, personal communication). Even though the figures are not directly comparable, the familiar historical structural shift towards fewer, larger farms is evident. In the five rural districts west of Clonakilty the number of farms appears to have roughly halved between 1960 and 2000, from 7,314 ‘holdings’ of at least one acre (0.4 hectares; Attwood, Reference Attwood and Murphy1963: table 4) to 3,637 ‘farms’ of at least one hectare (or intensive operations). Meanwhile the percentage of those holdings/farms above approximately twenty hectares in size increased from thirty-six to fifty-eight per cent. Including Clonakilty rural district, there were 4,540 farms in all of west Cork in 2000, 1,111 fewer than in the 1991 Agricultural Census; with their mean size having risen from 25.3 to 32.2 hectares (the latter figure being almost identical to that nationally and in Kerry). Census data also show a leap forward in livestock production and labour-saving mechanisation. Between 1960 and 2000, cattle and sheep numbers increased by 71.1 and 173.6 per cent respectively, while tractor numbers rose by 378.6 per cent (Central Statistics Office, n.d.; idem, personal communication). West Cork has also experienced a substantial withdrawal from tillage: by 1991 this was just a quarter of its 1960 area. Pig-keeping too is no longer of broad significance.
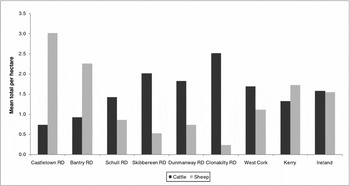
Commins (Reference Commins1999) concluded that, in line with the uneven, rocky terrain in the most westerly rural districts of Bantry and Castletown in particular, by the mid-1990s much local farming had receded to low-intensity sheep and cattle production and dependency on financial support from the European Union's Common Agricultural Policy (compare West Cork Enterprise Board, 1994: 20). During the 1980s dairy cows declined substantially in importance in most of west Cork, partly due to the imposition of milk production quotas in 1984. As occurred nationally, there was a concomitant boom in sheep numbers such that, by 1991, sheep comprised more than half of all livestock units in Castletown rural district and over one third in Bantry. Conversely farming in Clonakilty rural district was of far greater intensity, reflecting its superior land base: half the livestock units there in 1991 were dairy cows. Commins’ characterisation broadly holds for subsequent years. About three-quarters of west Cork farms were classified in the 2000 census as specialist beef or dairy enterprises; approximately one in ten were mixed grazing livestock operations and there were a few specialist sheep producers. What tillage remained in 2000 was very largely situated in Clonakilty rural district. Sheep farming remained concentrated in Bantry and Castletown; dairying in the three eastern rural districts; while beef production was spread more evenly. Hence moving west to east total cattle per hectare increased and total sheep per hectare fell (Figure 3). Indeed, there were slightly fewer cattle in Castletown rural district in 2000 than in 1960.Footnote 14
Livestock densities, west Cork and comparator areas, 2000.
Note: West Cork rural districts are arranged from west to east.
Sources: Central Statistics Office (2002; personal communication).

Since 2000 there has been a general continuation of the broad shift away from dairying, especially in the far west with uncommercially-small dairy farms being converted to drystock upon their occupier's retirement. Specialist intensive dairy farmers remain concentrated in the eastern rural districts. Up to date data on sheep numbers are available from the annual December Sheep Censuses but unfortunately these figures are not comparable with the full Agricultural Census due to differences in timing, since the latter (taken in June) includes the seasonal multitude of lambs which is not captured by the December count. Nevertheless it is probable that west Cork sheep numbers have declined quite seriously since 2000, in line with the national trend. The December 2007 census (Department of Agriculture, Fisheries and Food, 2008; idem, personal communication) shows that sheep production is still concentrated in Bantry and Castletown rural districts, which possessed mean flock sizes of over 100, about twice that in Clonakilty.Footnote 15
Another indicator of the persistent east/west intensive/extensive divide is the differential rates of adoption of the Rural Environment Protection Scheme. Participation in early versions of the scheme was both a cause and consequence of low-intensity agriculture: farmers choosing to join are paid to follow environmentally-friendly farming practices, yet participants were very likely to be those whose production systems were close to or already meeting the scheme's standards (O'Connell and Harte, Reference O'Connell and Harte2006). In 1997, the proportion of the aggregate agricultural area farmed under the Rural Environment Protection Scheme was far higher in west Cork's three western rural districts than its three eastern ones (Commins, Reference Commins1999: table 11). Electoral division level data on the percentage of farms in the scheme by 2003 (personal communication, Caroline Crowley and David Meredith) indicate a broadly analogous geographic pattern: at the extremes, all but one electoral division in Castletown rural district had at least twenty-eight per cent of farms participating, whereas the highest electoral division participation figure in Clonakilty rural district was 8.2 per cent. More recent statistics are unavailable (personal communication, Department of Agriculture, Fisheries and Food) but opinion locally is that the east/west gap was closing, albeit largely because the latest version of the Rural Environment Protection Scheme had attracted dairy farmers by accommodating the participation of more intensive enterprises. Overall a large range in farm-level efficiency and profitability persists in west Cork, even within each of the major production systems. But local and national evidence on the generally low-income nature of drystock agriculture (e.g. Breen et al., Reference Breen, Connolly and Donnellan2008) implies that many west Cork farmers, particularly in the west, remain financially dependent on the transfers they receive through the Rural Environment Protection Scheme and other Common Agricultural Policy schemes, such as compensation for farming in less favoured areas.Footnote 16 Facing financial pressure and, until late 2007, with good opportunities outside the farm gate, perhaps around half of the farm families turned to off-farm work, the quintessential example being a part-time drystock farmer working in construction. There has also been a little diversification into alternative on-farm enterprises, such as agri-tourism, to supplement family farm income (West Cork Development Partnership, 2008: 55).
Despite the general structural shift towards fewer, larger holdings, the number of local farms of under ten hectares actually increased from 462 to 834 during the 1990s. This reflects an influx of incomers establishing smallholdings. Some of the newcomers rejected the demands of modern society to become near-self-sufficient farmers. Others along the continuum between small-scale lifestyle and larger commercial farming produce what Sage (Reference Sage2003) calls ‘alternative good food’, that is, high quality artisan food which is embedded in its locality, for instance due to the use of local raw materials, and is marketed as such: for example, Dexter cattle reared by the Traditional Meat Company. Such ‘good foods’ are often sold via new or reinvigorated short supply chains, such as direct sales to consumers in farmers’ markets or to stallholders in Cork city's English Market (Ó Drisceoil and Ó Drisceoil, Reference Ó Drisceoil and Ó Drisceoil2005). One of the pioneers was Milleens Cheese in 1976, one of several farmhouse cheese-makers setting up locally around that time (Hopkin, Reference Hopkin2008: 35–6). This ‘subterranean food chain’Footnote 17 has since grown endogenously, exploiting the early growing season, and now boasts a high economic profile (O'Reilly, Reference O'Reilly, Dempsey and O'Reilly2008). As with the craft workers, even if many artisan food producers cannot afford more than a frugal lifestyle, they add considerably to the area's creative reputation and tourism attraction. Yet on the eve of the recession it was felt that the number of start-ups had peaked due to the burden of new food safety regulations (West Cork Enterprise Board, 2007: 21).
3.4. Tourism
Recreation and tourism, meanwhile, have become ever more economically integral to west Cork as the region has followed a common transition towards a countryside and coastline characterised more by consumption than production. Cycling along the coast in 1970, Somerville-Large (Reference Somerville-Large1972) observed an ongoing ‘tourist boom’ which had commenced the previous decade, with new holiday bungalows and pleasure boats in places such as Rosscarbery. This was one of the few signs of economic optimism he witnessed, another being the recently arrived factories, alongside the innumerable deserted houses outside the visitor hotspots. An almost contemporary estimate was that tourism accounted for about twelve per cent of the labour force and at least eleven per cent of income in Bantry (Eipper, Reference Eipper1986: 209). Tourists, chiefly domestic, British and European, including holidaying emigrant families and day-trippers from Cork city, continue to be attracted by west Cork's scenery, natural heritage, colourful villages and off-the-beaten-track local character celebrated by Enright (Reference Enright2004). Numerous, largely outdoor family activities are now available, from waymarked walks to a model railway village, and the area continues to win tourism awards. Recreational sailing and fishing have particularly developed: thus the population of Baltimore village swells four-fold in summertime (Cork County Council, 2006b: 62–4; also West Cork Development Partnership, 2008: 62–5).
O'Reilly and Cashman's (Reference O'Reilly, Cashman, Dempsey and O'Reilly2008) impression was that visitor numbers have ‘grown constantly during the last two decades’ (p. 7), but they noted the absence of geographically disaggregated data. One proxy indicator, covering a longer period, is provided by records of visitors to Bantry House and gardens, located adjacent to Bantry town. This was nearly the only attraction in the 1960s charging an entrance fee. Visitors averaged 1,966 per annum over 1960–1, rising to 8,398 in 1970–1 and 14,953 during 1976–7. By 2008 the figure was around 30,000.Footnote 18 Despite this impressive fifty-year expansion, west Cork's high season remains more or less confined to July and August, as in the 1960s: unlike cities, remote areas receive limited off-peak long weekend business. Moreover visitor numbers, spend and amenities are largely concentrated on the coast, reflected in the location of the new hotels.Footnote 19 Even so, fishermen, for example, in far west Castletown rural district face especial challenges diversifying into marine tourism due to their particularly peripheral location which receives less tourist traffic. In 2009 the tourist information offices in Glengarriff received a mean of approximately 3,000 visits per month during their seasonal opening, compared to almost 5,000 at Bantry on the opposite side of the bay (personal communication, Fáilte Ireland).
Alongside rising visitor numbers from the late 1980s or so was the increasingly burgeoning construction of purpose-built holiday lets and one-off second homes, some owned by media personalities and the extremely wealthy (Hopkin, Reference Hopkin2008). Cork County Council (2006a: 17) estimated that on the scenic peninsulas over a third of houses are holiday homes. In an amplification of past conflicts between development and landscape (see Somerville-Large, Reference Somerville-Large1972), such was the scale and positioning of building before its abrupt halt from 2007 that observers felt that parts of the area were losing their character (e.g. Sheehan, Reference Sheehan2007: 204–7). Despite earlier concerns about tourism earnings not being converted into employment (West Cork Enterprise Board, 1994), Crowley (Reference Crowley2006: 190–1) reports that about 1,200 full-time equivalent jobs depend on the industry, some in remote places where little other employment exists. But she expresses concerns about the low-skill, low-pay and seasonal nature of many of these jobs. Even in Clonakilty town, nearly half of the eighty-eight staff at a hotel and leisure centre are seasonal.Footnote 20 However such work does suit some, such as students free from classes over the summer.
Ireland's government views tourism and artisan food as potential ‘new pillars’ of the national rural economy (Ó Cuív, Reference Ó Cuív2007b). If the micro-enterprises and small and medium sized enterprises who replied to the survey distributed by O'Reilly et al. (Reference O'Reilly, Moloney and O'Connor2007) are representative, then interestingly the take-off of west Cork's ‘good food’ sector apparently pre-dated that of its tourism industry by about a decade, at least as measured by the number of new small and medium sized enterprises. Nearly half of the food enterprises in their sample had been established during 1985 to 1994, approximately twice the fraction for the tourism firms. In contrast, well over half of the tourism enterprises were not established until sometime during 1995 to 2005 (calculations from ibid., figure 2).Footnote 21
3.5. Overall position, c.2006
Since the turn of the 1990s, then, west Cork has transcended its somewhat melancholy economic history and generated greater employment and affluence in a much more diverse, self-confident economy.Footnote 22 Kelly and Teljeur's (Reference Kelly and Teljeur2007) material deprivation index provides a useful measure for benchmarking modern west Cork's relative position of prosperity nationally, since domestic and agricultural property rates have now been abolished and data on income and gross value-added remain unavailable at the sub-county level (Central Statistics Office, 2010). Their index is derived from 2006 Population Census statistics on the prevalence of unemployment, low social classes, rented accommodation and car ownership. The results of such exercises ought to be treated cautiously, especially for rural areas where a car is virtually essential and underemployment still exists in agriculture. Moreover pockets of deprivation can exist even in affluent regions, and vice-versa. Caveats aside, none of the ninety-four west Cork electoral divisions was ranked in the lowest decile of Irish electoral divisions which were the most materially deprived. Just ten were placed in the eighth and ninth deciles nationally, although 26.3 per cent of the region's population lived in those ten electoral divisions, which interestingly included both urban districts. Conversely thirty-two of the ninety-four electoral divisions were ranked in the top two deciles as being among the least materially deprived in the country; 27.5 per cent of the population lived in these electoral divisons,Footnote 23 half of which were located in Clonakilty rural district and most of the remainder in Dunmanway and Skibbereen rural districts. Also in line with expectations, all electoral divisions in Castletown rural district were ranked in the bottom half of electoral divisions nationally. The results using 2002 census data were very similar, as more or less are those reported by the West Cork Development Partnership (2008: 45–6, 134). Castletown rural district's relatively poor showing confirms that, despite the remarkable changes since 1960, there has also been much continuity. As O'Reilly and Cashman (Reference O'Reilly, Cashman, Dempsey and O'Reilly2008) and others argue, economic disadvantage in west Cork remains correlated with topography and access. While all parts have gained in absolute terms over time, in general it is still the islands (Kruger, Reference Kruger1994), peninsulas and mountainous areas where the greatest challenges lie by way of job creation and diversification away from traditional natural resource based industries.
If Castletown rural district has maintained its ranking as the most disadvantaged of the region's six rural districts, Dunmanway's position looks to have generally weakened in recent years (RPS Planning and Environment, 2007). West Cork's only landlocked rural district particularly prospered in the 1970s on account of inward investment, including two multinational medical equipment companies, and a newly affluent hinterland as farmers benefited from high Common Agricultural Policy support prices after Ireland joined the European Union in 1973. But no replacement industries were forthcoming when manufacturing firms exited, the biggest loss being 113 jobs when Swedish-owned Molnlycke relocated to Thailand in 2000. Instead, Dunmanway has been adversely affected by activity along the coastline. The coast road was designated as the region's only national road, and is therefore the focus for tourist traffic and amenities; meanwhile businesses are now attracted to Clonakilty's Technology Park. Strategic plans are in place to assist places such as Dunmanway and Castletown. The overall strategy for the study area is to concentrate investment and development in the towns and other major settlements to achieve critical mass there so that they can act as stronger employment and service nodes for their rural hinterlands (Cork County Council, 2006a, b).
4. Explaining revitalisation
Fundamental to the reversal of long term economic decline in west Cork has been the region's ability to capitalise on some well-known national and global socioeconomic changes which are overwhelmingly exogenous to the locality. These include rising household affluence, counter-urbanisation, consumer concerns about modern food production methods, reductions in transportation costs and advances in information and communication technologies. For reasons of manageability, illustration of this contention is confined to consideration of three factors.
4.1. Macroeconomic growth and rural-urban commuting
The remarkable general ‘long boom’ of the Irish macroeconomy between 1987 and 2007 (Whelan, Reference Whelan2010) is often noted as being crucial to west Cork's revitalisation. Following Commins (Reference Commins1999), the timing of the declines and increases in aggregate population and numbers at work in the study area since the 1960s more or less coincide with macroeconomic growth trends (see also e.g. West Cork Enterprise Board, 2007: 22). The most obvious causal link is that the impressive improvements in household disposable income and wealth brought about by the ‘Celtic tiger’ increased demand for local goods and services, stimulating among other things a ‘surge’ in the number of small, medium sized and micro-enterprises in the good food and tourism sectors (e.g. O'Reilly et al., Reference O'Reilly, Moloney and O'Connor2007: 8) and the construction of second homes for city dwellers.
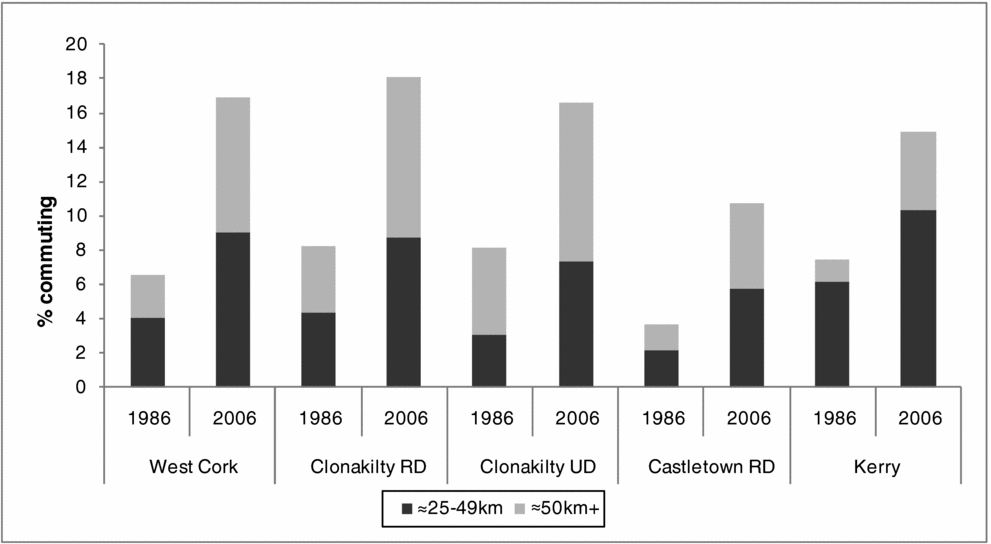
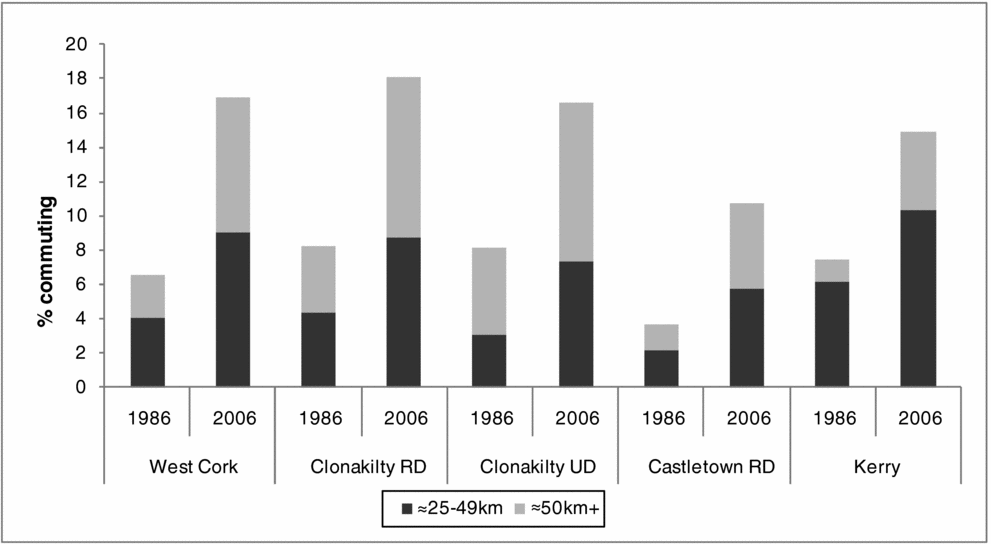
With Irish macroeconomic growth being largely urban-based, national overviews such as Cuddy (Reference Cuddy, Phelan, Bogue and Mulhall2005) highlight the role of urban centres in providing full- and part-time jobs for commuting rural residents. Cork city, located east of the study area and the second largest city in the country, thrived in the long expansion years. Declining traditional textile and heavy industries were replaced by clusters of modern sectors, including pharmaceuticals, medical equipment, information and communication technologies and electronics. Many of the new companies were multinationals attracted by, among other things, government grant aid and Ireland's low rate of corporation tax (Romsa, Reference Romsa2003). Given near universal car ownership in modern times, those living in the extreme east of the study region were best placed geographically to take advantage of the opportunities in Cork and its satellite towns: Clonakilty urban district is on the western edge of the city's commuter belt, approximately fifty-three kilometres away by road. Yet construction firms based as far west as Bantry daily bussed dozens of workers to building sites in the city. Indeed some city workers became west Cork commuters having moved out of the city for lifestyle reasons or to avail themselves of lower property prices. Figure 4 shows that there was a near trebling over the expansion years in the percentage of west Cork residents usually travelling at least twenty-five kilometres to reach their place of work or study, with a particular rise in those journeying over fifty kilometres. Long-distance commuting in 2006 was not surprisingly more prevalent in Clonakilty rural district than in far west Castletown. Indeed even Clonakilty urban district possessed its fair share of serious commuters. Tellingly, in west Cork overall there was proportionately more travel of at least fifty kilometres compared to Kerry. The role of commuting in local regeneration should not be overemphasised: on aggregate in 2006, more than twice as many journeyed between zero and four kilometres to work or study as travelled over twenty-five kilometres (39.5 versus 16.9 per cent). However, for what the comparison is worth, the increase in commuters travelling twenty-five kilometres or more of 3,438 additional people between 1986 and 2006 is sizeable relative to the rise in total numbers at work over the same period (7,879 persons, from Figure 2 above).
Percentage of workers, schoolchildren and students usually commuting long distances, selected source areas, 1986 and 2006.
Note: The two years are not perfectly comparable due to the switch to metric measurement and because the 2006 figures specifically exclude those aged under five years.
Sources: As for Table 2.
4.2. Inward migration, information and communication technologies and entrepreneurship
Crowley (Reference Crowley2006: chapter 7) highlighted two other reasons for revival. First, the new net inmigration of the 1990s and 2000s helped to stimulate local enterprise. The incomers comprise a cosmopolitan mix of ‘blow-ins’ and ‘blow-backs’. Of the 4,207 persons usually resident in west Cork on census night 2006 who had been living at a different address twelve months previously, nearly a third originated from outside Ireland (of the usually-resident population stock in 2006, 82.7 per cent had been born in Ireland and 10.6 per cent in the United Kingdom). Most moved for lifestyle reasons, following the modern phenomenon of counter-urbanisation. Some have family ties or a counter-cultural, occasionally deep green, outlook, but increasingly incomers have been seeking an improved quality of life in a rural idyll (Ní Laoire, Reference Ní Laoire2007; Hopkin, Reference Hopkin2008: chapter 8). Historically viewed as disadvantaged on account of its location and natural endowments being unfavourable for agriculture and industry, modern west Cork has capitalised on being perceived as favoured with regard to natural heritage and lack of intensive development. These attributes, alongside efforts to promote creative reputation and townscape renewal (e.g. Clonakilty Urban District Council, 1998), have given the locality a competitive advantage in attracting migrants (and tourists) in a world of greatly enhanced labour mobility. It is widely seen as a place which welcomes blow-ins embracing non-conventional lifestyles, such as artists and writers, who enhance the community vibe and diversity in what is now a culturally vibrant part of rural Ireland.
With local employment in large companies scarce, Crowley argues that many incomers had to generate their own livelihoods by establishing a variety of small, medium sized and micro-enterprises, including translation services and management consultancies (reflected in Gudgin et al., Reference Gudgin, Scott, Hanvey, Hart and Bradley1995: figure 6.6). Some make products that embody their owner's sociocultural values, such as ceramics or undertaking organic leaning farming. Crucially modern advances in information and communication technologies have allowed businesspersons to set up or relocate what are now footloose firms in remote locations, often working from home using the internet. Large city-based companies can outsource back office operations to sites where wages and rents are cheaper: hence the biggest employer at the West Cork Technology Park, SWS Group, handles back office work for Dublin-based firms. West Cork now contains a critical mass of small and medium sized enterprises trading electronically, a medium which suits the niche markets in which many operate (West Cork Enterprise Board, 2003). Modern information and communication technologies have thus been important in helping the locality to lessen the disadvantages of its peripheral location. Of course the prerequisite infrastructure had to be in place. Broadband availability, now a virtual sine qua non, has recently improved and is excellent in some centres, but deficiencies in access, capacity and reliability remain in too many ‘black spot’ areas. Since a similar situation also applies to the mobile phone and electricity infrastructures, there was disquiet about a digital divide reinforcing existing geographical patterns of relative deprivation (West Cork Development Partnership, 2008: 40–2), at least before the renewed plans to address this state of affairs. Another attribute attracting small and medium sized enterprises to west Cork is the reasonable proximity of parts of the area to freight and passenger services at Cork city's port and airport and, in the extreme west, to the more limited services at Kerry airport. And as an underlying factor, increased demand for services in modern Ireland, including the growth of tourism locally, facilitates small businesses since typically the point of service delivery needs to be geographically dispersed (Gudgin et al., Reference Gudgin, Scott, Hanvey, Hart and Bradley1995).
The incomers’ impact as entrepreneurs appears to have been especially important in light of concerns expressed about indigenous entrepreneurship, despite the locals’ reputation for resourcefulness. McDonagh and Commins (Reference McDonagh and Commins1999: 359–60) argue: ‘Seemingly, in areas of historically high out-migration the pool of human resources for venturesome business development is comparatively limited in the residual population’, since young, highly-skilled enterprising individuals tend to have a relatively high propensity to leave depressed regions. For example, prominent Bantry businessmen in the 1960s and 1970s were said to prefer earning a safe return on capital to hazarding job-creating investments (Eipper, Reference Eipper1986: chapter 3; although the evidence from emigrant profiles is mixed: Jackson, Reference Jackson1967; MacLaughlin, Reference MacLaughlin1991). The post-1990s incomers, then, have probably helped to fill an entrepreneurial gap created by decades of outmigration. West Cork's good food and craft sectors are noted as examples where incomers have made a major contribution, especially non-Irish nationals (e.g. Sage, Reference Sage2003: 51; Crowley, Reference Crowley2006: 184, 191–2). Finally the incomers have, of course, brought new demand for goods and services. Crowley (Reference Crowley2006: 180) claimed the locality was ‘at the epicentre of the current property boom’, and the sizeable demand-pull land and house price inflation in those years must have stimulated spending by west Cork property-owners due to wealth effects.
4.3. Policy intervention: enterprise supports
The other factor Crowley highlighted was policy interventions. Her discussion focused on the LEADER programmes, a European Union initiative that endeavours to animate rural development through a ‘bottom-up’ area-based approach. The local action group, West Cork LEADER Co-operativeFootnote 24 was established in 1991, and its remit encompasses the study area together with lands to the east and north. The West Cork LEADER Co-operative supports a variety of activities, from training and community projects to grant aiding small-scale investments, spending almost €4.7 million during 2001–6 alone (West Cork LEADER Co-operative, 2007). Its cornerstone initiative has been the Fuchsia brand, Ireland's first regional brand. Since 1998, the brand has aimed to commercially exploit west Cork's natural image and strong identity, and to enhance networking, synergies and innovation among small businesses providing high quality goods or services (Dempsey and O'Reilly, Reference Dempsey and O'Reilly2008). Tourism and artisan food products, and from 2005 craft products, are marketed under the Fuchsia flower logo. Enterprises wishing to join the brand network must meet eligibility criteria, such as implementing quality control systems and sourcing inputs locally. The number of food and tourism members, numerically dominated by micro-enterprises, has risen from twenty-seven at the launch to 108 in 2002 and 178 in 2006, with limited turnover in membership (O'Reilly et al., Reference O'Reilly, Moloney and O'Connor2007). In 2008 there were thirty-two craft members (McCutcheon, Reference McCutcheon, Dempsey and O'Reilly2008).
Although predated by formal and informal groupings, the Fuchsia network has re-energised and enhanced intra- and especially intersectoral synergies, as well as helping to develop start-up companies. Three complementary sectors now possess an organised framework for co-operation and a critical mass for joint marketing. The network, alongside efforts by non-affiliates (including Clonakilty Food Company, makers of Clonakilty Blackpudding), has helped the study area to become perceived as part of Ireland's foremost good food region. Locally-based entrepreneurs, then, have capitalised on the recent international trend for higher income consumers to react against the globalisation and homogenisation of the mainstream food industry and instead demand high quality food produced in an environmentally sustainable manner, the purchase of which supports local communities, not multinational corporations. Increased disposable incomes; heightened concerns over food safety, the environment and animal welfare; and the influence of foreign travel and food writers/broadcasters are identified as factors generating this new demand pattern (Sage, Reference Sage2003). West Cork's artisan producers have been championed by food writers and celebrity chefs, and the territory possesses a first mover advantage in that it was part of the first Irish region to create a strong ‘culinary community’: this reputation has persisted (McKenna, Reference McKenna2007). One of the synergies between food and tourism which has emerged is that many visit the locality because of its food culture. All the efforts to promote west Cork as a tourist destination, meanwhile, have been greatly assisted by the inexpensive air and ferry travel of modern times, which has also reduced the disadvantages of geographic peripherality. This is reflected in the successful local community campaign to reinstate the ferry service between Cork city and Swansea, Wales, which had ceased in 2006 after thirty-seven years. The ferry's termination was said to have markedly affected west Cork businesses, in particular by reducing the number of overseas visitors touring in their own car (West Cork Development Partnership, 2008: 65; www.bringbacktheswanseacorkferry.com).
O'Reilly et al. (Reference O'Reilly, Moloney and O'Connor2007) calculated that the total value of output related directly to the Fuchsia brand was €106.97 million in 2005. Of that, 64.6 per cent remained in the West Cork LEADER Co-operative region (recall this is broader than the study area), and through forward and backward linkages with other local enterprises generated an overall €88.79 million, supporting 1,131 full-time equivalent jobs. The estimated multipliers are quite large because network members generally utilise local inputs, such as guesthouses serving local food. What magnitude of activity would have occurred in the absence of the West Cork LEADER Co-operative is unclear. Certainly participating businesses report benefits (e.g. O'Reilly, Reference O'Reilly, Dempsey and O'Reilly2008) and West Cork LEADER has estimated employment created directly from all its activities as eighty-nine full-time and seventy part-time jobs during 1994–9 (Crowley, Reference Crowley2006: 190) and 319 full-time equivalent jobs in 2001–6, with another 149 full-time equivalent positions maintained, plus approximately 2,000 training participants (West Cork LEADER Co-operative, 2007: 30). Academics sometimes treat such figures with skepticism due to concerns regarding displacement of existing firms’ business and especially deadweight, supported projects which would have proceeded anyway, however hard agencies endeavour to avoid these. Indeed locally-based professional organisations can reach individuals who might not have engaged with centralised programmes. Conversely, such calculations ignore important intangibles such as the contribution to developing an enterprise culture and community-building. What can be argued with certainty is that the West Cork LEADER Co-operative did not help to trigger the upturn in numbers at work, which commenced in 1986–91 before the organisation's creation. However it has made a notable contribution to sustaining employment growth post-1991, reflected in the acclaim and imitation that the Fuchsia brand has attracted (the latest evaluation is Messely et al., Reference Messely, Dessein and Lauwers2010). Yet clearly the scale of such interventions is not sufficient by itself to have reversed long term decline (Ó Cuív, Reference Ó Cuív2007a).
The West Cork LEADER Co-operative works alongside many other enterprise support organisations, from long-standing national sectoral agencies such as Bord Iascaigh Mhara (Sea Fisheries Board) to the voluntary community groups which nowadays exist for virtually every town and district. The following discussion is confined to a brief overview of three of the most important, beginning with the West Cork Enterprise Board. Established in 1993, the Enterprise Board is broadly analogous to West Cork LEADER in that it is another area-based agency providing financial and other assistance to small businesses, of ten employees or fewer, that owes much of its existence to the availability of European Union co-funding and a renewed emphasis on the desirability of locally-delivered, multi-sector enterprise support. During 1993–2006, the West Cork Enterprise Board granted over €6 million to 457 projects, mostly based in the study region although it also has a wider catchment area, especially in food/fish processing, engineering and services. Some of its clients are now successful overseas exporters, including Irish Yoghurts (West Cork Enterprise Board, 2003; idem, 2007). As at November 2007, assisted enterprises employed 1,034 persons full- or part-time, with perhaps another 260 or so jobs generated indirectly if the employment multiplier of 1.25 from O'Reilly et al. (Reference O'Reilly, Moloney and O'Connor2007) is applied (there is some double-counting across individual agency totals as some clients migrate between agencies). As a crude comparison, the total is equivalent to sixteen per cent of the increase in aggregate numbers at work in the study area from 1986 to 2006, and approaches six per cent of total employment in 2006. The West Cork Enterprise Board also provides ‘soft support’ training, information and mentoring which previously were not available locally, amounting to 353 events with 4,255 participants between 1994 and 2007. The impact of this valuable activity in creating jobs and enhancing business skills cannot be easily quantified. Overall, as with the West Cork LEADER Co-operative, the Enterprise Board has made a notable contribution to sustaining, but not triggering, employment growth.
Another pair of support agencies is the national level IDA (Industrial Development Agency) Ireland and Enterprise Ireland. The former provides assistance (including grants) backed by the low rate of corporation tax and Ireland's other attributes, to attract foreign direct investment; the latter supports indigenous business with a focus on companies in food, manufacturing or internationally traded services with ten or more employees. In 2001, fifty-nine enterprises based in Bantry, Clonakilty or Skibbereen towns were agency-supported. Together they directly employed 1,415 workers, overwhelmingly permanent full-time. Again applying an employment multiplier of 1.25, these jobs perhaps indirectly generated around 350 additional positions, the total being equivalent to about nine per cent of the number working in west Cork at the time. This appears to be a reasonably sizeable contribution, although importantly as above this calculation begs the counterfactual. Furthermore only seven of the fifty-nine enterprises, employing a total of just 184 people, were foreign owned. These were largely American and German, including the long-established Rowa Pharmaceuticals.Footnote 25
This ‘comparatively modest’ level of IDA supported foreign direct investment, while still extremely welcome (West Cork Development Partnership, 2008: 58–61), partly reflects national policy shifts after 1982 to target more foreign investment in strategic industries and spatial concentrations. Such a strategy is aligned with thinking on the importance of urban agglomerations and clustering in generating economic activity, including in their hinterlands (e.g. Boyle et al., Reference Boyle, McCarthy and Walsh1998/9; though compare Doran et al., Reference Doran, Jordan and O'Leary2009; McDonagh et al., Reference McDonagh, Varley and Shortall2009). It might not have produced the same sort of direct benefits for west Cork compared to the 1960s and 1970s when IDA plans included dispersing foreign direct investment across 177 towns and cities (Meyler and Strobl, Reference Meyler and Strobl2000; O'Leary, Reference O'Leary2003: 490), when most towns in the study area received something. However, as also noted above, foreign direct investment clusters in Cork city have at the very least directly generated numerous job opportunities for those prepared to commute. But even if a policy of foreign investment clustering, within reason, does produce spatially wide ranging benefits in the medium to long term in, for example, creating high value-added activity and local spin-offs, the short run transition can be painful for those areas outside a cluster node. Thus there was anger in Dunmanway when the town's last major manufacturer announced its relocation to nearby Macroom to expand its operations, apparently encouraged by the IDA (Southern Star, 29th November 2008: 1). Locals perceive such events as part of the long-standing neglect of west Cork by central government (e.g. ibid., 23rd June 2007: editorial). Political pressure can secure investment that, rightly or wrongly, circumvents spatial strategy priorities, but historically west Cork has struggled to achieve this, probably primarily due to its relative paucity of marginal seats (see e.g. Eipper, Reference Eipper1986: 79–81).
Of course area-based enterprise support organisations existed before the 1990s. To take two examples, many of the initiatives of the West Cork County Development Team in the late 1960s and early 1970s, and the Society of Cork Potters after its creation in 1980, are strikingly reminiscent of modern activities. Past actions ranged from holding craft workshops and exhibitions (Rose, Reference Rose1985) to liaising with potential domestic/foreign investors and local stakeholders, overseas promotion and the availability of grant aid for investments. New hotels and mussel farming were among the matters mooted by the West Cork County Development Team in the late 1960s alongside their focus on attracting manufacturing plants.Footnote 26 The team were important in pump priming the first cohort of farmhouse cheese-makers in the late 1970s and early 1980s. Nonetheless overall the region's post-1990 enterprise support system must be judged an enhancement on that operating in the past. Nowadays there is more localised decision making, whereas the West Cork County Development Team had to send recommendations for grant aid to Dublin for approval. Additionally knowledge regarding successful interventions must have been accumulated over time via learning by doing. Yet in seeking to explain why current agencies have been able to contribute to achieving sustained employment growth, whereas in the past broadly similar organisations could not, it is hard to ignore wider factors such as greater financial resources, especially with European Union co-financing, advances in information and communication technologies and a long macroeconomic boom.Footnote 27
5. Present day decline and long term change
West Cork's economy deteriorated sharply in 2007–9 on the back of the global recession triggered by the international banking crisis and exacerbated in Ireland by, inter alia, the collapse of the national property bubble and deflationary pressures to restore competitiveness and the public finances (O'Donoghue, Reference O'Donoghue and Kinsella2010; Whelan, Reference Whelan2010). Although much of the evidence herein is little more than anecdotal,Footnote 28 recession is obvious in the newly-vacated retail units in the town centres. Of the study area's major industries, construction is almost certainly the worst affected given the property market slump: the large Fleming group is in severe financial trouble (Irish Times, 2009: passim). Locally general opinion is that tourism has been increasingly ‘quiet’, suggesting that reductions in overseas tourist numbers and spend have not been offset by increased domestic visitors substituting holidaying at home for holidaying abroad. Meanwhile the market for good food has apparently slowed but not stopped. All of the West Cork Development Partnership's food producer clients were still operating in mid 2009; one farmhouse cheese-maker had not lost customers but their purchasing was more restrained. In mainstream agriculture, beef and sheep farming generally remain under financial pressure, while profitability in dairying has collapsed, after an exceptional 2007, upon the reversal of the milk price boom (Kinsella, Reference Kinsella2010). The Carbery Group declared a loss after tax of €0.55 million for 2008 compared with a €7.6 million profit the previous year, partly due to propping up prices paid to their milk suppliers (Irish Farmers Journal, 9th May 2009: 17). Low producer prices were also largely responsible for talk of ‘crisis’ in the local fishing industry. Yet positive thinking and initiative persists, besides applications to the West Cork Development Partnership and the West Cork Enterprise Board for start-up support from entrepreneurs of necessity. The enduring belief that central government will not seriously help to address local problems is one of the factors stimulating private sector entrepreneurship, best displayed in the community effort to restore the Cork-Swansea ferry.
Figure 5 summarises the overall situation: after drifting upwards for several months, from September 2008 there has been a steep acceleration in numbers signing on the live register at the social welfare offices in the region. Ireland's live register is not designed to measure unemployment because it includes part-time and seasonal workers entitled to welfare benefits, but nevertheless it is widely used as an indicator. Yet because of its design, and especially because registration offices do not serve defined geographical boundaries, it would be too cavalier to compare the numbers with the local populations at risk. Still, the increases depicted in Figure 5 would seem to imply that former relatively high-wage construction workers have not found replacement jobs, and the graph certainly shows the persistent east/west divide within west Cork, in that the index increases are noticeably higher in the Bantry and Skibbereen offices compared to Clonakilty. Moreover the west Cork rises exceed those experienced nationally and in Kerry, which at face value suggests that the study area has been hit relatively hard by the recession. Also noteworthy is the changing gender composition of increases in the live register count. During the seven months after October 2008, when the series was marginally revised, males accounted for 70.8 per cent of the total increase across the west Cork offices; over the next seven months (May to December 2009) the gender split was far closer to 50:50. These statistics are consistent with a situation whereby much unemployment occurred initially in male-dominated industries such as construction, and subsequently spread to other sectors where female workers are more prevalent.
Index of monthly numbers on the live register, west Cork social welfare offices and comparator areas, October 2007 to December 2009.
Notes: Figures from October 2008 are a revised series which (correctly) exclude certain categories of individuals, removing a small number. October 2007 is the start point because Dunmanway's office closed then, which more or less affected numbers accessing the remaining local offices.
Source: Central Statistics Office database direct, www.cso.ie.

Naturally only future economic historians can properly place the latest state of affairs into the long term structural change narrative which has been the focus of this article. The previous sections demonstrated the general revitalisation of west Cork's economy since the turn of the 1990s, with most of the historical developments – notably the diminished importance of agriculture, net inmigration and, with the growth of tourism, the transition to a countryside and coastal economy based more on consumption than production – being familiar from the experiences of numerous rural areas in Ireland and the rest of the world. Clearly at the very least the current downturn has highlighted the fragility of much of the economic progress achieved locally, in particular the unsustainable expansion of the construction sector; as well as exacerbating greatly the challenges already facing the region, such as improving infrastructure, enhancing penetration of the Fuchsia brand and further developing knowledge based industries that retain/attract young, skilled workers, given increasing international competition for back office work from developing economies.
Unfortunately the data do not easily allow a precise delineation of the causes of the study area's regeneration, or the extent to which per capita income in west Cork has converged with other parts of Ireland over the fifty years discussed herein. It is not clear, therefore, whether the forces leading to regional convergence are, on balance, stronger or weaker than those producing divergence. However it has been shown that on many of the measures which are available, such as post-1986 employment growth, west Cork's experience was not quite as impressive as that nationally or in neighbouring county Kerry; that historical intra-regional differences in economic vitality have not been overturned; and that, among other things, macroeconomic growth and associated buoyant consumer demand, rural-urban commuting opportunities, information and communication technologies, recently arrived entrepreneurs and innovative local enterprise supports have contributed to regional revitalisation. Of these factors, the present day downturn has demonstrated that, for all its modern economic spirit and local initiatives to increase regional competitiveness and value-added, the fortunes of the study area, and perhaps by extension other rural economies located on the peripheries, are still linked to those of the national economy.
Acknowledgments
Liam Downey, Michael Hanley, Fr. Patrick Hickey, Cormac Ó Gráda, Jacqueline O'Reilly and an anonymous referee generously commented on earlier drafts. For additional assistance, the author thanks Tommy Collins, the late Patrick Commins, Rosemary Fennell, Eugene Hayes, Terri Kearney, Ivan McCutcheon, Gerald O'Brien, Pauline O'Driscoll, Seamus O'Reilly, Brendan Riordan, Huan Tan and audiences at five conference/seminar presentations. Jonathan Brown, Máire Caffrey, Dave Caldwell, Brendan Curtin, Stephen Duffy, Eddie McDonald, Fiona O'Callaghan, Cathal O'Donoghue, Barbara O'Keeffe, Patrick Sills, Colm Solan and others kindly provided data or particular points. The usual disclaimer applies.