I. INTRODUCTION
The trends toward higher data-throughput, higher power, and better efficiency indicate the demand for more broadband and more flexible transmit/receive (T/R) modules. Therefore, frequency-agility and reconfigurability become more important to fulfill relevant system specifications and to adapt to changing requirements during the lifetime of a system. In many devices and – in particular – space–borne systems, components cannot be changed once deployed. Therefore, adjustments during lifetime can only be done, if they have already been foreseen and prepared during the design and assembly phase.
To be able to change a power amplifier's frequency of operation, the transistor needs to be matched at the new operating frequency. The performance of fixed broadband matching networks is restricted in a trade-off between bandwidth and matching. This is described by the well-known Bode–Fano criterion [Reference Fano1], which [Reference Steer2] simplifies to
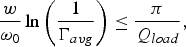 $$\displaystyle{w \over {\omega _0 }}\ln \left({\displaystyle{1 \over {\Gamma _{avg} }}} \right)\leq \displaystyle{\pi \over {Q_{load} }}\comma$$
with Γavg being the average absolute in-band reflection coefficient over the fractional bandwidth w/ω 0 of the matching network. Q load = X/R describes the quality factor of the load to be matched.
Steer [Reference Steer2] concludes, that a higher Q load results in a narrower bandwidth for a constant Γavg, which significantly affects the performance in multi-band applications. To overcome this limitation, one can implement tunable narrowband-matching networks, which have the potential for very good performance at different operational frequencies. These tunable narrowband multi-mode-matching networks (M3Ns) provide optimum matching conditions for different frequency-bands and modes of operation. However, for maximum performance of the amplifier, very low-loss tuning-devices are needed. Radio-frequency-microelectromechanical-systems (RF-MEMS) are well suited for this application.
In [Reference Malmqvist3], variable matching networks are presented for gallium arsenide (GaAs)- and silicon germanium (SiGe)-low-noise amplifiers (LNAs) based on capacitively loaded lines. Malmqvist et al. [Reference Malmqvist4] demonstrate capacitive and inductive loading elements to match a GaAs-LNA. Qiao et al. [Reference Qiao, Molfino, Lardizabal, Pillans, Asbeck and Jerinic5] present the results of a power amplifier matched by a double-stub tuner with a varactor and RF-MEMS as tuning elements. Also Lu et al. [Reference Lu, Peroulis, Mohammadi and Katehi6] show RF-MEMS-based double-stub networks for amplifiers.
The authors of [Reference Liu, Schreurs, De Raedt, Vanaverbeke and Mertens7, Reference Mahmoud Mohamed, Boumaiza and Mansour8] present reconfigurable multi-frequency gallium nitride (GaN) power amplifers (PAs) based on commercially available components. Both publications use RF-MEMS-switches as tuning devices, due to their “high linearity and low insertion loss […]” [Reference Mahmoud Mohamed, Boumaiza and Mansour8] and their high bias voltage “typically far beyond the power amplifier voltage swing” [Reference Liu, Schreurs, De Raedt, Vanaverbeke and Mertens7]. Liu et al. [Reference Liu, Schreurs, De Raedt, Vanaverbeke and Mertens7] show a class-AB single-transistor PA with a broadband output-matching network and a 1-bit reconfigurable input stage optimized for efficiency. The tri-band PA is designed for 1.4, 2.5 and 3.6 GHz. In [Reference Mahmoud Mohamed, Boumaiza and Mansour8], a more complex Doherty design was chosen to realize a high efficiency PA for 1.9, 2.14 and 2.6 GHz.
This work targets GaN-based class-A single-transistor high-power-amplifier applications with adjustable operational modes. Such applications can feature specifications in terms of tuning range, matching, efficiency, output power, and other figures of merit, which cannot be realized with a single amplifier module. Therefore, several amplifier modules are realized in parallel and switching-banks or multiplexers become necessary. This results in additional losses, more complex circuit design and larger overall footprints. These applications can profit from the use of M3Ns, enabling multi-mode amplifier modules. Commercially available resistive RF-MEMS-single pole single throw (SPST) switches (RadantMEMS RMSW200HP [9]) are used to build tunable single-stub matching networks for a 6 W GaN transistor. A comparison with state-of-the-art tunable matching networks is given in Section IV.
II. DESIGN OF FREQUENCY-AGILE-MATCHING NETWORKS
A) Single-stub topology
The tunable single-stub topology of this work is illustrated in Fig. 1, showing four different stubs. These can be connected to the through line by RF-MEMS-switches, thus realizing a classic single stub. This design was chosen, because it is easy to implement, straight forward to design, and suitable to match theoretically any not purely complex impedance.
Photograph of a RF-MEMS-based single stub matching network. Different colors and linetypes indicate different matching states chosen by actuating the respective switch. The microstrip line running from left to right is referred to as “through line”.

The biasing of the transistor is applied on the through line of the matching network. Since the RF-MEMS-SPSTs have an ohmic contact, the stub lines have to be realized open-ended. For line impedances equal to the system impedance Z 0 and open-ended stubs the distance d between stub and transistor and the stub length l can be calculated as
 $$d=\displaystyle{\lambda \over {4\pi }}\left({\angle \Gamma _{{\rm load}} \pm {\rm arccos}\left({ - \left\vert {\Gamma _{{\rm load}} } \right\vert } \right)} \right)\comma$$
 $$l=\displaystyle{\lambda \over {2\pi }}{\rm arccot}\left({\displaystyle{1 \over 2}\tan\left({\displaystyle{{4\pi } \over \lambda }d - \angle \Gamma _{{\rm load}} } \right)} \right).$$
The results can be reduced modulo λ/2 to obtain positive, minimum length values [10, chapter 12].
The equations give two possible solutions. However, in a matching network with several stubs, a compromise between the possible geometrical positions of all stubs has to be found. Based on the geometry of the RF-MEMS switches in-use, the minimum dimensions of stub length l and distance d are limited. In fact, the minimum distance between two stubs is restricted by the width of a single switch. Additionally, stubs cannot be realized shorter than the switch length. In order to overcome these limitations, integrated RF-MEMS circuits can be used [Reference Figur, van Raay, Quay, Vietzorreck and Ziegler11]. Additionally, the overall chip size can be reduced by using radial stubs instead of line stubs [Reference Figur, van Raay, Quay, Vietzorreck and Ziegler12].
B) Impedance matching points of GaN transistor
The M3Ns are designed for a GaN transistor from Fraunhofer Institute of Applied Solid-State Physics (IAF) in Freiburg, Germany. The AlGaN/GaN HEMT on semi-insulating SiC used has a gate length of 0.25 µm and operates at a bias of V DS = 28V. The harmonic balance simulations are performed within Agilents Advanced Design System with a verified large-signal model in CW-operation at the respective frequencies for a quiescent current of 100 mA/mm and an input power level leading to a compression level of P-2 dB. The maximum current of the transistor is 1200 mA/mm and the breakdown voltage exceeds 100 V. The HEMT is connected in microstrip transmission line technology with a substrate thickness of 100 µm. The reference planes are chosen to match the actual connection pad to the switches.
Figure 2 depicts the source and load impedances, which have to be presented to the transistor for delivering either maximum output-power or maximum power-added-efficiency (PAE) in class-A operation, being biased with V DS = 28 V and I D = 120 mA. The corresponding matching points for maximum-output-power-mode (blue triangles, Fig. 2(a)) are closer to the real-impedance axis of the Smith chart and thus have lower Q load = X/R. Consequently, the matching-network states for maximum-output-power-mode are expected to be more broadband than for maximum-PAE-mode.
Large signal matching points of the chosen gallium nitride transistor. Data for 3.5–8.5 GHz, normalized to 50 Ω. Filled symbols indicate data point at 3.5 GHz.
For the input-matching network, the impedances for both modes differ only slightly (brown diamonds and red sandclocks, Fig. 2(a)). Therefore, it is assumed that no distinction is necessary and both modes can share one state of the matching network. However, the high Q load for the input matching results in a low achievable fractional bandwidth and return loss.
C) Matching networks designed
In a first step two dedicated drain matching networks have been designed for maximum-output-power- and maximum-PAE-mode, respectively. Owing to the lower quality factor of the matching points for maximum-output-power-mode, less states were chosen to cover the frequency range from 3.5 to 8.5 GHz, than are necessary for maximum-PAE-mode. The designed states are summarized in Table 1.
Matching networks designed.
E, maximum-power-added-efficiency-mode.
P, maximum-output-power-mode.
In a second design step, matching networks for both operation modes have been joined to a single so-called M3N. These matching networks have been designed for gate and drain according to Table 1. As introduced before, for the gate-matching network the same states are used for both modes. Additionally, only three states were realized since a higher number of states results in larger structures and thus higher losses. Increased losses limit the area of the Smith chart that can be matched to 50 Ω, further decreasing the expected performance.
III. MEASUREMENTS AND CHARACTERIZATION
A) Evaluation of measurement results
Since the measurement results of the stand-alone-matching networks can only be well judged in combination with the transistor, the measurements are recalculated to account for the integration of the transistor. The data are simulated with the transistor impedances as a port element and a series inductor to represent the bond wire between transistor and matching network as depicted in Fig. 3.
Evaluation of measurement results.
The following results are obtained by this method. In Figs 5, 6 and 8–11, solid lines denote the recalculated measurements. For comparison the simulation results are shown as dashed lines. The individual states of the matching networks are identified by the use of different colors and symbols.
B) Output-matching networks for dedicated operation modes
The measured circuits for the dedicated output-matching networks for maximum-PAE- and maximum-output-power-mode are depicted in Fig. 4. Ground-signal-ground-probes (GSG-probes) were used for the measurements, de-embedding the first 5.6 mm of microstrip line as part of the measurement set-up. The RF-MEMS-switches are integrated into cavities, realized in Rogers RT/Duroid 5880 Printed Circuit Board (PCB), to minimize bond wire length.
Photographs of the measured circuits of the output matching networks for dedicated operation modes. Left port: transistor side, right port: 50 Ω system. Reference planes 5.6 mm inwards from beginning/end of lines.
The evaluated measurement results for the maximum-PAE-mode matching network are shown in Fig. 5. The six different matching states are clearly visible and match well with the simulation results. Return losses of >10 dB with insertion losses from 1–1.5 dB are achieved over almost the whole frequency range. Consequently, the transistor can be tuned to any frequency between 3.5 and 8.5 GHz. Around the single-design frequencies return losses are optimized and values of 15 dB and higher are measured.
Measurement results of the output matching network for maximum-PAE-mode. Port 1: transistor, port 2: 50 Ω system. Dashed: simulation, solid: measurement. Dashed horizontal bar: optimization target.
Figure 6 gives the results for the output-matching network for maximum-output-power-mode. The measurement results confirm that the matching network for maximum-output-power is more broadband than the one for maximum-PAE-mode. Here, a return loss of higher than 10 dB can be realized with insertion losses of 0.5 dB and less by four different states. In the comparison, simulation results and measurements match well. As seen before, return losses are considerably higher at the design frequencies; values between approximately 25 and over 30 dB have been measured, indicating excellent matching conditions.
Measurement results of the output matching network for maximum-output-power-mode. Port 1: transistor, port 2: 50 Ω system. Dashed: simulation, solid: measurement. Dashed horizontal bar: optimization target.
C) Multi-mode-matching network
1) ASSEMBLED STRUCTURES
The assembled M3N are depicted in Fig. 7. The integration concept for the RF-MEMS switches is the same as described in Section III-B for the dedicated matching networks. For the ease-of-use RF connectors replaced the GSG-probe, and a multi-layer stack-up was chosen to route the control signals on a dedicated layer.
Top view of assembled M3N. Left structure: output matching network, right structure: input matching network. Left port of structures: transistor side, right port: 50 Ω system. “GATE” is accidentally placed on the wrong side of the structure. Reference planes 8 mm inwards from center of RF connectors.
The individual switches in the output-matching network are arranged in four different groups. The two leftmost clusters of switches illustrate the restriction of possible stub positions along the through line. Here, the single chips are touching, preventing a closer positioning of the stubs. The fifth stub from the left is realized as short as possible, limited by the switch's dimensions.
2) GATE-MATCHING NETWORK
The input M3N features three different states, matching the preceding 50 Ω-system to the transistor for different operational modes and frequencies. The return losses depicted in Fig. 8 are close to the simulated values of 7–17 dB. The maximum return loss for the second state in maximum-output-power-mode could not be evaluated, due to the resolution of 2 samples/GHz of the available transistor data. However, the shape resembles the simulation results, but indicates a frequency shift.
Measurement results of input M3N– matching. Port 1: transistor, port 2: 50 Ω system. Dashed: simulation, solid: measurement. Dashed horizontal bar: optimization target.
The insertion losses of the different states are given in Fig. 9. The three designed states are visible, showing quite narrowband performances, as expected by evaluating equation (1). Insertion losses of approximately 2–3 dB are rather high as compared to the ones of the formerly shown output matching networks in Section III-B.
Measurement results of input M3N – insertion loss. Port 1: transistor, port 2: 50 Ω system. Dashed: simulation, solid: measurement. Dashed horizontal bar: optimization target.
3) DRAIN-MATCHING NETWORK
The separate matching networks for maximum-PAE- and output-power-mode shown in Section III-B were combined into a single M3N. This allows us to change the operation mode of the amplifier while keeping the operation frequency fixed with a single transistor. The load quality factors Q load of the impedances to match on the drain side – blue triangles and magenta squares in Fig. 2 – are lower than for the gate-matching network: therefore the results in Fig. 10 show a more broadband behavior with higher return losses than the gate-matching network.
Measurement results of output M3N – matching. Port 1: transistor, port 2: 50 Ω system. Dashed: simulation, solid: measurement. Dashed horizontal bar: optimization target.
In PAE-mode, state 6 is designed to match the transistor at 8.5 GHz, but also works well at 4.5 GHz. In consequence, the frequency range from 3.5 to 6 GHz can be matched quite well with return losses of 10 dB. Insertion losses in Fig. 11 are 0.9–1.5 dB in the same frequency range.
Measurement results of output M3N – insertion loss. Port 1: transistor, port 2: 50 Ω system. Dashed: simulation, solid: measurement. Dashed horizontal bar: optimization target.
Maximum-output-power-mode exhibits again a more broadband behavior than the one for maximum PAE. Almost the complete plotted frequency range can be matched with 10 dB or better by only three states. Insertion losses up to 6 GHz are lower than 1.3 dB, being most of the time between 0.7–1 dB.
While the single states overlap as such that the transistor can be well matched in the complete frequency range with 10 dB of return loss, at the single-design frequencies return losses are highest. Approximately 10–23 dB of return losses can be achieved depending on the chosen state, frequency, and mode of operation.
4) RF-POWER MEASUREMENTS
The results shown before have been obtained with a vector network analyzer (VNA) at low input RF power; however, the networks are designed for power-amplifier applications. To verify the performance at higher-power operation, the M3Ns were characterized in a power measurement set-up. For the measurements, the devices under test (DUTs) from Fig. 7 were inserted into a 50 Ω-reference system. Therefore, the results shown in Figs 13 and 14 represent the performance of the M3Ns in this 50 Ω environment. The aim of this measurement was to show, whether the small-signal and the large-signal behavior of the DUTs are identical or not.
The measurement is based on purely scalar measurements of incident, reflected, and transmitted power levels as depicted in Fig. 12 – no output reflection or phase information is available. Therefore, calibration is restricted and multiple reflections within the set-up cannot be mathematically removed.
Block diagram of power measurement set-up. P in: power sensor for incident power, P refl: power sensor for reflected power, P out: power sensor for transmitted power. Source: [Reference Krammer13].
The results for the input and output M3Ns are given in Figs 13 and 14 – each state of the respective networks is represented by an individual diagram. Currently being limited by the measurement set-up, the power sweep was carried out from ≈8 to ≈34 dBm at the DUT in steps of 2 dB. The single measurements with different RF-input-powers are drawn with solid lines of different colors. The mean values of each power measurement is in excellent agreement with the reference measurements of the VNA (solid lines marked with symbols), showing no power dependency under cold-switching conditions. In case of need for hot-switching capabilities, capacitive RF-MEMS [Reference Ziegler, Gautier, Stehle, Schoenlinner and Prechtel14] can be used.
Power measurements of input M3N. Measurement done in 50 Ω system. Power from 8–34 dBm in steps of 2 dB. Low-power reference measurements with vector network analyzer marked with symbols. Port 1: transistor, port 2: 50 Ω system.
Power measurements of output M3N. Measurement done in 50 Ω-system. Power from 8–34 dBm in steps of 2 dB. Low-power reference measurements with vector network analyzer marked with symbols. Port 1: transistor, port 2: 50 Ω system.
The finite isolation and return loss of the couplers in-use, and the sensitivity of the power detectors limit the overall sensitivity of the measurement set-up. For low-input reflections of the DUT, the reflected power can be in the same order of magnitude as the – theoretically isolated – incident power at the measurement point for the reflected power.
Therefore, interference phenomena determine the measured absolute power value, causing a frequency-dependent deviation from the mean value on all measurements.
The power level of the transmitted signals can be very low for isolating DUTs. In cases of low absolute power levels, the transmitted signal cannot be distinguished from the noise floor, restricting the measurement accuracy. Consequently low reflections and high insertion losses with low power are difficult to be measured.
These accuracy restrictions are visible in the graphs Fig. 13(c), Figs 14(c) and 14 (g) show deviations for different power levels in regions of high insertion losses. As consequence of the limited sensitivity, the power sensors measure mainly noise. However, with increasing input power the graphs approach the reference measurements.
IV. COMPARISON WITH STATE-OF-THE-ART
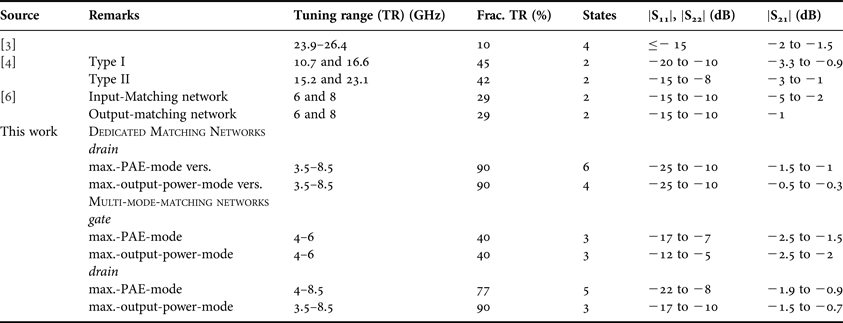
Table 2 gives a summary of this work in the context of other published results. A direct comparison with other works is not straight forward, since different frequency-bands and transistors to be matched demand for different matching conditions.
Comparison with state-of-the-art.
The performance in terms of insertion and return losses of the output-matching networks are comparable to the data given in [Reference Malmqvist3, Reference Malmqvist4, Reference Lu, Peroulis, Mohammadi and Katehi6]. However, the output-matching networks presented in this work exhibit a fractional tuning range of 77 to 90%, which is considerably higher than the 45% in [Reference Malmqvist4].
The output-matching networks allow to match the transistor from approximately 3.5 to 8.5 GHz. With the higher number of states in this work, a more uniform matching over the wider fractional tuning range can be achieved than it is possible with only two different states. The single-matching states overlap such, that the transistor can be used at almost any intermediate frequency with a good matching, instead of only individual narrow frequency bands. Nevertheless, matching is best at the targeted design frequencies.
V. CONCLUSIONS
This paper demonstrates tunable single-stub input and output-matching networks for a 6 W GaN transistor. Different designs were presented: for maximum-output-power-mode of the power amplifier, for maximum-PAE-mode and finally multi-mode-matching networks, joining both previous networks into one. The M3Ns allow to tune the transistor's mode of operation independently from its operational frequency within a single matching network. This results in a reduction of parallel amplifiers and/or matching networks needed to realize a multi-band- and multi-mode-amplification. A single transistor can be used and no multi-throw-switches (e.g. SP4T), and routing of signals are necessary within the amplifier module. Characterizations within a power measurement set-up have shown no RF-input-power dependency up to 34 dBm when cold-switched. As a next step, the matching networks will be integrated with the transistor to characterize the multi-mode amplifier.
ACKNOWLEDGEMENTS
This work was financially supported by FP7 – Space, Project Saturne, Grant agreement no. 242 458. Special thanks are dedicated to Stefan Krammer for his bachelor's thesis work [Reference Krammer13] on the automated power measurement set-up.
 Sascha A. Figur received his Dipl.-Ing. (FH) degree in Electrical Engineering (2007) and his M.Sc. degree in Information Technology (2009) from Fachhochschule Münster Abteilung Steinfurt, Germany. Currently he is working on his Dr.-Ing. at EADS Innovation Works, Ottobrunn, Germany, where his research interests are on adaptive and frequency-agile subsystems for e-scan antennas.
Friedbert van Raay received the M.Sc. degree in Electrical Engineering from the Technical University of Aachen, Aachen, Germany, in 1984, and the Ph.D. degree from the University of Kassel, Kassel, Germany, in 1990. From 1992 to 1995, he was with SICAN GmbH, Hannover, Germany, where he was involved with RF system development and measurement techniques. In 1995, he returned to the University of Kassel, as a Senior Engineer, where he supervised the Microwave Group, Institute of High Frequency Engineering. In November 2001, he joined the Fraunhofer Institute of Applied Solid-State Physics (IAF), Freiburg, Germany, as a Supervisor of the Device Modeling Group. His current research interests are development and characterization of high-speed digital and high-power millimeter-wave GaAs and GaN devices and circuits.
Rüdiger Quay received the Diplom degree in Physics from Rheinisch-Westfälische Technische Hochschule (RWTH), Aachen, Germany, in 1997, and a second Diplom in Economics in 2003. He received his Doctoral degree in Technical Sciences (with honors) from the Technische Universität Wien, Vienna, Austria in 2001, and in 2009 he received the venia legendi (habilitation) in microelectronics, again from the Technische Universität Wien. He is currently the leader of RF-devices and circuit characterization group, and deputy head of the business field Gallium RF-power electronics with the Fraunhofer Institute of Applied Solid-State Physics Freiburg, Germany. He has authored and coauthored over 150 refereed publications and two monographs. Dr. Quay is co-chairman of MTT-6, Microwave and Millimeter Wave Integrated Circuits and an associate editor of the international journal of microwave and wireless technologies.
Larissa Vietzorreck was born in Düsseldorf, Germany. She received her Master's degree in Electrical Engineering (Dipl.-Ing.) from the Ruhr-Universität Bochum, Germany, in 1992. From 1992 to 1997, she was a Research Assistant in the Department of Electrical Engineering of the Fern Universität in Hagen where she got her doctoral degree (Dr.-Ing.). In 1998, she joined the Lehrstuhl für Hochfrequenztechnik at the Technische Universität München, Germany, as an Assistant Professor. In 1999, she was conference secretary of the European Microwave Conference in Munich and 2012 scientific chair of the national URSI Kleinheubacher Tagung. She acts as reviewer for several journals and conferences and has published more than 100 contributions in journals and conference proceedings. Her current research interests are design and simulation of microstructured components and development of numerical software tools.
Volker Ziegler received his Dipl.-Ing. degree in Electrical Engineering and his Dr.-Ing. degree (with honors) both from the University of Ulm, Germany, in 1997 and 2001, respectively. From 2002 to 2003, he was member of the “Knowledge Exchange Group for Research and Technology” at the DaimlerChrysler AG in Stuttgart, Germany. During this trainee period, he was working at the University of Michigan, Ann Arbor, USA and at United Monolithic Semiconductors, Orsay, France. Afterwards, he joined EADS Innovation Works, Ottobrunn, Germany, where he became an EADS Expert for “Microwave Technologies and Systems” in 2007. Currently, he is the Head of Team “RF and Waveforms” responsible for the research performed in the field of key microwave technologies and waveforms for advanced radar and communication systems. Volker Ziegler is member of the IEEE MTT-S Technical Coordinating Committee 21 on RF-MEMS and member of the IEEE MTT Antennas & Propagation German Chapter Executive Board. He served twice as Associated Editor for the “International Journal of Microwave and Wireless Technologies” and authored or co-authored more than 70 papers and holds nine patents.