

The global food supply chain generates approximately 13.7 billion metric tons of carbon dioxide equivalent annually, contributing about 26% of anthropogenic greenhouse gas (GHG) emissions. Primary production is the major source of these emissions, accounting for 61% of food-related GHG outputs (Poore and Nemecek, Reference Poore and Nemecek2018). Within agriculture, cattle systems are prominent contributors, emitting an estimated 5,335 metric tons of carbon dioxide equivalent per year and representing about 11% of all human-induced GHG emissions (Smith et al., Reference Smith, Bustamante, Ahammad, Clark, Dong, Elsiddig, Haberl, Harper, House and Jafari2014).
Dairy cattle contribute substantially to these emissions, particularly through enteric methane (CH4), a potent GHG produced during ruminal fermentation (Bell et al., Reference Bell, Garnsworthy, Stott and Pryce2015; van Engelen et al., Reference van Engelen, Bovenhuis, van der Tol and Visker2018; Fresco et al., Reference Fresco, Boichard, Fritz, Lefebvre, Barbey, Gaborit and Martin2023). As consumer and policy attention increasingly focuses on climate impacts of livestock production, the dairy sector faces growing pressure to adopt mitigation strategies that reduce CH₄ emissions while maintaining productivity.
Genetic selection has emerged as a promising long-term avenue for CH₄ mitigation. Breeding programmes are increasingly exploring opportunities to select animals that emit less CH₄ and CO₂ while improving feed efficiency and nitrogen utilisation. Genetic improvement provides cumulative and permanent gains across generations, in contrast to management-based strategies, which require continual implementation (Richardson et al., Reference Richardson, Crowley and Amer2023; Uemoto et al., Reference Uemoto, Tomaru, Masuda, Uchisawa, Hashiba, Nishikawa, Suzuki, Kojima, Suzuki and Terada2024). Incorporating CH₄-related traits into breeding goals therefore represents a significant opportunity to enhance environmental sustainability in dairy production (Richardson et al., Reference Richardson, Baes, Amer, Quinton, Hely, Osborne, Pryce, Hailemariam and Miglior2021b).
Several countries are incorporating GHG emission traits into their national cattle selection indexes. Canada added methane parameters to its Holstein breeding programme, giving Methane Efficiency a 37% weight within its Lifetime Performance Index (Lactanet, Reference Lactanet2025; Richardson et al., Reference Richardson, Amer, Post, Oliveria, Grant, Crowley, Quinton, Miglior, Fleming, Baes and Malchiodi2025). Spain integrated residual methane concentration (MeC) into its index using a genomic SS-TPLGBLUP model to select for lower emissions (CONAFE, 2025). In May 2025, the Nordic Cattle Genetic Evaluation launched its first standalone methane index for Holstein sires, utilising data from automated milking sensors (Voergaard et al., Reference Voergaard, Vahlsten and Markey2025). The Netherlands utilises large-scale sniffer systems for direct CH₄ phenotyping, with simulations showing that proper economic weighting could cut CH₄ intensity by 24% by 2050 (de Haas et al., Reference de Haas, Veerkamp, de Jong and Aldridge2021; van Breukelen et al., Reference van Breukelen, Aldridge, Veerkamp and de Haas2022). Recent advances have further capitalised on this unique data resource to elucidate genetic distinctions arising from divergent definitions of methane-related phenotypes. Manzanilla-Pech et al. (Reference Manzanilla-Pech, van Breukelen, Veerkamp, de Haas, van Pelt and Gredler-Grandl2026) analysed sniffer-derived CH₄ measurements from nearly 7,600 Holstein dairy cows in the Netherlands, systematically evaluating 11 distinct CH₄ phenotypes and delivering pivotal insights for refining genetic evaluation protocols. Conversely, other nations pursue indirect strategies. Ireland releases genetic evaluations for AI sires based on commercial progeny (ICBF, 2023; Ryan et al., Reference Ryan, Pabiou, Purfield, Berry, Conroy, Murphy and Evans2024) but primarily limits CH₄ through its Economic Breeding Index, which improves overall efficiency and includes a carbon sub-index (ICBF, 2023; Lahart et al., Reference Lahart, Buckley, Herron, Fitzgerald, Fitzpatrick, Galvin and Shalloo2024). Alongside these indirect system-level approaches, studies focusing on specific residual traits show that selecting directly for residual CH₄ can reduce emissions by ∼15% without sacrificing productivity (Starsmore et al., Reference Starsmore, Lahart, Villalobos-lopez, Egan, Herron, Burke and Shalloo2024). Finally, Australia’s Green Cow project is developing a Methane Efficiency Breeding Value combining microbiome, milk spectroscopy and sniffer data. Currently achieving a model reliability of 0.24, it targets national integration by 2030 (Vander Jagt et al., Reference Vander Jagt, Almasi, Sepulveda, Marett, Williams, Xiang, Bolormaa, Shaffer, Penry and Hill2025).
While the long-term goal is to establish a comprehensive genetic framework for integrating methane emission traits into dairy cattle breeding indices, the primary objective of this systematic review is to synthesise available evidence focused on biological trade-offs and implementation considerations. To achieve this, the paper aims to:
1. Analyse genetic parameters (such as heritability and genetic correlations) for various methane-related traits, including methane production (MeP), methane yield (MeY), methane intensity (MeI), MeC and residual methane.
2. Examine the relationships between methane traits and economically important factors such as milk production, feed efficiency and fertility to understand potential favourable or antagonistic responses to selection.
3. Evaluate the potential integration of methane traits into breeding programmes to support global efforts in reducing GHG emissions.
Materials and methods
Search strategy and data sources
This systematic review was conducted in accordance with the Preferred Reporting Items for Systematic Reviews and Meta-Analyses (PRISMA) statement (Moher et al., Reference Moher, Shamseer, Clarke, Ghersi, Liberati, Petticrew, Shekelle and Stewart2015). A comprehensive search of peer-reviewed scientific literature regarding CH4 emission traits in dairy cattle genetics and breeding was performed.
Two primary electronic databases, Web of Science (Core Collection) and PubMed, were queried. The search utilised a combination of Boolean operators and MeSH terms (where applicable) to identify studies relating to: (1) Population: dairy cattle (Bos taurus); (2) Parameters: genetic parameters, breeding values or selection indices; (3) Outcome: methane emissions or carbon footprints.
The finalised search string was:
((“genetic factor*” OR “genetic parameter*” OR “genetic index”) AND (environment* OR “carbon dioxide” OR methane OR “emission reduction” OR “carbon neutral”) AND (“dairy cattle*” or “dairy cow*”)).
The initial search was conducted on 2 October 2024, and a final update was performed on 29 January 2025, with no restrictions on the date of publication. To ensure literature saturation, backward and forward citation chaining was performed using Litmaps (Litmaps Ltd., Wellington, New Zealand), identifying additional key papers not captured by the initial database queries.
Inclusion and exclusion criteria
Studies were eligible for inclusion if they met the following criteria: (1) Study type: primary peer-reviewed research (experimental or observational) reporting genetic parameters (heritability, genetic correlations) or breeding strategies for CH4 traits; (2) Species: Holstein, Jersey or other recognised dairy breeds; (3) Language: published in English; (4) Accessibility: full text available online or through the University College Dublin library.
Exclusion criteria included: (1) studies focused solely on beef cattle, buffalo or small ruminants; (2) non-primary research (reviews, letters, editorials or conference abstracts); and (3) studies focusing exclusively on nutritional or management interventions without a genetic component.
Study selection and data extraction
Search results were imported to EndNote 21 (Clarivate Analytics, Philadelphia, PA) to identify and eliminate duplicate entries. Screening was conducted in two stages:
(1) Title and abstract screening: Irrelevant studies (e.g., non-genetic studies or meat science) were removed.
(2) Full-text review: Articles were assessed against the pre-defined inclusion criteria.
Screening was primarily conducted by a single reviewer (Z.Y.), with ambiguous articles discussed with a co-author (M.W.). The screening process and flow of information are documented in the PRISMA flow diagram (Fig. 1). For the retained literature, data were extracted regarding animal population (breed and size), measurement platform (e.g., GreenFeed, Respiration Chamber, Sniffer) and specific CH4 phenotypes (MeP, MeY, MeI or residual methane).
PRISMA flow diagram for systematic review screening.

Figure 1 Long description
Records identified from: Web of Science (n equals 695 plus 1) PubMed (n equals 199) Arrow to a side box: Records removed before screening: Duplicate records removed (n equals 168) Arrow down to: Records screened Web of Science (n equals 695 plus 1) PubMed (n equals 31) Arrow to a side box: Records excluded Web of Science (n equals 68) PubMed (n equals 4) Arrow down to: Reports assessed for eligibility Web of Science (n equals 628) PubMed (n equals 27) Arrow to a side box: Reports excluded: Web of Science (n equals 592) PubMed (n equals 21) effects of environment on dairy cow lactation performance, milk flow, milk composition, mastitis, body condition, hoof health, heat stress, reproductive traits, group production, epidemic diseases, feed intake, growth, life span, energy balance, protein balance, environmental adaptation, calf sucking, ruminant feed efficiency phenotype, rumen microorganisms etc. Arrow down to: Studies included in review Web of Science (n equals 36) PubMed (n equals 6) Litmaps (n equals 6) Arrow down to: A total of 50 papers were analyzed (including 2 papers added during the revision process).
Data quality
During the study screening process, several data quality criteria were applied. Eligible studies were required to employ either observational or controlled experimental designs and to provide sufficient detail on the period of data collection and the frequency of animal measurements. Studies also needed to clearly report model specifications and the analytical software used. Additional quality indicators included explicit acknowledgement of limitations related to genetic parameter estimation, as well as any validation or cross-validation procedures performed.
Synthesis and analysis
To manage the high volume of technical data, Google’s NotebookLM (Google Inc., Mountain View, CA) was utilised as a supplementary tool for initial text categorisation and thematic clustering. However, all thematic synthesis, critical evaluation of methodological quality and interpretation of genetic parameters were performed by the authors to ensure subject-matter accuracy. Traits were synthesised into four primary categories: absolute production, ratio-based traits, residual traits and predicted proxies (e.g., milk mid-infrared [MIR]). A forest plot was constructed using the ggplot2 package in R (version 4.5.1) to visualise heritability estimates for methane traits (Wickham, Reference Wickham2016; R Core Team, 2025). A weighted mean heritability, with weights based on sample size and 95% confidence intervals, was calculated and displayed on the plot to summarise the findings.
Results and discussion
Search results
The most recent search in January 2025 generated a total of 894 studies, 42 of which met our inclusion criteria for GHG emission-related parameters in dairy cattle breeding. Through Litmaps citation analysis, six additional relevant studies were obtained. During the revision process, two relevant papers were added. In this review, a total of 50 papers were critically appraised to assess the CH₄ emission traits in dairy cattle genetics and breeding.
These data collectively examine CH4 emissions from dairy cows, focusing on the genetic factors influencing CH4 production, its heritability across different lactation stages and parities and its genetic correlation with economically important traits such as milk production and feed efficiency. Additionally, strategies for reducing CH4 emissions through genetic selection are explored, including the identification of indicator traits and the integration of environmental considerations into breeding goals to enhance the sustainability of dairy farming. The study also evaluates the impact of diet, management practices and different dairy cow production systems on CH4 emissions and the overall environmental footprint. In Fig. 2, we summarise the principal themes from the selected literature, and these are elaborated and assessed in the following sections.
Conceptual overview of themes in the literature.

Figure 2 Long description
The flowchart outlines a strategy for reducing greenhouse gas emissions through genetic selection, focusing on methane emission traits. It begins with the overarching goal of climate change and dairy sustainability, aiming to reduce emissions. The chart is divided into three main categories of methane emission traits: Primary Traits, Ratio Traits and Standardised Traits. Primary Traits include Methane Production (MeP) and Methane Concentration (MeC). Ratio Traits consist of Methane Yield (MeY), Methane Intensity (MeI) and Methane to Carbon Dioxide Ratio (CH4/CO2). Standardised Traits cover Residual Methane (Rmet, RMP) and Genetic Standardized Methane (GSMet). These traits lead to a synthesis section, which connects to three areas: Genetic relationships, Breeding Programs and Future Directions. Genetic relationships focus on trait selection, objectives and correlations. Breeding Programs address trade-offs, measurement and implementation. Future Directions explore multi-trait models, economic weights and scalability.
Measurement methods and devices
Accurate quantification of CH4 emissions in dairy populations requires balancing measurement precision with the large-scale throughput necessary for genomic evaluation. To navigate this, it is essential to understand that methane measurement systems are characterised by two distinct components: the underlying sensor technology and the deployment platform.
The sensor technology – including non-dispersive infrared (NDIR) spectroscopy, Fourier-transform infrared (FTIR) spectroscopy and photoacoustic spectroscopy – heavily influences equipment precision, signal drift and maintenance requirements. Meanwhile, the deployment platform dictates the throughput, accuracy and the specific type of metric obtained (e.g., concentration vs. absolute mass flux).
Direct determination via respiration chambers remains the ‘gold standard’ for high-fidelity data, capturing total enteric emissions (oral, nasal and anal). However, its limited throughput (30–50 animals/year) restricts its use to establishing reference populations. To achieve the scale required for breeding programmes – often involving thousands of animals – the industry has shifted towards high-throughput proxies. Automated Head-Chamber systems, such as GreenFeed (C-Lock Inc.), estimate CH4 flux during bait-station visits, providing a balance between precision and scalability (750–1,250 animals/unit/year). In contrast, ‘Sniffer’ methods (using NDIR or FTIR sensors) integrated into automatic milking systems (AMSs) measure gas concentrations in the breath. While Sniffers offer superior scalability (2,000–3,000 animals/year), they provide concentration data (MeC) rather than absolute mass flux (MeP), requiring complex adjustments for cow head position and ventilation (Garnsworthy et al., Reference Garnsworthy, Difford, Bell, Bayat, Huhtanen, Kuhla, Lassen, Peiren, Pszczola, Sorg, Visker and Yan2019). The SF6 tracer technique remains a viable option for grazing systems, though its labour-intensive nature limits its application in routine genetic screening. Newer tools like the laser methane detector offer rapid spot measurements but exhibit higher intra-animal coefficient of variation, necessitating repeated sampling to achieve reliable breeding value estimation.
Methane emission traits
In the context of genetic improvement, CH4 traits are categorised based on their biological definition, their relationship with other production indices and the underlying measurement methodologies (Zetouni et al., Reference Zetouni, Kargo, Norberg and Lassen2018b; Manzanilla-Pech et al., Reference Manzanilla-Pech, Lovendahl, Gordo, Difford, Pryce, Schenkel, Wegmann, Miglior, Chud, Moate, Williams, Richardson, Stothard and Lassen2021). Based on the deployment platform and processing methodology, the resulting phenotypic data are classified into four distinct metric categories: concentration (typically expressed in parts per million [ppm] or CH₄c), emission rate (expressed as g/d or g/h), ratio metrics (e.g., CH₄/CO₂) and derived traits (e.g., MeY or MeI).
Despite the precision of directly measured emission rates, their high cost necessitates the widespread use of indirectly predicted traits (proxies) for large-scale genetic evaluation. These proxies rely on models based on milk MIR spectra, rumen microbiota profiles or fatty acid (FA) composition. While mechanistic models simulate rumen fermentation, current breeding objectives focus more on empirical and machine learning models that integrate milk components to predict CH4 efficiently at a population level (Ross et al., Reference Ross, Wang, Zheng, Yan and Shirali2024). However, when implementing these models, it is critical to distinguish between absolute emission traits (e.g., MeP) and efficiency-based traits (e.g., MeI), as the latter is genetically correlated with milk yield, potentially leading to unintended selection pressures. The following sections categorise these traits into primary, ratio and residual metrics to evaluate their suitability for inclusion in national breeding indexes.
Primary traits
Methane production
MeP represents the total daily emission rate of CH4 per cow (Martínez-Marín et al., Reference Martínez-Marín, Toledo-alvarado, Amalfitano, Gallo and Bittante2024). It is commonly expressed as litres per day (L/d) or converted to grams per day (g/d) using the density of CH4 (approximately 0.668 g/L at 20°C) (Lassen and Difford, Reference Lassen and Difford2020; López-Paredes et al., Reference López-Paredes, Goiri, Atxaerandio, García-rodríguez, Ugarte, Jiménez-Montero, Alenda and González-Recio2020; Richardson et al., Reference Richardson, Crowley and Amer2023). Across 23 studies that reported MeP in g/d, the weighted mean of MeP was 423 ± 67 g/d (Table 1). Additional study characteristics are provided in Supplementary Table S1.
MeP trait values, heritability and basic herd information

Table 1 Long description
Methane emission traits in dairy cattle are summarized across studies, reporting daily methane output (mostly grams per day) measured directly or predicted, along with breed, heritability, and sample sizes (herds and cows). Holstein results dominate and typically center around roughly 300 to 470 grams per day, with extremes including about 182 grams per day in one study and about 499 grams per day in another. Predicted Holstein values from large datasets are commonly around 408 to 453 grams per day, including multiple entries with over 28,000 to 56,000 cows, and one multi-country dataset includes 167,514 cows with both direct and predicted values ranging from about 367 to 448 grams per day. Holstein Friesian studies show wide ranges, including a broad 200 to 400 grams per day summary and a predicted set near 100 to 166 grams per day in one report, while direct measurements include about 279 grams per day and up to about 503 grams per day depending on study. Brown Swiss predicted values are lower to midrange, around 281 grams per day in one study and about 358 grams per day in others. Heritability estimates vary widely across studies, most often around 0.2 to 0.4, with some reports giving ranges and one entry listing a value of 1, indicating substantial between-study differences in methods and reporting. One additional trait is reported in energy units for a mixed-breed population, about 21.6 megajoules per day with heritability 0.46. Comparisons should be made cautiously because studies mix direct versus predicted methods, different breeds, and different ways of expressing uncertainty (standard errors, standard deviations, or ranges), and one row has missing methane value data.
Notes: D, directly measured; P, predicted breeds; H, Holstein; HF, Holstein–Friesian; BS, Brown Swiss; Mix, mix of Holstein–Friesian, Nordic Red, Jersey, Holstein–Friesian × Jersey. Results were presented as means ± SE or means (SD).
a L/d was converted to g/d based on the density of methane.
b predicted by milk yield; ECM; milk protein concentration (%) and energy-corrected milk.
MeP is influenced by feed intake, milk yield, body weight (BW), metabolic body weight (MBW), lactation stage, parity, diet composition, rumen function and individual animal variation. Higher dry matter intake (DMI) typically leads to higher CH4 output (Martínez-Marín et al., Reference Martínez-Marín, Toledo-alvarado, Amalfitano, Gallo and Bittante2024). Higher-yielding cows generally emit more CH4 due to greater feed intake and often greater BW (Bell et al., Reference Bell, Eckard, Haile-mariam and Pryce2013; López-Paredes et al., Reference López-Paredes, Goiri, Atxaerandio, García-rodríguez, Ugarte, Jiménez-Montero, Alenda and González-Recio2020). MeP is positively associated with DMI and energy-corrected milk (ECM) (Guinguina et al., Reference Guinguina, Yan, Lund, Bayat, Hellwing and Huhtanen2020). MeP varies across lactation, typically increasing towards mid-lactation and being higher in multiparous cows (de Haas et al., Reference de Haas, Windig, Calus, Dijkstra, de Haan, Bannink and Veerkamp2011; Fresco et al., Reference Fresco, Boichard, Fritz, Lefebvre, Barbey, Gaborit and Martin2023). First-lactation animals are lighter, consume less feed and consequently have lower MeP (Manzanilla-Pech et al., Reference Manzanilla-Pech, Difford, Lovendahl, Stephansen and Lassen2022a).
Methane concentration
MeC reflects the CH4 concentration measured in the air near the cow’s head and is typically expressed in ppm (van Engelen et al., Reference van Engelen, Bovenhuis, van der Tol and Visker2018; Manzanilla-Pech et al., Reference Manzanilla-Pech, Difford, Lovendahl, Stephansen and Lassen2022a). MeC is measured using sniffer devices installed in GreenFeed or AMSs, capturing eructated gases during feeding or milking (López-Paredes et al., Reference López-Paredes, Goiri, Atxaerandio, García-rodríguez, Ugarte, Jiménez-Montero, Alenda and González-Recio2020; Manzanilla-Pech et al., Reference Manzanilla-Pech, Stephansen, Difford, Lovendahl and Lassen2022b). To ensure data normality and mitigate scaling discrepancies when integrating methane measurements with other traits, the natural logarithm transformation (ln × 100) was first introduced for sniffer-based data by Difford et al. (Reference Difford, Lassen and Løvendahl2016). This methodological approach has since been consistently adopted in subsequent large-scale genetic studies (Manzanilla-Pech et al., Reference Manzanilla-Pech, Gordo, Difford, Lovendahl and Lassen2020, Reference Manzanilla-Pech, Difford, Lovendahl, Stephansen and Lassen2022a). MeC shows substantial variability across studies, with a weighted mean of 612.0 ± 254.8 ppm (Table 2). Additional study characteristics are provided in Supplementary Table S2.
MeC traits values, heritability and basic herd information

Table 2 Long description
Methane concentration trait values are summarized across multiple dairy studies, with units reported as ppm, ppm per day, or log-transformed versions, and results given by breed, heritability, and sample size. Directly measured ppm means span from 325 to 1,288, with the highest mean reported for Holstein and several Holstein-Friesian means between 367 and 719. Reported heritability for directly measured ppm is generally low to moderate, ranging from about 0.11 to 0.37, with Holstein-Friesian often at the higher end in the larger datasets. One study reports ppm per day values around 505 and 517 with a low heritability estimate near 0.085 and a wide uncertainty range. Log-transformed measures show similar central values in the mid 570s for Holstein, with heritability commonly around 0.14 to 0.26, though one entry reports a broad range rather than a single estimate and another omits heritability. Study sizes vary widely, from 2 herds and 483 cows up to 52 herds and 4,664 cows, which can affect the stability and comparability of estimates. Comparisons across rows should be made cautiously because measurement scales and transformations differ between studies and some fields are missing.
Notes: D, directly measured; P, predicted breeds; H, Holstein, HF, Holstein–Friesian; Results were presented as means ± SE or means (SD).
Ratio traits
Methane yield
MeY quantifies CH4 emitted per unit of feed consumed and is typically expressed as g CH4/kg DMI (Manzanilla-Pech et al., Reference Manzanilla-Pech, Lovendahl, Gordo, Difford, Pryce, Schenkel, Wegmann, Miglior, Chud, Moate, Williams, Richardson, Stothard and Lassen2021; Richardson et al., Reference Richardson, Nguyen, Abdelsayed, Moate, Williams, Chud, Schenkel, Goddard, van den Berg, Cocks, Marett, Wales and Pryce2021c; Fresco et al., Reference Fresco, Boichard, Fritz, Lefebvre, Barbey, Gaborit and Martin2023). Some studies refer to the trait simply as CH4/DMI (Bittante et al., Reference Bittante, Cecchinato and Schiavon2018; Martínez-Marín et al., Reference Martínez-Marín, Toledo-alvarado, Amalfitano, Gallo and Bittante2024). A summary of papers reporting MeY is shown in Table 3, with extended study details available in Supplementary Table S3.
MeY traits values, heritability and basic herd information

Table 3 Long description
Methane yield is reported as grams per kilogram of dry matter intake, plus two related measures labeled DMIIR and DMIFAIR, alongside breed, heritability, number of herds, and number of cows by study. Mean methane yield spans roughly 15.4 to 25.4 across studies, with most Holstein entries clustering around 17 to 21. The highest mean value is 25.4 in a Holstein study with 233 cows, while the lowest mean is 15.4 in a Holstein dataset with 572 cows and no herd count listed. Heritability estimates range from about 0.12 to 0.44, with many results in the mid range around 0.2 to 0.33. The largest dataset, a Holstein study with 1508 herds and 167,514 cows, reports a mean near 17.8 and heritability near 0.37. Holstein Friesian results from one source include three heritability estimates from about 0.12 to 0.44 with means near 20.9 to 23.6, indicating sensitivity to model or trait definition. Brown Swiss entries report means around 21.34 with heritability about 0.24 to 0.35 for the alternative measures. Comparisons should be made cautiously because studies differ in sample size, herd coverage, breed reporting, and whether variability is given as standard deviation or standard error.
Note: Results were presented as means ± SE or means (SD).
MeY reflects the methanogenic efficiency of digestion and is only weakly correlated with DMI, fat- and protein-corrected milk (FPCM), BW and body condition score. It offers potential for selecting animals with reduced CH₄ emissions per unit of feed consumed, with minimal consequences for production (Fresco et al., Reference Fresco, Boichard, Fritz, Lefebvre, Barbey, Gaborit and Martin2023; Richardson et al., Reference Richardson, Crowley and Amer2023).
However, the positive relationship between MeY and digestibility presents a challenge as it limits the potential for improving feed efficiency by selecting for low CH4 emissions and high digestibility simultaneously. Caution is needed, as selecting for low-emitting animals might risk selecting for animals with reduced neutral detergent fibre digestibility, which is important for ruminant nutrition (Guinguina et al., Reference Guinguina, Yan, Lund, Bayat, Hellwing and Huhtanen2020). Thus, MeY offers promise but requires careful consideration within breeding programmes.
Methane intensity
MeI expresses CH4 production relative to milk yield, commonly in g CH4/kg milk or g CH4/kg FPCM or ECM (Richardson et al., Reference Richardson, Amer, Hely, van den Berg and Pryce2021a). This trait reflects environmental efficiency by linking emissions to productive output and aligns with global demands for sustainable increases in milk production (Richardson et al., Reference Richardson, Crowley and Amer2023). MeI depends strongly on milk yield and the associated energy requirements. MeI can be estimated directly (CH₄ ÷ milk output) or using milk FA–based prediction equations (van Lingen et al., Reference van Lingen, Crompton, Hendriks, Reynolds and Dijkstra2014; Bittante et al., Reference Bittante, Cecchinato and Schiavon2018, Reference Bittante, Cipolat-gotet and Cecchinato2020). Some studies calculate MeI by dividing MeP by ECM (Manzanilla-Pech et al., Reference Manzanilla-Pech, Stephansen, Difford, Lovendahl and Lassen2022b). Details are provided in Table 4, with additional study characteristics in Supplementary Table S4.
MeI traits values, heritability and basic herd information

Table 4 Long description
Methane intensity traits in dairy cattle are summarized across multiple studies, reporting average values with variability, breed, heritability, and sample sizes (herds and cows). For methane per kg fat- and protein-corrected milk, Brown Swiss averages about 14.26, while Holstein-related populations range from about 10 to 15, with a large dataset reporting 14.0. Heritability for methane per kg corrected milk varies widely: Brown Swiss estimates are low to moderate (about 0.12 to 0.27), while Holstein estimates span from about 0.18 up to roughly 0.69 depending on study design and trait definition. Alternative milk-basis measures include methane per kg milk (about 10.6 and 15.2 in two small Holstein datasets) and per liter milk (about 8.61 in a larger Holstein dataset), with heritability near 0.21 in those reports. Energy-corrected milk measures show means around 9.2 to 18.15, with heritability around 0.18 to 0.38. Cheese-related intensity traits in Brown Swiss are much higher in absolute value because they are per unit of cheese output: about 100 per kg fresh cheese or curd and about 208 per kg cheese solids, with heritability generally around 0.14 to 0.22 and separate direct versus indirect measurement variants reported in some rows. Comparisons across rows should be made cautiously because units, product bases (milk, corrected milk, cheese), measurement approaches, and sample sizes differ substantially, and some estimates include interval bounds or repeatability rather than a single heritability value.
Notes: FPCM, fat- and protein-corrected milk; CMIR, multiplying the measured corrected milk yield by the direct-IR methane intensity of milk; CMFAIR, multiplying the measured corrected milk yield by the indirect-IR methane intensity of milk based on FAIR; CYCURD, methane intensity per unit of fresh cheese; CYSOLIDS, methane intensity per unit of cheese solids. Results were presented as means ± SE or means (SD).
a Bounds of the 95% high posterior density interval.
b Repeatability.
c Direct IR.
d Indirect IR.
Methane-to-carbon dioxide (CH4/CO2) ratio
The CH₄/CO₂ ratio represents the relative concentrations of CH₄ and CO₂ in exhaled air and is measured non-invasively using FTIR spectroscopy or sniffer devices in AMSs. It is typically expressed as a ratio of ppm concentrations (Lassen and Lovendahl, Reference Lassen and Lovendahl2016; Zetouni et al., Reference Zetouni, Kargo, Norberg and Lassen2018b; Uemoto et al., Reference Uemoto, Tomaru, Masuda, Uchisawa, Hashiba, Nishikawa, Suzuki, Kojima, Suzuki and Terada2024) and serves as a self-normalising internal marker to account for variable breath dilution in open-air environments; however, the compounding of measurement errors from both gas sensors often leads to lower estimates of heritability and limited genetic utility compared to absolute emission traits. This ratio is often used in equations predicting MeP. Studies reporting this trait are summarised in Table 5, and extended details are available in Supplementary Table S5.
CH4/CO2 ratio, heritability and basic herd information

Table 5 Long description
CH4 to CO2 ratio values and heritability estimates are reported across studies, along with breed, number of herds, and number of cows. For breed H, the ratio is 0.087 with standard deviation 0.012 in 20 herds and 3,121 cows, with heritability 0.16 plus or minus 0.04; another H study reports 0.062 with standard deviation 0.007 in 1 herd and 182 cows, with heritability 0.12 plus or minus 0.14. For breed HF, reported ratios are 0.13 with standard deviation 0.12 in 14 herds and 1,746 cows with heritability 0.02 plus or minus 0.01, and 0.17 with standard deviation 0.12 in 11 herds and 1,508 cows with no heritability listed. The same HF dataset also reports the log-transformed ratio as minus 0.87 with standard deviation 0.27, with heritability 0.03 plus or minus 0.01. Across studies, heritability estimates are consistently low, suggesting limited genetic contribution relative to other sources of variation. Comparisons should be made cautiously because breeds, sample sizes, and whether the trait is transformed differ by study, and one row lacks a heritability value.
Note: Results were presented as means ± SE or means (SD).
Standardised traits
Residual methane traits
Residual methane traits quantify variation in CH4 emissions after adjusting for major determinants such as DMI, ECM and BW (Manzanilla-Pech et al., Reference Manzanilla-Pech, Lovendahl, Gordo, Difford, Pryce, Schenkel, Wegmann, Miglior, Chud, Moate, Williams, Richardson, Stothard and Lassen2021; Richardson et al., Reference Richardson, Nguyen, Abdelsayed, Moate, Williams, Chud, Schenkel, Goddard, van den Berg, Cocks, Marett, Wales and Pryce2021c, Reference Richardson, Crowley and Amer2023). These traits aim to identify animals that emit less CH4 than expected for their level of production and body size. Residual CH₄ is calculated as the difference between observed and predicted CH₄ output, using either phenotypic regression (based on observed values) or genetic regression (based on estimated breeding values or direct genomic values). Different definitions have led to trait variants such as RMet (partial regression on MBW, DMI and ECM) and RMP (residual CH₄ from selected predictor traits). Table 6 summarises the relevant studies, with extended details in Supplementary Table S6.
Residual methane trait values, heritability and basic herd information

Table 6 Long description
Residual methane traits are summarized by unit, average value with variability, breed, heritability with standard error, and sample size in herds and cows, with citations. For Holsteins, RMeC averages minus 0.6 grams per day with a standard deviation of 45.3 and heritability 0.23 plus or minus 0.06 in 517 cows from 1 herd. Holstein RMeP averages minus 0.1 grams per day with a standard deviation of 62.7 and heritability 0.16 plus or minus 0.02 in 511 cows from 1 herd. Three Holstein RMeP variants labeled 1 to 3 have mean values near zero grams per day with standard deviations around 48 to 51, and heritability ranging from 0.13 to 0.16 across 15 herds and 2,168 cows. A separate set of residual methane trait variants in Holsteins reports heritability estimates from 0.11 to 0.21, based on 12 herds and 379 cows. Across all entries, heritability is consistently low to moderate, and differences between studies may reflect different trait definitions and sample sizes rather than true biological contrasts.
Notes: RMet1, residual methane on metabolic body weight (MBW) and DMI; RMet2, residual methane on MBW and ECM; RMet3, residual methane on MBW, DMI and ECM. Results were presented as means ± SE or means (SD).
Genetic standardised methane (GSMet)
The GSMet trait standardises MeP across countries by accounting for differences in genetic variance. GSMet (g/d) is calculated as:
 \begin{equation*}{\text{GSMet}}\, = \,\frac{{{\text{MeP}}}}{{{\text{Country}}\,{\text{genetic}}\,{\text{SD/mean}}\,\,{\text{genetic}}\,{\text{SD}}\,{\text{across}}\,{\text{countries}}}}\end{equation*}
where MeP represents CH4 production in grams per day, country genetic SD is the genetic standard deviation of MeP within a specific country and mean genetic SD across countries is the average genetic standard deviation of MeP across all included countries.
GSMet enables more consistent comparisons among populations and supports international CH₄ evaluations (Manzanilla-Pech et al., Reference Manzanilla-Pech, Lovendahl, Gordo, Difford, Pryce, Schenkel, Wegmann, Miglior, Chud, Moate, Williams, Richardson, Stothard and Lassen2021). GSMet is used to assess correlations between CH₄ emissions and economically relevant traits, such as milk yield, DMI, BW and MeP, and to determine whether selection on GSMet differs from selection on MeP. Although GSMet facilitates global evaluations, its accuracy depends on reliable estimates of genetic standard deviations, which may vary among populations, measurement systems and statistical models. These factors should be considered when interpreting GSMet.
Genetic parameters of methane traits
Studies using random regression models indicate that heritability for CH4 traits varies throughout lactation. For directly measured MeP, heritability estimates range from 0.11 to 0.49 in first lactation and 0.14 to 0.36 in second lactation, generally peaking mid-lactation, mirroring ECM and DMI heritability trends (Manzanilla-Pech et al., Reference Manzanilla-Pech, Difford, Lovendahl, Stephansen and Lassen2022a). Pszczola et al. (Reference Pszczola, Rzewuska, Mucha and Strabel2017) reported MeP heritability starting at 0.23 in early lactation, peaking at 0.30 around 212 DIM and declining to 0.27 in late lactation. A summary of heritability estimates for directly measured MeP across the selected literature is shown in Fig. 3, indicating a weighted mean of 0.33, suggesting moderate heritability of the MeP trait. In addition, some studies predicted MeP based on milk FAs, milk yield, standard BW, feed intake and diet composition. However, the recent study by Manzanilla-Pech et al. (Reference Manzanilla-Pech, van Breukelen, Veerkamp, de Haas, van Pelt and Gredler-Grandl2026) raises a cautionary note regarding MeP phenotypes: heritability estimates varied markedly (0.03–0.27) across calculation formulas, and genetic correlations with BW showed inconsistent directions. These findings compellingly indicate that phenotypes nominally designated as ‘methane production’ are not inherently equivalent. Rigorous scrutiny of underlying computational methodologies is therefore imperative when selecting traits for breeding objectives or interpreting comparative genetic research (Manzanilla-Pech et al., Reference Manzanilla-Pech, van Breukelen, Veerkamp, de Haas, van Pelt and Gredler-Grandl2026). While predicted methane studies generally involve larger herds than direct measurement studies, the higher predicted heritabilities are primarily driven by the methodology; milk components (such as FA profiles and MIR spectra) are inherently highly heritable traits, which consequently inflates the heritability estimates of the predicted CH₄ emissions. Across studies, the estimated heritability of predicted CH4 emissions ranges from 0.13 to 0.45 (Fig. 4).
Forest plot of heritability estimates for directly measured methane production (MeP).

Figure 3 Long description
The forest plot displays heritability estimates for methane production across various studies. The x-axis is labeled ′Heritability Estimate (95 percent CI)′ and ranges from 0 to 0.5. Each study is represented by a horizontal line with a marker indicating the heritability estimate and confidence interval. Studies are listed on the left, including authors and sample sizes, such as ′Quinquina et al., 2020 (n = 609)′ and ′Manzanilla-Pech et al., 2021 (n = 279).′ Different markers are used to represent various studies, including circles, squares and diamonds. A vertical dashed red line marks the weighted mean at 0.23. The legend at the bottom identifies symbols representing different studies or conditions, such as AU, CA, CH, DK, DKMUCAACH, ES, IN, NL, UK, UKDKFI. The plot visually compares the heritability estimates, showing variability among studies.
Forest plot of heritability estimates for predicted methane production (MeP).

Figure 4 Long description
Heritability Estimate (95 percent CI) Forest plot with study names listed on the left and one point estimate with a horizontal confidence interval for each study on the right. The x-axis is labeled Heritability Estimate (95 percent CI), ranging from 0.0 to 0.5 with tick labels at 0.0, 0.1, 0.2, 0.3, 0.4 and 0.5. A vertical dashed reference line is drawn at 0.34, labeled Weighted mean 0.34. Each row shows a marker (square, triangle, or diamond) with a horizontal line indicating the confidence interval. Point estimates span from about 0.1 to about 0.4. Several estimates cluster between 0.2 and 0.35. One row shows a long confidence interval extending from near 0.0 to near 0.4. Multiple rows have confidence intervals that cross the 0.34 reference line.
MeC heritability estimates range from 0.11 to 0.34 with a weighted mean of 0.24 across studies (Fig. 5). In Danish Holstein cows, the estimated heritability for ln-transformed MeC ranged from 0.10 to 0.28 in the first lactation and from 0.13 to 0.29 in the second lactation (Manzanilla-Pech et al., Reference Manzanilla-Pech, Difford, Lovendahl, Stephansen and Lassen2022a). Other studies report 0.11 (SE = 0.03) based on weekly averages (López-Paredes et al., Reference López-Paredes, Goiri, Atxaerandio, García-rodríguez, Ugarte, Jiménez-Montero, Alenda and González-Recio2020) and values from 0.13 to 0.32 for different CH4 measurement methods (van Breukelen et al., Reference van Breukelen, Aldridge, Veerkamp and de Haas2022). Repeatability for MeC ranges from 0.46 to 0.66 (López-Paredes et al., Reference López-Paredes, Goiri, Atxaerandio, García-rodríguez, Ugarte, Jiménez-Montero, Alenda and González-Recio2020; van Breukelen et al., Reference van Breukelen, Aldridge, Veerkamp, Koning, Sebek and de Haas2023; Uemoto et al., Reference Uemoto, Tomaru, Masuda, Uchisawa, Hashiba, Nishikawa, Suzuki, Kojima, Suzuki and Terada2024), indicating consistent measurements. High genetic correlations between MeC and MeP suggest that selection for lower MeC may lead to a correlated reduction in MeP when MeP is directly measured (Manzanilla-Pech et al., Reference Manzanilla-Pech, Gordo, Difford, Lovendahl and Lassen2020; van Breukelen et al., Reference van Breukelen, Aldridge, Veerkamp, Koning, Sebek and de Haas2023); this relationship may differ when MeP is predicted.
Forest plot of methane concentration (MeC) heritability estimates.

Figure 5 Long description
Methane Concentration (MeC) Heritability Estimates Forest plot with study names listed on the left and a horizontal scale for heritability estimate on the bottom. The x-axis label is Heritability Estimate (95 percent CI). The x-axis ranges from 0.0 to 0.6 with tick marks at 0.0, 0.1, 0.2, 0.3, 0.4, 0.5 and 0.6. A vertical dashed reference line is drawn at 0.24, with the text Weighted mean = 0.24 placed near the bottom. Sixteen rows of point estimates are shown as filled squares, filled triangles and one open diamond, each with a horizontal line indicating the confidence interval. From top to bottom, the plotted point estimates align near: about 0.30; about 0.28; about 0.27; about 0.24; about 0.20; about 0.21; about 0.26; about 0.22; about 0.23; about 0.24; about 0.20; about 0.21; about 0.19; about 0.18; about 0.16; and an open diamond near about 0.12. Several confidence intervals extend across multiple tick intervals, with the widest intervals spanning from near 0.0 up to around 0.4. Most point estimates fall between 0.15 and 0.30 and lie close to the dashed line at 0.24. A legend at the bottom lists marker labels: DK, ES, NL and PL. A note below states that the error bars represent confidence intervals.
Across lactation, MeC heritability ranges from 0.10 to 0.29, showing more stability than MeP (Manzanilla-Pech et al., Reference Manzanilla-Pech, Difford, Lovendahl, Stephansen and Lassen2022a). Breider et al. (Reference Breider, Wall and Garnsworthy2019) reported the lowest heritability (0.12 ± 0.16) in mid-lactation and the highest (0.45 ± 0.11) in late lactation. Sypniewski et al. (Reference Sypniewski, Strabel and Pszczola2021) observed an increase from 0 to 0.14 throughout lactation. Another study reported weekly mean MeC heritability peaking around 134 DIM before declining (van Breukelen et al., Reference van Breukelen, Veerkamp, de Haas and Aldridge2024). This difference may reflect an evolution in methodologies for methane genetics. Breider et al. provided baseline estimates under controlled conditions, whereas van Breukelen et al. utilised larger-scale datasets and advanced random regression methods to capture more detailed lactation patterns. Both studies offer valuable perspectives, with their differences highlighting advances in data availability and analytical approaches.
Heritability estimates for MeY (g CH4/kg DMI) range from 0.12 ± 0.06 to 0.44 ± 0.10 with a weighted mean heritability of 0.36 across studies (Fig. 6). Quantitative genetic analyses consistently characterise MeY as a moderately heritable trait; for instance, large-scale, multi-country evaluations have established a heritability estimate of 0.30 (Manzanilla-Pech et al., Reference Manzanilla-Pech, Lovendahl, Gordo, Difford, Pryce, Schenkel, Wegmann, Miglior, Chud, Moate, Williams, Richardson, Stothard and Lassen2021). This is corroborated by independent studies reporting comparable heritability estimates for both measured and predicted MeY, ranging from 0.27 to 0.44 (van Engelen et al., Reference van Engelen, Bovenhuis, Dijkstra, van Arendonk and Visker2015; Kamalanathan et al., Reference Kamalanathan, Houlahan, Miglior, Chud, Seymour, Hailemariam, Plastow, de Oliveira, Baes and Schenkel2023). Furthermore, genetic correlations between CH4 traits, including MeY, range from 0.41 to 0.97 (Manzanilla-Pech et al., Reference Manzanilla-Pech, Lovendahl, Gordo, Difford, Pryce, Schenkel, Wegmann, Miglior, Chud, Moate, Williams, Richardson, Stothard and Lassen2021). Such a robust genetic architecture underscores the feasibility of integrating MeY into multi-trait genomic selection indexes, offering a permanent and cumulative strategy to elicit favourable correlated responses across the broader enteric emission profile.
Forest plot of methane yield (MeY) heritability estimates.

Figure 6 Long description
Study list on the left with one horizontal confidence-interval line and one point marker per row, plus a vertical dashed reference line and a weighted-mean label. The x-axis label reads Heritability Estimate (95 percent CI). Tick labels shown are 0.0, 0.1, 0.2, 0.3, 0.4, 0.5 and 0.6. Rows from top to bottom: van Engelen et al., 2015 (Simplified) (n equals 1,905): point near 0.45 with a horizontal interval spanning roughly 0.35 to 0.55. Fresco et al., 2024 (n equals 167,514): point near 0.35 with interval roughly 0.30 to 0.40. Manzanilla-Pech et al., 2020 (n equals 2,113): point near 0.30 with interval roughly 0.20 to 0.40. Bitante et al., 2020 (n equals 958): point near 0.30 with interval roughly 0.25 to 0.35. Kamalanathan et al., 2023 (n equals 287): point near 0.25 with interval roughly 0.05 to 0.55. Bitante and Cecchinato, 2020 (n equals 1,091): point marker shown without a horizontal interval. Richardson et al., 2021c (n equals 379): point near 0.30 with interval roughly 0.20 to 0.40. Manzanilla-Pech et al., 2022b (n equals 572): point near 0.30 with interval roughly 0.20 to 0.40. van Engelen et al., 2015 (Restricted-FA) (n equals 1,905): point near 0.20 with interval roughly 0.05 to 0.35. van Engelen et al., 2015 (Comprehensive) (n equals 1,905): point near 0.15 with interval roughly 0.05 to 0.25. A vertical dashed line is drawn at about 0.36. Text near the lower right reads Weighted mean equals 0.36.
MeI is also heritable, supporting potential as a selection criterion. The weighted mean heritability across studies is 0.28 (Fig. 7). Reported estimates include 0.21 ± 0.06 for MeI (g CH4/L milk) and 0.21 ± 0.14 for MeI (g CH4/kg milk) (Lassen and Lovendahl, Reference Lassen and Lovendahl2016; Kandel et al., Reference Kandel, Vanrobays, Vanlierde, Dehareng, Froidmont, Gengler and Soyeurt2017; Kamalanathan et al., Reference Kamalanathan, Houlahan, Miglior, Chud, Seymour, Hailemariam, Plastow, de Oliveira, Baes and Schenkel2023). Other studies document estimates ranging from 0.12 (Bittante et al., Reference Bittante, Cipolat-gotet and Cecchinato2020) to 0.58 (de Haas et al., Reference de Haas, Windig, Calus, Dijkstra, de Haan, Bannink and Veerkamp2011) for predicted CH4 per kg FPCM.
Forest plot of methane intensity (MeI) heritability estimates.

Figure 7 Long description
Heritability Estimate (95 percent CI) Single forest plot with study names listed on the left and one horizontal confidence-interval line per study. The x-axis is labeled Heritability Estimate (95 percent CI), with tick labels 0.0, 0.1, 0.2, 0.3, 0.4, 0.5, 0.6. The y-axis has no axis label and consists of a vertical list of study entries. A vertical dashed reference line is drawn at 0.28, with nearby text reading Weighted mean equals 0.28. Each study row shows a point marker and a horizontal line for the 95 percent confidence interval. Several rows have point markers clustered between about 0.1 and 0.3, with confidence intervals extending left and right by varying amounts. One row shows a point marker near 0.58. Multiple rows show confidence intervals that extend close to 0.0 on the left and to between about 0.3 and 0.5 on the right. A note at the bottom states: Note: Error bars represent 95 percent confidence intervals.
GSMet heritability is estimated at 0.15 ± 0.03, lower than that of MeP (0.21 ± 0.04), suggesting standardisation across countries reduces additive genetic variance and increases the relative contribution of environmental variance (Manzanilla-Pech et al., Reference Manzanilla-Pech, Lovendahl, Gordo, Difford, Pryce, Schenkel, Wegmann, Miglior, Chud, Moate, Williams, Richardson, Stothard and Lassen2021).
Residual CH4 traits generally show low to moderate heritability (Fig. 8) and are often highly correlated with MeP (Manzanilla-Pech et al., Reference Manzanilla-Pech, Lovendahl, Gordo, Difford, Pryce, Schenkel, Wegmann, Miglior, Chud, Moate, Williams, Richardson, Stothard and Lassen2021; Richardson et al., Reference Richardson, Nguyen, Abdelsayed, Moate, Williams, Chud, Schenkel, Goddard, van den Berg, Cocks, Marett, Wales and Pryce2021c). Reported estimates of heritability range from 0.10 ± 0.09 to 0.21 ± 0.10 (Richardson et al., Reference Richardson, Nguyen, Abdelsayed, Moate, Williams, Chud, Schenkel, Goddard, van den Berg, Cocks, Marett, Wales and Pryce2021c), with heritabilities between 0.13 and 0.16 in other residual CH4 traits (Manzanilla-Pech et al., Reference Manzanilla-Pech, Lovendahl, Gordo, Difford, Pryce, Schenkel, Wegmann, Miglior, Chud, Moate, Williams, Richardson, Stothard and Lassen2021). These variations underscore that the heritability of residual CH4 is highly sensitive to its specific formulation and adjustment factors (e.g., MBW, DMI and ECM). Specifically, as demonstrated in Australian Holstein cows, the highest estimates (0.18–0.21) were obtained when residual CH4 was adjusted for DMI, ECM and FeedSaved, a composite trait based on direct genomic value for residual feed intake (RFI) and estimated breeding value for BW. This adjustment strategy effectively isolates the intrinsic biological variation in MeP from maintenance and production requirements (Richardson et al., Reference Richardson, Nguyen, Abdelsayed, Moate, Williams, Chud, Schenkel, Goddard, van den Berg, Cocks, Marett, Wales and Pryce2021c). A key advantage of this phenotype is its near-zero genetic correlation with ECM but positive genetic correlation with RFI, indicating that selecting for improved feed efficiency can simultaneously yield cows with lower residual CH4 emissions (Manzanilla-Pech et al., Reference Manzanilla-Pech, Lovendahl, Gordo, Difford, Pryce, Schenkel, Wegmann, Miglior, Chud, Moate, Williams, Richardson, Stothard and Lassen2021).
Forest plot of residual methane traits (ReM) heritability estimates.

Figure 8 Long description
Manzanilla-Pech et al., 2022b RMeC (n equals 517) Richardson et al., 2021c RMPPECM (n equals 379) Richardson et al., 2021c RMP plus ECMgECM (n equals 379) Richardson et al., 2021c RMP DMI (n equals 379) Manzanilla-Pech, et al., 2021 RMeT3 (n equals 2,168) Manzanilla-Pech, et al., 2022b RMeP (n equals 511) Richardson et al., 2021c RMP FS (n equals 379) Manzanilla-Pech, et al., 2021 RMeT1 (n equals 2,168) Manzanilla-Pech, et al., 2021 RMeT2 (n equals 2,168) Richardson et al., 2021c RMPFS gECM and RMPgECM (n equals 379) Horizontal axis label: Heritability Estimate (95 percent CI). Axis range from 0.0 to 0.6 with tick labels at 0.0, 0.1, 0.2, 0.3, 0.4, 0.5, 0.6. A vertical dashed reference line is labeled Weighted mean equals 0.15. Each row shows a point estimate with a horizontal 95 percent confidence interval. Point markers vary by study and are shown in a legend with labels AU, DK and DKIAUCAUCH. Point estimates appear between about 0.10 and about 0.21, with confidence intervals extending on several rows from near 0.0 to roughly 0.35. Text below the plot includes a note defining RMeT1, RMeT2 and RMeT3 as residual methane on metabolic body weight and additional residual methane formulations including DMI and ECM.
Variability in heritability estimates arises from differences in trait definitions, measurement protocols, populations, sample sizes and statistical models (van Breukelen et al., Reference van Breukelen, Aldridge, Veerkamp and de Haas2022; Lopes et al., Reference Lopes, Schenkel, Houlahan, Rochus, Oliveira, Oliveira, Miglior, Alcantara, Tulpan and Baes2024). Changes in heritability during lactation likely reflect physiological shifts, such as energy balance and feed intake (Kandel et al., Reference Kandel, Gengler and Soyeurt2015). These findings underline the need to account for measurement methods and lactation stage when estimating genetic parameters for CH4 traits and designing breeding programmes targeting CH4 emissions reduction (Pszczola et al., Reference Pszczola, Rzewuska, Mucha and Strabel2017).
Genetic parameters for the CH4/CO2 ratio have been extensively investigated. Repeatability estimates are generally low to moderate, while heritability is typically low, ranging from 0.01 to 0.02 in several studies (van Breukelen et al., Reference van Breukelen, Aldridge, Veerkamp and de Haas2022; Uemoto et al., Reference Uemoto, Tomaru, Masuda, Uchisawa, Hashiba, Nishikawa, Suzuki, Kojima, Suzuki and Terada2024); however, a notably higher estimate of 0.16 ± 0.04 was reported by Lassen and Lovendahl (2016). The low heritability of the CH4/CO2 ratio may be attributed to its high sensitivity to environmental fluctuations and measurement errors. Furthermore, as a complex composite trait intrinsically linked to economically important traits – such as energy metabolism and feed efficiency – isolating stable genetic effects for this ratio remains a significant challenge.
Genetic relationships between methane traits and economic traits
MeP in dairy cattle exhibits significant genetic correlations with key economic traits, reflecting a complex interplay between metabolism, productivity and environmental sustainability. MeP is genetically positively correlated with raw milk yield (r = 0.29–0.57) (Breider et al., Reference Breider, Wall and Garnsworthy2019; Manzanilla-Pech et al., Reference Manzanilla-Pech, Lovendahl, Gordo, Difford, Pryce, Schenkel, Wegmann, Miglior, Chud, Moate, Williams, Richardson, Stothard and Lassen2021) and ECM (r = 0.43–0.74) (Lassen and Lovendahl, Reference Lassen and Lovendahl2016; Lopes et al., Reference Lopes, Schenkel, Houlahan, Rochus, Oliveira, Oliveira, Miglior, Alcantara, Tulpan and Baes2024). However, early lactation may present weakly negative genetic correlations (r g = −0.19 to −0.24) due to shifting metabolic priorities and negative energy balance (Pszczola et al., Reference Pszczola, Rzewuska, Mucha and Strabel2017). Genetic correlations between MeP and FPCM range from 0.37 to 0.61 (Difford et al., Reference Difford, Lovendahl, Veerkamp, Bovenhuis, Visker, Lassen and de Haas2020), while associations with milk fat and protein percentages vary widely (r g = −0.30 to 0.85) depending on the predictive models employed (Pszczola et al., Reference Pszczola, Rzewuska, Mucha and Strabel2017; López-Paredes et al., Reference López-Paredes, Goiri, Atxaerandio, García-rodríguez, Ugarte, Jiménez-Montero, Alenda and González-Recio2020; Sypniewski et al., Reference Sypniewski, Strabel and Pszczola2021). High-yielding cows tend to emit less CH₄ per unit of output (MeI); as lactation progresses, milk yield declines while MeP remains relatively stable, thereby increasing MeI. Consequently, MeI is strongly negatively correlated with ECM (r g = −0.60 ± 0.08), largely driven by the dilution effect of milk volume (Fresco et al., Reference Fresco, Boichard, Fritz, Lefebvre, Barbey, Gaborit and Martin2023).
MeP is inherently driven by feed intake and body size. MeP exhibits moderate to strong genetic correlations with DMI (r g = 0.34–0.49; Manzanilla-Pech et al., Reference Manzanilla-Pech, Lovendahl, Gordo, Difford, Pryce, Schenkel, Wegmann, Miglior, Chud, Moate, Williams, Richardson, Stothard and Lassen2021) and RFI (r g up to 0.53; Manzanilla-Pech et al., Reference Manzanilla-Pech, Stephansen, Difford, Lovendahl and Lassen2022b), emphasising that higher emissions are intrinsically linked to greater feed consumption and lower metabolic efficiency. Furthermore, MeP is positively genetically associated with BW (up to r g = 0.65; Manzanilla-Pech et al., Reference Manzanilla-Pech, Lovendahl, Gordo, Difford, Pryce, Schenkel, Wegmann, Miglior, Chud, Moate, Williams, Richardson, Stothard and Lassen2021), particularly MBW (r g = 0.38; López-Paredes et al., Reference López-Paredes, Goiri, Atxaerandio, García-rodríguez, Ugarte, Jiménez-Montero, Alenda and González-Recio2020), reflecting the higher maintenance requirements of larger individuals. The metabolic cost of these emissions is substantial, accounting for approximately 8.6% of DMI energy loss in Holsteins (Olijhoek et al., Reference Olijhoek, Difford, Lund and Lovendahl2020). Feeding behaviour and digestive physiology further modulate this relationship. Genetic analyses indicate that methane traits (MeP and MeC) exhibit a predominantly negative, yet low-to-moderate and highly variable genetic correlation with rumination time (r g ranging from −0.08 to −0.53; Zetouni et al., Reference Zetouni, Difford, Lassen, Byskov, Norberg and Lovendahl2018a). While this suggests a potential biological link where extended rumination may enhance digestive efficiency and mitigate emissions (Lassen and Lovendahl, Reference Lassen and Lovendahl2016; López-Paredes et al., Reference López-Paredes, Goiri, Atxaerandio, García-rodríguez, Ugarte, Jiménez-Montero, Alenda and González-Recio2020; Lopes et al., Reference Lopes, Schenkel, Houlahan, Rochus, Oliveira, Oliveira, Miglior, Alcantara, Tulpan and Baes2024), the negative genetic correlation indicates that increased mastication and subsequent smaller particle size may shift rumen fermentation towards lower acetate-to-propionate ratios (Zetouni et al., Reference Zetouni, Difford, Lassen, Byskov, Norberg and Lovendahl2018a). Nevertheless, the large standard errors and susceptibility to environmental factors – such as diet composition and intake levels – render rumination time an unreliable indirect predictor for methane emissions in large-scale breeding programmes (Zetouni et al., Reference Zetouni, Difford, Lassen, Byskov, Norberg and Lovendahl2018a). Beyond behavioural metrics, the underlying digestive kinetics play a crucial role: lower organic matter digestibility increases MeY, whereas a faster digesta passage rate reduces MeY by partitioning more energy towards milk synthesis (Guinguina et al., Reference Guinguina, Yan, Lund, Bayat, Hellwing and Huhtanen2020).
Regarding functional and morphological traits, a positive correlation between MeI and body condition score suggests a relationship between emissions and energy reserve partitioning (Fresco et al., Reference Fresco, Boichard, Fritz, Lefebvre, Barbey, Gaborit and Martin2023). Additionally, MeP exhibits a weak positive genetic correlation with days open (r = 0.18 ± 0.05) and generally weak associations with other health and fertility traits. These findings indicate that, although a minor biological trade-off between absolute emissions and reproductive performance may exist, strong antagonistic relationships are unlikely (Zetouni et al., Reference Zetouni, Kargo, Norberg and Lassen2018b; López-Paredes et al., Reference López-Paredes, Goiri, Atxaerandio, García-rodríguez, Ugarte, Jiménez-Montero, Alenda and González-Recio2020; Fresco et al., Reference Fresco, Boichard, Fritz, Lefebvre, Barbey, Gaborit and Martin2023).
Methane traits are themselves strongly interrelated, with genetic correlations between MeP and MeY (r g = 0.63–0.73), MeP and MeI (r g = 0.70–0.94) and MeC and MeP (r g > 0.70) typically being high (Manzanilla-Pech et al., Reference Manzanilla-Pech, Lovendahl, Gordo, Difford, Pryce, Schenkel, Wegmann, Miglior, Chud, Moate, Williams, Richardson, Stothard and Lassen2021; van Breukelen et al., Reference van Breukelen, Aldridge, Veerkamp, Koning, Sebek and de Haas2023). To harmonise data across diverse international populations, GSMet has been developed, accounting for country-specific genetic variances while maintaining consistency across production traits (Manzanilla-Pech et al., Reference Manzanilla-Pech, Lovendahl, Gordo, Difford, Pryce, Schenkel, Wegmann, Miglior, Chud, Moate, Williams, Richardson, Stothard and Lassen2021). However, the method of estimation significantly influences the genetic structure of these traits. Predictive models, such as that of Madsen et al. (Reference Madsen, Bjerg, Hvelplund, Weisbjerg and Lund2010), may introduce structural and sometimes artificial correlations among MeP, production traits and BW (Pszczola et al., Reference Pszczola, Rzewuska, Mucha and Strabel2017; Olijhoek et al., Reference Olijhoek, Difford, Lund and Lovendahl2020). Specifically, when MeP is derived as a function of milk yield and the CH4/CO2 ratio, the resulting MeI becomes mathematically redundant; milk yield serves as a linear predictor in both the numerator and the denominator, effectively cancelling its biological impact and rendering MeI proportional primarily to the breath ratio (Lassen and Lovendahl, Reference Lassen and Lovendahl2016).
Beyond mathematical artefacts, the relationship between methane and animal physiology is underpinned by specific biological trade-offs. MeC is positively associated with MBW (r g = 0.38; López-Paredes et al., Reference López-Paredes, Goiri, Atxaerandio, García-rodríguez, Ugarte, Jiménez-Montero, Alenda and González-Recio2020), reflecting the higher maintenance requirements of larger individuals, while its negative correlation with rumination time (r g up to −0.53; Zetouni et al., Reference Zetouni, Difford, Lassen, Byskov, Norberg and Lovendahl2018a) indicates that increased mastication and smaller particle size may shift rumen fermentation towards lower acetate-to-propionate ratios, thereby mitigating emissions per unit of fermented organic matter. Given these strong associations between absolute CH4 emissions and animal size, residual CH4 traits – adjusted for BW, MBW or ECM – exhibit a distinct genetic profile. These residual traits display near-zero genetic correlations with body size (r g = −0.16 to 0.15) and weak genetic associations with DMI, while maintaining positive genetic correlations with RFI (Lassen and Lovendahl, Reference Lassen and Lovendahl2016; Manzanilla-Pech et al., Reference Manzanilla-Pech, Lovendahl, Gordo, Difford, Pryce, Schenkel, Wegmann, Miglior, Chud, Moate, Williams, Richardson, Stothard and Lassen2021, Reference Manzanilla-Pech, Stephansen, Difford, Lovendahl and Lassen2022b). This specific genetic correlation structure forms the biological basis for decoupling emission reductions from intake capacity, highlighting the necessity for precise trait definition when integrating these parameters into genetic evaluations.
Implications for breeding programmes
Genetic mitigation of enteric CH₄ emissions in dairy cattle can be conceptualised as a multi-stage process linking phenotype definition, measurement technology, genetic evaluation and breeding programme implementation. The trait used to represent CH₄ emissions – such as MeP, MeY, MeI or residual methane – determines the biological pathway through which selection operates and the extent to which emissions can be reduced independently of productivity. The accuracy and scalability of phenotyping methods, including respiration chambers, GreenFeed systems, automated sniffer technologies and milk MIR predictions, influence the reliability of estimated genetic parameters and the feasibility of building large reference populations. Genetic correlations with production, feed efficiency, fertility and health traits further determine the potential for favourable or antagonistic correlated responses. Genomic prediction models then translate phenotypic data into estimated breeding values that enable selection in large populations with limited methane measurements. Finally, the integration of methane traits into multi-trait selection indexes and national breeding objectives determines the realised rate of genetic progress. Within this framework, advances in phenotyping technologies, international data sharing and improved understanding of host–rumen biological interactions will be essential for enabling effective and sustainable genetic mitigation of methane emissions.
The evidence compiled in this review demonstrates substantial genetic variation for methane emission traits in global dairy cattle populations. Moderate heritability estimates ranging from 0.10 to 0.45 across traits and measurement systems indicate that genetic selection for reduced methane emissions is biologically feasible. These estimates are broadly comparable to those reported for several functional traits currently included in dairy breeding programmes. However, despite the encouraging magnitude of genetic variation, important uncertainties remain regarding the long-term realised response to selection and the potential for unintended correlated responses affecting productivity, health or efficiency traits.
The definition of the methane trait used for selection strongly influences expected genetic responses. Daily MeP is positively genetically correlated with milk yield (r g = 0.29–0.57) (Breider et al., Reference Breider, Wall and Garnsworthy2019; Manzanilla-Pech et al., Reference Manzanilla-Pech, Lovendahl, Gordo, Difford, Pryce, Schenkel, Wegmann, Miglior, Chud, Moate, Williams, Richardson, Stothard and Lassen2021), meaning that direct selection to reduce absolute methane emissions may conflict with productivity goals if not appropriately balanced. In contrast, MeI, defined as methane emissions per unit of milk produced, is negatively correlated with milk yield (r = −0.13 to −0.73) (Kandel et al., Reference Kandel, Vanrobays, Vanlierde, Dehareng, Froidmont, Gengler and Soyeurt2017; Hossein-Zadeh, Reference Hossein-Zadeh2022), suggesting that improvements in productivity can simultaneously improve emissions efficiency.
However, ratio traits such as MeY and MeI present additional challenges because they combine multiple biological components and may therefore introduce statistical bias when used directly as selection criteria (Lovendahl et al., Reference Lovendahl, Difford, Li, Chagunda, Huhtanen, Lidauer, Lassen and Lund2018; Breider et al., Reference Breider, Wall and Garnsworthy2019; Manzanilla-Pech et al., Reference Manzanilla-Pech, Stephansen, Difford, Lovendahl and Lassen2022b). Genetic changes in MeY, for example, may reflect alterations in MeP, feed intake or both (de Haas et al., Reference de Haas, Veerkamp, de Jong and Aldridge2021; Manzanilla-Pech et al., Reference Manzanilla-Pech, Lovendahl, Gordo, Difford, Pryce, Schenkel, Wegmann, Miglior, Chud, Moate, Williams, Richardson, Stothard and Lassen2021), complicating biological interpretation. MeI is widely used to evaluate the environmental efficiency of milk production (Richardson et al., Reference Richardson, Amer, Hely, van den Berg and Pryce2021a, Reference Richardson, Crowley and Amer2023), but reductions are often driven primarily by increased milk yield rather than true decreases in methane emissions (Fresco et al., Reference Fresco, Boichard, Fritz, Lefebvre, Barbey, Gaborit and Martin2023). The strong negative genetic correlation between MeI and ECM suggests that poorly balanced selection on this trait could inadvertently constrain milk production (Manzanilla-Pech et al., Reference Manzanilla-Pech, Lovendahl, Gordo, Difford, Pryce, Schenkel, Wegmann, Miglior, Chud, Moate, Williams, Richardson, Stothard and Lassen2021).
Residual methane traits adjusted for milk production and BW have therefore been proposed as more biologically meaningful alternatives because they aim to isolate variation in methane emissions that is independent of production level. However, different adjustment models can produce varying heritability estimates (Manzanilla-Pech et al., Reference Manzanilla-Pech, Lovendahl, Gordo, Difford, Pryce, Schenkel, Wegmann, Miglior, Chud, Moate, Williams, Richardson, Stothard and Lassen2021; Richardson et al., Reference Richardson, Crowley and Amer2023) and may capture different underlying biological mechanisms. Consequently, the choice of trait definition fundamentally shapes both the rate of genetic progress and the biological characteristics of animals selected.
The accuracy and scalability of methane phenotyping methods also play a central role in determining the reliability of genetic evaluations. Respiration chambers remain the gold standard for direct measurement of methane emissions (Garnsworthy et al., Reference Garnsworthy, Difford, Bell, Bayat, Huhtanen, Kuhla, Lassen, Peiren, Pszczola, Sorg, Visker and Yan2019), but their cost and logistical complexity limit their application to relatively small research populations. GreenFeed systems provide an alternative for measuring MeP under semi-commercial conditions and have demonstrated high genetic correlations with other measurement systems. Sniffer technologies integrated into AMSs offer a high-throughput approach for measuring MeC in breath, allowing large numbers of animals to be phenotyped under commercial conditions.
Indirect approaches such as milk MIR predictions provide another scalable phenotyping strategy. MIR-based methane predictions have demonstrated moderate predictive accuracy (R2 = 0.68–0.79) (Negussie et al., Reference Negussie, de Haas, Dehareng, Dewhurst, Dijkstra, Gengler, Morgavi, Soyeurt, van Gastelen, Yan and Biscarini2017) but require further validation against direct methane measurements. Differences in heritability estimates between measurement methods – where MIR-based traits often show higher heritability estimates (0.24–0.45) (Fresco et al., Reference Fresco, Boichard, Fritz and Martin2024) than sniffer-based measurements (0.11–0.21) (van Engelen et al., Reference van Engelen, Bovenhuis, van der Tol and Visker2018; López-Paredes et al., Reference López-Paredes, Goiri, Atxaerandio, García-rodríguez, Ugarte, Jiménez-Montero, Alenda and González-Recio2020) – raise questions about how accurately each phenotype reflects true genetic differences in methane emissions. These discrepancies highlight the importance of accounting for measurement error and carefully weighting heterogeneous phenotypic data when combining records across measurement platforms.
To address concerns regarding the reliability of indirect measurements, recent technical reports from the ICAR Feed and Gas Working Group (2025) have provided critical validation; they demonstrate that when environmental variance is rigorously partitioned, sniffer-derived phenotypes exhibit high genetic correlations (r g = 0.71–0.76) with gold-standard measurements from respiration chambers and GreenFeed systems. This suggests that while individual heritability estimates may be lower due to environmental noise, the underlying genetic signal captured by sniffers remains highly representative of true MeP (Stephansen et al., Reference Stephansen, van Breukelen, Almasi, González-Recio, Teran, Milkevych, Miglior, Baes, Bakke, Benzoni, Finocchiaro, Frizzarin, Krattenmacher, Lassen, Pryce, Richardson and Gredler-Grandl2025).
The CH₄/CO₂ ratio measured using high-throughput sniffer systems has also been proposed as an indicator for identifying low-emitting animals (van Breukelen et al., Reference van Breukelen, Aldridge, Veerkamp, Koning, Sebek and de Haas2023; Uemoto et al., Reference Uemoto, Tomaru, Masuda, Uchisawa, Hashiba, Nishikawa, Suzuki, Kojima, Suzuki and Terada2024). Although a lower ratio may reflect differences in digestive efficiency or rumen microbial composition (Zetouni et al., Reference Zetouni, Kargo, Norberg and Lassen2018b), this metric is influenced by variation in feed intake, energy metabolism and air mixing within barns. Its relatively low heritability further suggests that a large number of repeated observations would be required for an accurate genetic evaluation (van Breukelen et al., Reference van Breukelen, Aldridge, Veerkamp and de Haas2022).
Population- and system-specific factors further complicate the extrapolation of genetic parameters across production environments. Heritability estimates vary both within and between countries and are influenced by diet composition, management systems and stage of lactation. For example, MeP heritability in Danish Holsteins ranged from 0.11 to 0.49 depending on days in milk (Manzanilla-Pech et al., Reference Manzanilla-Pech, Difford, Lovendahl, Stephansen and Lassen2022a). Genetic correlations between methane emissions and DMI also differed markedly between Danish (r g = 0.60) and Dutch (r g = −0.09) Holstein populations (Difford et al., Reference Difford, Lovendahl, Veerkamp, Bovenhuis, Visker, Lassen and de Haas2020), suggesting substantial within- and across-country genotype-by-environment interactions that remain poorly characterised. Differences between pasture-based and confinement systems may further modify genetic relationships due to variation in diet structure, feeding behaviour and environmental conditions.
Efforts to harmonise methane phenotypes across countries include the development of GSMet, which accounts for country-specific genetic variances when combining data across populations. However, GSMet is highly correlated with MeP and may therefore lead to similar selection outcomes (Manzanilla-Pech et al., Reference Manzanilla-Pech, Lovendahl, Gordo, Difford, Pryce, Schenkel, Wegmann, Miglior, Chud, Moate, Williams, Richardson, Stothard and Lassen2021). Its usefulness will ultimately depend on national breeding objectives and the extent of international collaboration in building shared reference populations.
The biological mechanisms linking host genetics to methane emissions remain poorly understood. Most studies have focused on estimating genetic parameters rather than investigating the physiological pathways underlying MeP. The moderate correlation between organic matter digestibility and MeY (r g = 0.62) (Guinguina et al., Reference Guinguina, Yan, Lund, Bayat, Hellwing and Huhtanen2020) suggests a potential trade-off between digestive efficiency and methanogenesis, but the genetic basis of this relationship remains unclear. Without improved mechanistic understanding, selection programmes risk reducing methane emissions through pathways that could inadvertently compromise rumen function, fibre digestion or nutrient utilisation.
Correlated responses to selection present both opportunities and risks. Favourable genetic correlations between RFI and methane emissions (r g = 0.18–0.84) (de Haas et al., Reference de Haas, Windig, Calus, Dijkstra, de Haan, Bannink and Veerkamp2011) suggest that ongoing selection for improved feed efficiency may already contribute to methane mitigation. However, selection for lower RFI may also reduce feed intake, potentially exacerbating negative energy balance and increasing body tissue mobilisation in lactating cows (Lassen and Lovendahl, Reference Lassen and Lovendahl2016). In addition, reduced methane emissions may be associated with decreased fibre digestibility (Guinguina et al., Reference Guinguina, Yan, Lund, Bayat, Hellwing and Huhtanen2020), which could complicate simultaneous improvement of feed efficiency and rumen function.
Genetic correlations between rumination behaviour and methane emissions are inconsistent (r g = −0.53 to −0.08) (Zetouni et al., Reference Zetouni, Difford, Lassen, Byskov, Norberg and Lovendahl2018a; Lopes et al., Reference Lopes, Schenkel, Houlahan, Rochus, Oliveira, Oliveira, Miglior, Alcantara, Tulpan and Baes2024), indicating that rumination time is unlikely to serve as a reliable indirect indicator of methane emissions. Relationships between methane traits and fertility or health traits appear generally weak (Yin et al., Reference Yin, Pinent, Brügemann, Simianer and König2015; Zetouni et al., Reference Zetouni, Kargo, Norberg and Lassen2018b), suggesting limited antagonistic effects. Nevertheless, direct selection against MeP has been associated with reductions in milk yield and milk composition traits due to positive genetic correlations between methane output and productivity (Ghiasi et al., Reference Ghiasi, Sitkowska, Piwczyński and Kolenda2022). Many of these estimates are derived from relatively small datasets with large standard errors, emphasising the need for long-term selection experiments to clarify correlated responses.
A major limitation across the literature is the lack of empirical validation of genomic predictions. Few studies have evaluated whether estimated breeding values for methane traits accurately predict methane emissions in independent populations or future generations. Most projections of breeding programme outcomes rely on simulation models using assumed genetic parameters rather than realised genetic gains. Moreover, several reported genetic correlations have large standard errors (Richardson et al., Reference Richardson, Nguyen, Abdelsayed, Moate, Williams, Chud, Schenkel, Goddard, van den Berg, Cocks, Marett, Wales and Pryce2021c; Lopes et al., Reference Lopes, Schenkel, Houlahan, Rochus, Oliveira, Oliveira, Miglior, Alcantara, Tulpan and Baes2024), indicating substantial uncertainty in current estimates. Without robust validation datasets, it remains unclear whether current genetic evaluation systems can reliably identify low-methane animals.
Implementation of methane traits in breeding programmes also raises economic and logistical challenges. Phenotyping costs remain substantial, with estimates suggesting that 15,000–25,000 phenotyped animals may be required to achieve sufficient genomic prediction accuracy (de Haas et al., Reference de Haas, Veerkamp, de Jong and Aldridge2021). The economic value assigned to methane reduction is also highly dependent on future policy scenarios and carbon pricing frameworks (Manzanilla-Pech et al., Reference Manzanilla-Pech, Stephansen, Difford, Lovendahl and Lassen2022b). Balanced breeding indexes indicate that methane mitigation can potentially be achieved without major losses in productivity or functional traits (Richardson et al., Reference Richardson, Crowley and Amer2023), but continued economic evaluation will be necessary as environmental policies evolve. The development of scalable and cost-effective phenotyping methods, including improved MIR predictions and validated sniffer technologies, will be critical for widespread implementation.
Finally, the time horizon for achieving substantial methane reductions through genetic selection alone is likely to span several decades. Even optimistic projections suggest that 10–30 years may be required to achieve reductions of approximately 20–25% in MeI (González-Recio et al., Reference González-Recio, López-Paredes, Ouatahar, Charfeddine, Ugarte, Alenda and Jiménez-Montero2020; Lassen and Difford, Reference Lassen and Difford2020; de Haas et al., Reference de Haas, Veerkamp, de Jong and Aldridge2021). Although genetic gain accumulates slowly, its effects are permanent and cumulative across generations. As a result, genetic selection represents an important long-term mitigation strategy that should complement, rather than replace, nutritional and management interventions aimed at reducing methane emissions.
Overall, the literature indicates that genetic selection for reduced enteric methane emissions in dairy cattle is biologically feasible, supported by moderate heritability estimates and measurable genetic variation across populations. However, progress remains constrained by inconsistent trait definitions, limitations in large-scale phenotyping and the absence of robust validation of genomic predictions. Future advances will depend on the development of scalable measurement technologies, harmonised trait definitions and large international reference populations that support accurate genomic evaluation. At the same time, methane traits must be incorporated into balanced multi-trait breeding objectives to ensure that improvements in environmental sustainability do not compromise productivity, fertility or animal health. Although genetic selection alone is unlikely to deliver rapid short-term emission reductions, its cumulative and permanent nature makes it a critical component of long-term climate mitigation strategies in dairy production.
Future directions in genetic selection for methane reduction
Future prospects for CH4-related traits in dairy cattle breeding are promising and essential for improving sustainability (Axelsson et al., Reference Axelsson, Fikse, Kargo, Sorensen, Johansson and Rydhmer2013; Richardson et al., Reference Richardson, Crowley and Amer2023). Given the substantial environmental impact of enteric CH4, genetic selection is being explored as a long-term mitigation tool (van Engelen et al., Reference van Engelen, Bovenhuis, Dijkstra, van Arendonk and Visker2015; Lassen and Difford, Reference Lassen and Difford2020). Several developments are shaping the future of CH₄-related selection indexes. First, breeding objectives are evolving to explicitly include environmental sustainability, with an increasing emphasis on reducing CH4 emissions (Yin et al., Reference Yin, Pinent, Brügemann, Simianer and König2015; Richardson et al., Reference Richardson, Baes, Amer, Quinton, Hely, Osborne, Pryce, Hailemariam and Miglior2021b). CH4 traits can be integrated into total merit indices using multi-trait models that balance emission reductions with productivity goals (de Haas et al., Reference de Haas, Windig, Calus, Dijkstra, de Haan, Bannink and Veerkamp2011; Richardson et al., Reference Richardson, Baes, Amer, Quinton, Martin, Osborne, Pryce and Miglior2020, Reference Richardson, Nguyen, Abdelsayed, Moate, Williams, Chud, Schenkel, Goddard, van den Berg, Cocks, Marett, Wales and Pryce2021c). Residual CH4 traits are preferred over ratio traits, as they allow more independent selection from milk yield and BW (Manzanilla-Pech et al., Reference Manzanilla-Pech, Lovendahl, Gordo, Difford, Pryce, Schenkel, Wegmann, Miglior, Chud, Moate, Williams, Richardson, Stothard and Lassen2021; van Breukelen et al., Reference van Breukelen, Aldridge, Veerkamp and de Haas2022).
Second, economic weights assigned to CH4 should reflect both environmental costs and potential policy incentives, such as emissions taxes or carbon credits, to support adoption of CH4 traits in breeding programmes (González-Recio et al., Reference González-Recio, López-Paredes, Ouatahar, Charfeddine, Ugarte, Alenda and Jiménez-Montero2020; Manzanilla-Pech et al., Reference Manzanilla-Pech, Stephansen, Difford, Lovendahl and Lassen2022b). Subindexes that combine CH4 with related traits such as feed efficiency may enhance selection efficiency.
Third, because direct CH₄ measurement at scale is challenging, proxy traits such as milk MIR spectra and breath measurements from AMS are being explored (Kandel et al., Reference Kandel, Gengler and Soyeurt2015; Pszczola et al., Reference Pszczola, Rzewuska, Mucha and Strabel2017; Richardson et al., Reference Richardson, Crowley and Amer2023). These technologies enable large-scale phenotyping necessary for genetic evaluation.
Fourth, combining genomic data with proxy traits increases prediction accuracy (Manzanilla-Pech et al., Reference Manzanilla-Pech, Gordo, Difford, Lovendahl and Lassen2020). Building large, international reference populations with harmonised trait definitions will be critical for implementing robust genomic selection for CH4 traits (Lassen and Difford, Reference Lassen and Difford2020).
Finally, continued progress relies on interdisciplinary research and innovation in cost-effective measurement technologies. International collaboration and policy alignment will be essential to achieving substantial, long-term reductions in livestock CH4 emissions (González-Recio et al., Reference González-Recio, López-Paredes, Ouatahar, Charfeddine, Ugarte, Alenda and Jiménez-Montero2020; Manzanilla-Pech et al., Reference Manzanilla-Pech, Lovendahl, Gordo, Difford, Pryce, Schenkel, Wegmann, Miglior, Chud, Moate, Williams, Richardson, Stothard and Lassen2021). The practical orchestration of these global efforts has been significantly bolstered by the release of the ICAR Animal Data Exchange 1.50 standard in late 2025. This updated protocol establishes a unified technical infrastructure for sensor data interoperability, enabling the scalable aggregation of methane records – collected by an increasing range of validated devices – from diverse equipment manufacturers into the large-scale international reference populations essential for robust genomic evaluation (ICAR, 2025).
Conclusions
Genetic selection offers a sustainable strategy for long-term mitigation of CH4 emissions. Multiple CH4-related traits – such as MeP, MeY, MeI, MeC, residual traits and the CH₄/CO₂ ratio – have been evaluated for potential inclusion in breeding programmes. Heritability estimates range from low to moderate, with residual traits and MeC emerging as practical priorities due to favourable genetic properties and measurement feasibility. Residual CH₄ traits are particularly valuable because they show low correlations with productivity traits and a positive correlation with feed efficiency. MeC, which can be recorded using AMS, is also gaining prominence, despite its sensitivity to management and system design. In contrast, ratio traits like MeY and the CH₄/CO₂ ratio have limited interpretability and lower genetic utility.
A major challenge is the high cost and logistical difficulty of direct CH₄ measurements in large populations, which restricts the availability of phenotypic data. Predictive equations are widely used but require validation against expanded direct measurement datasets. Evidence of genetic correlations between CH₄ and milk production traits suggests that correlated responses can complement direct phenotyping and strengthen selection indexes.
Future progress will depend on integrating CH4 traits into genomic selection, improving predictive equations, advancing sensor-based phenotyping and enhancing international collaboration to align breeding strategies with sustainability goals. Machine learning models are particularly promising for improving prediction accuracy and addressing limitations of conventional methods. Together, these developments position genetic selection as a key component of long-term strategies to reduce enteric CH₄ emissions while sustaining productivity in dairy systems.
Supplementary material
The supplementary material for this article can be found at https://doi.org/10.1017/S0022029926102519.
Acknowledgements
We extend our gratitude to the School of Agriculture and Food at University College Dublin for providing research facilities and platform support. Google NotebookLM was used as a supplementary tool for initial text categorisation and thematic clustering in the systematic review. During the revision process, ChatGPT (OpenAI) was used to improve the clarity, grammar and readability of selected paragraphs, and Elicit was used to support deeper interrogation and cross-referencing of relevant literature within predefined thematic areas. These tools were used solely to assist with literature handling and language refinement; they did not contribute to the study design, data analysis or interpretation of results. All outputs were critically reviewed and verified by the authors, who take full responsibility for the content of the manuscript.
Declaration of interest
Authors are not aware of any affiliations, memberships, funding or financial holdings that might be perceived as affecting the objectivity of this review.
Funding statement
This work was supported by funding programmes of the Beijing Academy of Agriculture and Forestry Sciences, including the International Cooperation Fund (GHPT2026-10) and the Science and Technology Innovation Project (KJCX20261201).
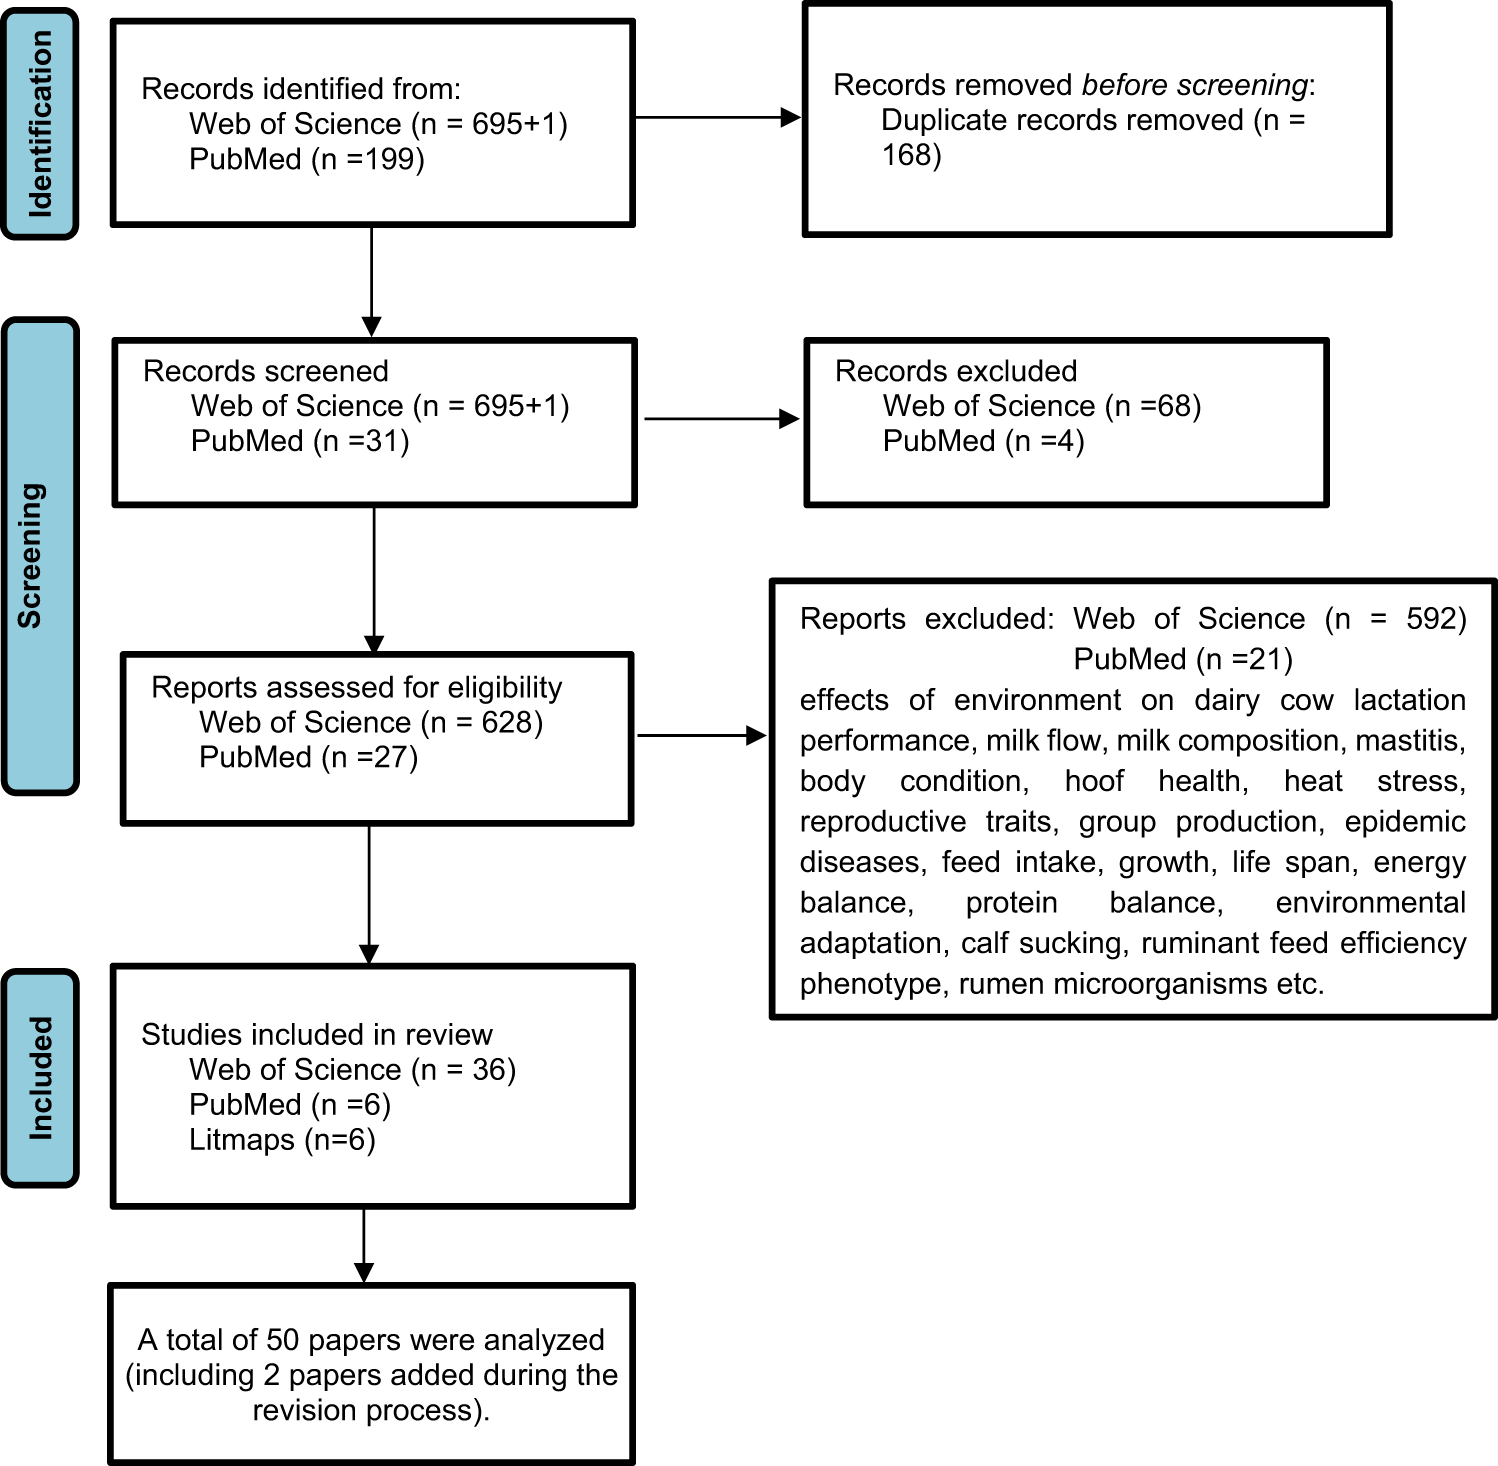


 Open access

