


Introduction
Populations of sharks, rays and their cartilaginous relatives (Class Chondricthyes) are experiencing major global declines. These declines are primarily a result of overfishing, driven in part by high demand for shark products such as fins and meat, as well as a general increase in global fishing pressure. It is estimated that one in three Chondrichthyan species is threatened with extinction (Dulvy et al., Reference Dulvy, Pacoureau, Rigby, Pollom, Jabado and Ebert2021), however, this figure is likely to be even higher within specific regions such as Southeast Asia, where intense fishing pressure persists (Clark-Shen et al., Reference Clark-Shen, Chin, Arunrugstichai, Labaja, Mizrahi, Simeon and Hutchinson2022). These declines threaten marine ecosystem balance, with an urgent need for improved conservation and management measures (Dedman et al., Reference Dedman, Moxley, Papastamatiou, Braccini, Caselle and Chapman2024). Many shark species are now listed in CITES Appendix II, which aims to ensure international trade in wildlife is sustainable and does not threaten the survival of species in the wild (CITES, 2021). However, populations continue to decline, highlighting the urgent need for action to halt this trend and promote recovery (Bustamante, Reference Bustamante2023).
Indonesia is the world’s largest shark fishing nation, making it a global priority for shark conservation efforts (Booth et al., Reference Booth, Muttaqin, Simeon, Ichsan, Siregar, Yulianto and Kassem2018; Prasetyo et al., Reference Prasetyo, McDevitt, Murray, Barry, Agung, Muttaqin and Mariani2021). Despite international trade regulations, threatened and CITES-listed species are still frequently caught and traded, underlining the need for strengthened compliance management, alongside complementary fisheries management measures. However, Indonesia’s fisheries are also vital for economic and social well-being, necessitating a pragmatic and data-driven approach that aligns conservation goals with fisheries and livelihood objectives (Booth et al., Reference Booth, Squires and Milner-Gulland2019a; Chin et al., Reference Chin, Molloy, Cameron, Day, Cramp and Gerhardt2023). Effective and pragmatic fisheries management relies on robust data to ensure that decisions are both sound and feasible, and to monitor implementation and inform adaptive management (Booth et al., Reference Booth, Squires and Milner-Gulland2019b; McClenachan et al., Reference McClenachan, Rick, Thurstan, Trant, Alagona and Alleway2024). Yet species-specific shark catch and trade data are lacking to support fisheries sustainability assessments, quotas and other management measures in Indonesia (Napitupulu et al., Reference Napitupulu, Tanaya Sitanggang, Ayostina, Andesta, Fitriana and Ayunda2022), which are necessary for complying with CITES regulations.
Within this context, this study used a mixed-methods approach to assess the current state of one of Indonesia’s largest shark fishing hubs at Muncar, East Java (Osmaleli et al., Reference Osmaleli, Adrianto, Kusumastanto, Yulianto, Salim, Rizka, Tawang, Larasati, Fadloli and Booth2024), and to make data-driven management recommendations. More specifically, we used a combination of spatial data (derived from GPS tracking and participatory mapping) and catch data to describe the state of the fishery, derive simple species-specific indicators of overfishing (with a focus on frequently captured threatened and CITES-listed species; Froese, Reference Froese2004) and explore temporal, operational and spatial patterns in catch data to identify trends. We anticipate our findings will be useful for informing local, national and international management measures for shark species that are threatened by overfishing and trade.
Study area
Our study was conducted in Muncar, Banyuwangi District, East Java Province, Indonesia (Fig. 1), with data collected at the Brak Fish Market (TPI Brak) and the Muncar Fishing Port. The sites were chosen because of their size and importance as fish markets and landing sites, based on the available literature, anecdotal information and preliminary field observations (Sjafrie et al., Reference Sjafrie, Oktaviyani and Kurniawan2020; Winter et al., Reference Winter, Rudianto, Laglbauer, Ender and Simpfendorfer2020).
Kernel density estimation of shark fishing ground use by 20 vessels in the Sea of Java and Makassar Strait, Indonesia, during January–December 2021. The map illustrates the intensity of fishing activity, derived from GPS tracking data and interviews with fishers. Shades represent different levels of utilization distribution (UD): Low corresponds to the 95% UD contour, delineating the overall extent of the fishing grounds and encompassing the broadest spatial range of fishing activity; Moderate represents the 75% UD contour, indicating areas with more frequent use; and High represents the 25% UD contour, signifying the most intensively utilized zones or fishing hotspots. The top inset map shows the location of the area shown on the main map; the bottom inset map shows an enlarged view of Lombok and Blongas, to highlight the specific regional breeding and aggregation areas (identified as an Important Shark and Ray Area/ISRA) that overlap with the fishing grounds of Muncar fishers.

Methods
Data collection
We used a combination of qualitative and quantitative methods to examine the operational and ecological characteristics of shark fishing in Muncar, East Java. To gain general insights into fishing practices and spatial patterns of fishing activity, we conducted interviews with key participants during August–October 2024, typically during 07.00–10.00 or 16.00–18.00. Using a semi-structured interview format (Supplementary Material 1), we engaged with the leader of the fisher community, seven boat captains and 42 experienced fishers at the Brak Fish Market (TPI Brak) and the Muncar Fishing Port. We also made direct observations at the landing sites to document the fishery’s operational characteristics, using field notes and cameras to record data (Mirhosseini, Reference Mirhosseini2020).
We identified the primary fishing grounds used for targeting sharks and estimated their intensity of use by collecting GPS tracking data from 20 fishing vessels known to engage in shark fishing from the Muncar fishing port. We collected data from six fishing trips during January–December 2021, with GPS locations recorded by fishers at 1 h intervals throughout each trip. We were able to distinguish between gear setting/hauling activities and active vessel movement by observing the rate of change of the GPS location.
To complement and triangulate the GPS data, we also conducted a participatory mapping exercise to examine fishers’ perceptions of locations in which sharks were caught and gain qualitative insights into which vessels operated in which areas. We conducted these exercises on the beach using printed topographic maps and invited small groups of two or three fishers to discuss and mark fishing areas. The exercise was designed to encourage fishers to actively share their experiences, insights and ideas to collaboratively create a map that reflected their understanding and connection to their fishing grounds (Cochrane & Corbett, Reference Cochrane and Corbett2020). Enumerators facilitated the discussions using a method proven to be effective for community mapping by encouraging open sharing amongst participants (Lydon, Reference Lydon2003).
Landing data were collected by trained local enumerators every morning during 06.00–10.00 (except for holidays). We collected data on all shark species during January 2023–December 2024. Additional time-series data were available for 2020 on scalloped hammerheads Sphyrna lewini from Mobula Project Indonesia (a local NGO in Muncar, Banyuwangi, East Java). Information included the total number of sharks caught of each species and the operational characteristics of the fishing trips during which they were caught (date, gear type). We also recorded biological parameters including species identity, total length, sex, and sexual maturity in males, whereby large, fully calcified claspers indicated sexual maturity (Dharmadi & Fahmi, Reference Dharmadi and Fahmi2006; Wanchana et al., Reference Wanchana, Bin Ali and Arnupapboon2016; Jaiteh et al., Reference Jaiteh, Hordyk, Braccini, Warren and Loneragan2017; Yulianto et al., Reference Yulianto, Booth, Ningtias, Kartawijaya and Santos2018; Booth et al., Reference Booth, Squires, Yulianto, Simeon, Muhsin and Milner-Gulland2021).
Description of the fishery grounds
We used descriptive statistics to provide an overview of the fishery and its operational characteristics, as well as the total numbers of sharks caught and their conservation and management status according to the IUCN Red List (IUCN, 2025) and CITES (2021).
We filtered the GPS data to identify the fishing grounds used in 2021 by including only the locations that appeared to be associated with gear setting and hauling activities (i.e. when the GPS location remained stable over several hours). We performed a kernel density estimation on the filtered GPS locations to estimate the utilization distribution of the fishing grounds (Srikanth & Srikanth, Reference Srikanth and Srikanth2020) using the adehabitatHR package in R 4.5.2 (R Core Team, 2025) and ArcGIS 10.8 Spatial Analyst tools (Esri, 2022) with a Gaussian kernel and a reference bandwidth of ‘h_ref’. We categorized fishing intensity based on utilization distribution contours derived from the spatial analysis of vessel tracking data. We defined four distinct categories to represent varying intensities of spatial use: ‘Low’ corresponded to the 95% utilization distribution contour, delineating the overall extent of the fishing grounds and encompassing the broadest spatial range of fishing activity; ‘Moderate’ represented the 75% utilization distribution contour, indicating areas with more frequent use; and ‘High’ reflected the 25% utilization distribution contour, signifying the most intensively utilized zones or core fishing hotspots. These categorizations illustrate the gradient of fishing pressure, with higher categories denoting greater spatial concentration and frequency of shark fishing activity by local fishers. We triangulated the spatial data with information from participatory mapping to understand the different types of fishing activities that occurred in various areas and the fishers’ perceptions of the ecological conditions in different locations.
Size- and maturity-based sustainability assessments
We conducted a simple sustainability assessment of five priority species using size-based indicators. We defined priority species as those that are threatened, CITES-listed and frequently caught in Muncar. We used length-frequency distributions to assess the proportion of mature length (L m ), optimal length (L o ) and maximum length (L max ) individuals in the catch, whereby fisheries should ideally aim for zero L max and 100% mature and optimum length fish to prevent overfishing (Froese, Reference Froese2004). We also explored temporal trends in the lengths of captured individuals, which can indicate the risk of growth overfishing (Shin et al., Reference Shin, Rochet, Jennings, Field and Gislason2005; Cope & Punt, Reference Cope and Punt2009; Leitão, Reference Leitão2019).
We conducted in-depth, length-based population sustainability analyses for the scalloped hammerhead, which is categorized as Critically Endangered on the IUCN Red List (Rigby et al., Reference Rigby, Dulvy, Barreto, Carlson, Fernando and Fordham2019b), is frequently caught in Muncar and is therefore a high priority for management. We estimated length at first capture (L c ; Equation 1) and length at first maturity (L m ; Equations 2–3) for male and female individuals, and compared these values to assess the proportion of captured sharks that were sexually mature.
Length at first capture was estimated using a logistic selectivity model (Sparre & Venema, Reference Sparre and Venema1998):
 $S\left( L\right) = {1 \over {1 + ex{p^{\left( {a - bL} \right)}}}}$
where S(L) is the probability of capture at length L, L is the midpoint of each length class, and a and b are model parameters. The length at first capture (L c ) corresponds to the length at which S(L) = 0.5, and is calculated as:
 ${L_c} = {a \over b}$
We used the size at first gonadal maturity to determine the minimum appropriate size for shark capture, ensuring that individuals have had the opportunity to spawn at least once before being caught. We estimated length first gonadal maturity using the Spearman–Kärber method (Udupa, Reference Udupa1986 in Hasanah et al., Reference Hasanah, Restiangsih and Nurdin2019):
 ${{m}}\;{\rm{ = }}\;x_{{k}}\;{{ + }}{x \over 2} - x\sum {{{P_i}}}$
where m is the logarithm of length at first maturity, x k is the logarithm of the midpoint of the final length class containing mature individuals, x is the constant interval between the logarithms of successive length class midpoints, and P i is the proportion of mature individuals in the i-th length class.
Length at first maturity (Lm ) and its 95% confidence interval were then calculated as:
 ${{{L}_{\it m}}}\;{\rm{ = }}\;{\rm{antilog}}\left[ {{{m}}\pm {\rm{1}},{\rm{96}}\sqrt {{x^2}\left( {{{{{PiQi}}} \over {{{N_i}}{\rm{-}}{\rm{1}}}}} \right)} } \right]$
where Q i = 1 − P i , and N i is the number of individuals in the i-th length class.
Predictors of scalloped hammerhead catches
We focused on scalloped hammerheads to explore possible predictors of the likelihood of catching this species and to identify significant operational variables that could be used to inform fisheries management. We constructed a simple logistic regression model using R Studio 4.3.2 (RStudio Team, 2023), with hammerhead catches per vessel day (Yes/No) as a binary response variable and month, year and vessel type as explanatory variables. We then checked the outputs of the model to identify statistically significant predictors and the direction of the coefficients, following Yulianto et al. (Reference Yulianto, Booth, Ningtias, Kartawijaya and Santos2018).
Results
Overview of the fishery
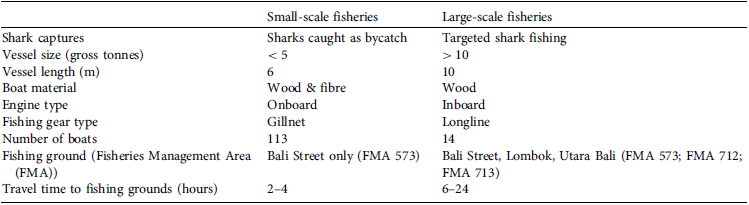
We recorded 127 fishing vessels operating from Muncar, all of which frequently captured sharks either as target catch or valuable bycatch. The vessels varied in size and capacity; however, all of them were below 30 gross tonnes (GT), which means they are considered small-scale vessels and fall under local-level management and licensing rules. Of the 127 vessels, 113 were smaller (< 5 GT) and primarily used gillnets to target tuna Euthynnus spp., marlin Makaira spp. and ribbonfish Trichiurus spp., with sharks caught as valuable bycatch. The remaining 14 fishing vessels were > 10 GT in capacity and specialized in shark fishing using longlines. However, these vessels also targeted other fish species during January–April (the off-season for sharks). The larger longline vessels spent more time at sea than the smaller ones and operated beyond the Bali Strait, primarily in waters around East Java, Lombok, the Bali Sea and Makassar Strait. In contrast, the smaller gillnet vessels were equipped with smaller engines and tended to operate within the Bali Strait, conducting shorter fishing trips (Table 1).
Characteristics of the vessels used by small- and large-scale fisheries in Muncar, Indonesia.

Table 1. Long description
The image presents a summary table comparing nine operational and technical characteristics between small-scale and large-scale fisheries in Indonesia. In terms of fishing purpose and capacity, small-scale fisheries capture sharks primarily as unintended bycatch, utilizing a fleet of 113 smaller vessels that are 6 meters long, under 5 gross tonnes, and constructed from wood and fiber with onboard engines. Conversely, large-scale fisheries engage in targeted shark fishing using a much smaller fleet of 14 larger wooden vessels, which measure 10 meters long, exceed 10 gross tonnes, and are equipped with inboard engines. Regarding operations and gear, small-scale operations deploy gillnets and focus exclusively on the Bali Strait within Fisheries Management Area (FMA) 573, requiring a short travel time of 2 to 4 hours to reach their fishing grounds. In contrast, large-scale operations utilize longline gear across a much broader geographic range—spanning the Bali Strait, Lombok, and Utara Bali across FMAs 573, 712, and 713—resulting in significantly longer travel times ranging from 6 to 24 hours.
Fishing grounds
The spatial analysis revealed two main hotspots of shark fishing activity in the nearshore waters north of Bali and in an offshore fishing ground close to the Makassar Strait (Fig. 1). Participatory mapping revealed that vessels targeting sharks primarily operated in the Makassar Strait, whereas gillnet vessels captured sharks exclusively in the Bali Strait. These areas were frequently visited by fishers, and, according to those interviewed, were areas of higher shark abundance.
Catch composition
Shark catches in Muncar during 2023–2024 were dominated by threatened and CITES-listed species (Table 2, Fig. 2; CITES, 2021). Overall, 50% of the total catch comprised sharks that are categorized as threatened on the IUCN Red List (i.e. Vulnerable, Endangered or Critically Endangered; IUCN, 2025) and 33% of the total catch was composed of CITES-listed species (Fig. 2).
The catch size (number of individual sharks caught) and percentage of the total catch of sharks caught in Muncar, Indonesia, during 2023–2024.

Table 2. Long description
The table details shark catch data by species, along with their respective conservation and regulatory statuses. The most frequently caught species is the silky shark (Carcharhinus falciformis), classified as Vulnerable (VU) on the IUCN Red List, with 419 individuals caught, representing 12.2% of the total catch. The scalloped hammerhead (Sphyrna lewini), listed as Critically Endangered (CR), accounts for 401 individuals or 11.7% of the total. This is followed by the spinner shark (Carcharhinus brevipinna) with 327 individuals (9.5%), the blacktip reef shark (Carcharhinus melanopterus) with 292 individuals (8.5%), and the pelagic thresher shark (Alopias pelagicus), listed as Endangered (EN), with 287 individuals (8.3%). All five specifically listed species are Vulnerable or higher on the IUCN Red List and are included under CITES Appendix II. Finally, a collective category of "Other shark species," comprising 46 distinct species, accounts for the remaining 1,713 individuals (49.8% of the total catch), with various IUCN conservation statuses and listed as CITES Unlisted.
1 VU, Vulnerable; EN, Endangered; CR, Critically Endangered.
2 Source: unpublished landing data from Mobula Indonesia, Banyuwangi, East Java.
Numbers of elasmobranchs recorded in fish catches in Muncar during 2023–2024 by (a) genus and CITES status (Appendix II or Not evaluated; CITES, 2025), and (b) IUCN Red List category (IUCN, 2025).

Size- and maturity-based sustainability assessments
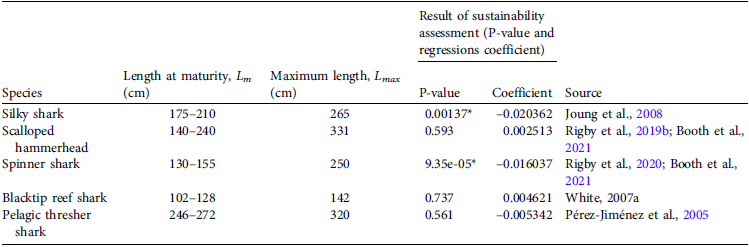
The length-based analysis revealed that shark catches in Muncar were dominated by small and immature individuals, particularly for the silky shark Carcharhinus falciformis, spinner shark Carcharhinus brevipinna, pelagic thresher shark Alopias pelagicus and blacktip reef shark Carcharhinus melanopterus (Fig. 3). Approximately half of the scalloped hammerhead sharks caught exceeded length at maturity (L m ). We observed statistically significant negative trends in catch size (TL, total length of the sharks caught) over the 2 years for silky and spinner sharks. No statistically significant size trends were detected for the other species (Table 3, Fig. 3).
Length-frequency and temporal trends for five priority species that are threatened, CITES-listed and frequently captured: (a) scalloped hammerhead Sphyrna lewini (n = 401), (b) silky shark Carcharhinus falciformis (n = 419), (c) spinner shark Carcharhinus brevipinna (n = 327), (d) blacktip reef shark Carcharhinus melanopterus (n = 292) and (d) pelagic thresher shark Alopias pelagicus (n = 287). The shaded areas represent the range of possible length at first maturity (L m ) where different values for males and females were available from the literature. The dashed lines denote the maximum length (L max ).

Summary of size-based assessments and sustainability assessment results. The sustainability assessments for the silky shark and spinner shark (indicated with asterisks) were significant. Statistically significant findings (P < 0.05) for both silky and spinner sharks demonstrate a pronounced deviation from Froese’s (Reference Froese2004) size-indicator sustainability thresholds. These results underscore that both species are susceptible to, or actively undergoing, growth overfishing (individuals are harvested prior to reaching optimal growth biomass) and/or recruitment overfishing (catch predominantly composed of juveniles below their respective Lm ).

Table 3. Long description
This table presents maturity lengths (Lm), maximum lengths (L{max}), and sustainability assessment results for five shark species. The silky shark (Lm: 175–210 cm, L{max}: 265 cm) shows a statistically significant negative trend (coefficient: -0.020362, P = 0.00137*; Joung et al., 2008). The scalloped hammerhead (Lm: 140–240 cm, L{max}: 331 cm) shows a non-significant positive trend (coefficient: 0.002513, P = 0.593; Rigby et al., 2019b; Booth et al., 2021). The spinner shark (Lm: 130–155 cm, L{max}: 250 cm) also displays a significant negative trend (coefficient: -0.016037, P = 9.35 ⤬ 10^{-5}*; Rigby et al., 2020; Booth et al., 2021). The blacktip reef shark (Lm: 102–128 cm, L{max}: 142 cm) has a non-significant positive trend (coefficient: 0.004621, P = 0.737; White, 2007a). The pelagic thresher shark (Lm: 246–272 cm, L{max}: 320 cm) shows a non-significant negative trend (coefficient: -0.005342, P = 0.561; Pérez-Jiménez et al., 2005).
* P < 0.05.
Our analysis of length at first capture (L c ) and length at maturity (L m ) curves for scalloped hammerheads showed that the length at first capture, corresponding to a 50% probability of capture, was 157.2 cm for females and 146.5 cm for males caught with longlines (Fig. 4a), and 120.3 cm for females and 128.2 cm for males caught by gillnet (Fig. 4b). Length at first capture for males was shorter than length at maturity, indicating that individuals were typically captured before reaching sexual maturity.
Length at first capture (L c ) and length at first maturity (L m ) of scalloped hammerheads caught with (a) longlines and (b) gillnets. Length at first maturity (L m ) is shown for males only, as maturity data were not available for females. Solid curves represent logistic fits for capture probability (L c ) and maturity (L m ). Horizontal dashed lines indicate 50% probability, and vertical dashed lines indicate the corresponding lengths at 50% capture (L c ) and 50% maturity (L m ). Landing data from 2020–2024 (source: Mobula Indonesia).

Predictors of scalloped hammerhead catches
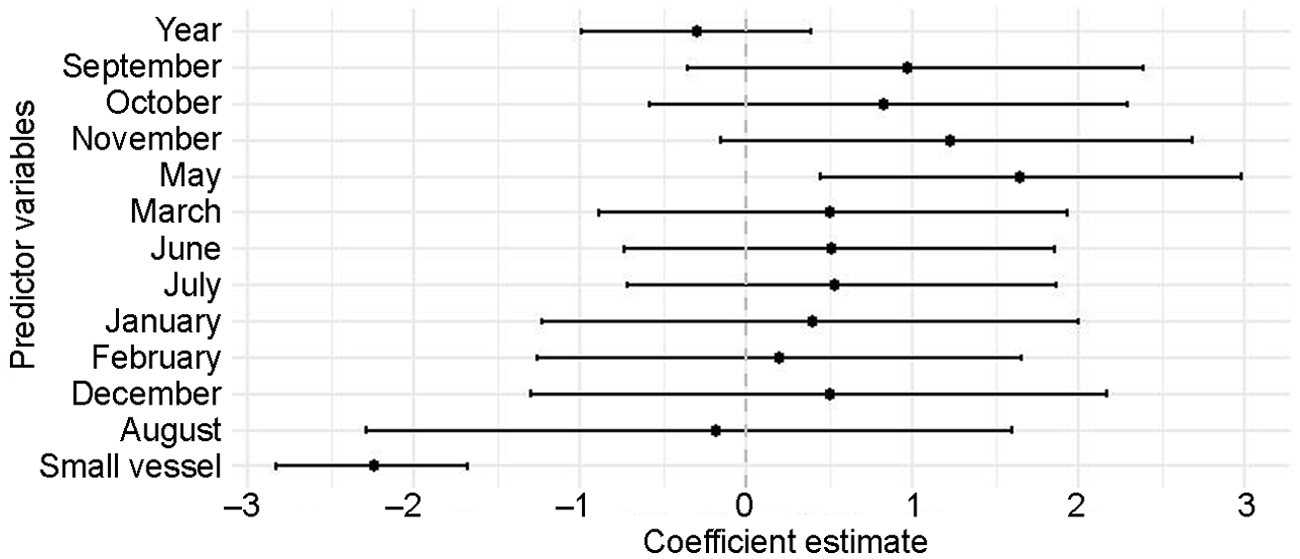
The logistic regression model indicated that both the time of year (May) and the type of fishing vessel were statistically significant predictors of the likelihood of catching ≥ 1 scalloped hammerheads (P < 0.05). Specifically, the model yielded a positive coefficient for May (1.6495, P = 0.00976) relative to April as the reference month, suggesting that the probability of catching scalloped hammerheads was significantly higher during May compared to other months. In contrast, smaller vessels had a negative coefficient (−2.2380, P = 2.22 × 10⁻¹⁴) relative to larger vessels, indicating that they were significantly less likely to catch scalloped hammerheads than larger vessels (Fig. 5).
Predictors of catching one or more scalloped hammerheads identified by the logistic regression model at P < 0.05 from input variables month and vessel size in Muncar, Banyuwangi, Indonesia (source: Mobula Indonesia).

Discussion
Our analysis of shark catch data for the fisheries operating from Muncar, Indonesia, revealed a concerning trend, with over two-thirds of catches made up of threatened species and 16% of catches composed of the Critically Endangered scalloped hammerhead shark. The top five species caught were silky sharks, scalloped hammerheads, spinner sharks, blacktip reef sharks and pelagic thresher sharks, all of which are categorized as threatened on the IUCN Red List (Rigby et al., Reference Rigby, Barreto, Carlson, Fernando, Fordham and Francis2019a,b, Reference Rigby, Carlson, Smart, Pacoureau, Herman, Derrick and Brown2020, Reference Rigby, Sherman, Chin and Simpfendorfer2021; Simpfendorfer et al., Reference Simpfendorfer, Yuneni, Tanay, Seyha, Haque and Fahmi2020). They are also listed in Appendix II of CITES, which calls for measures to ensure that international trade does not threaten the survival of species in the wild (CITES, 2021). The fact that these species collectively comprised 68% of the total catch indicates that there is ongoing exploitation of threatened shark populations. Our observations are consistent with findings from past studies on fisheries in Muncar and similar studies on fisheries in East Lombok, which share fishing grounds with Muncar fishers (Yulianto et al., Reference Yulianto, Booth, Ningtias, Kartawijaya and Santos2018; Booth et al., Reference Booth, Powell, Yulianto, Simeon, Muhsin and Milner-Gulland2022). Our data from August 2017–March 2018 included many records of threatened species of sharks and rays (Winter et al., Reference Winter, Rudianto, Laglbauer, Ender and Simpfendorfer2020). It is concerning that high catches of threatened and CITES-listed species continue, despite increasing international regulation under CITES, which suggests that there is an implementation gap between trade-based measures and sustainable fisheries management.
We used GPS records to identify the movements of fishers and spatial hotspots of shark fishing activity. We then interviewed fishers to establish where these coincided with important fishing grounds and areas of shark abundance, according to their perceptions. Because hammerhead sharks are known to exhibit aggregating behaviour, these hotspots could represent opportunities for fisheries management. However, spatially explicit catch-per-unit-effort data would be needed to delineate shark distributions and abundance.
The vulnerability of the scalloped hammerhead to fishing gear varied by sex and size. Our size-based sustainability indicators suggest that catches may include many sexually immature individuals, which could have significant implications for population sustainability as it prevents those individuals from contributing to the reproductive stock. In addition, a comparison of the longline and gillnet fishing vessels indicated that the longlines caught many subadult and adult individuals. In contrast, the gillnets caught fewer but smaller and younger individuals. This finding suggests that there is cumulative fishing pressure across different life history stages of the Critically Endangered scalloped hammerhead population. This may be a result of differences in gear selectivity and fishing grounds combined with the demographic distribution of scalloped hammerheads, where juvenile and subadult sharks are commonly found in coastal and shallow waters, whereas larger, mature sharks inhabit deeper offshore regions (Fahmi & Sumadhiharga, Reference Fahmi and Sumadhiharga2007; Gallagher & Klimley, Reference Gallagher and Klimley2018). Overall, catch risk was significantly lower from gillnets, suggesting that the longline fishery should be prioritized for management interventions to reduce the risks to scalloped hammerhead sharks.
The catch risk was significantly higher in May, which could be a result of seasonal aggregations and breeding patterns of scalloped hammerheads (Fahmi & Sumadhiharga, Reference Fahmi and Sumadhiharga2007; Logan et al., Reference Logan, Vaudo, Sousa, Sampson, Wetherbee and Shivji2020), or it could be because there was higher fishing pressure in the generally good weather conditions and calm waters at that time of year. Similar studies on shark longline vessels operating from East Lombok also found that scalloped hammerheads were more likely to be caught in May, June and July (Booth et al., Reference Booth, Powell, Yulianto, Simeon, Muhsin and Milner-Gulland2022). Earlier studies found that the monsoon cycle strongly affects environmental conditions in the Bali Strait, with impacts on upwellings and productivity (Nababan et al., Reference Nababan, Rosyadi, Manurung, Natih and Hakim2016; Winter et al., Reference Winter, Rudianto, Laglbauer, Ender and Simpfendorfer2020) as well as weather and fishing effort. More granular data on fishing effort per trip, used in a catch-per-unit-effort analysis, could help to clarify whether these temporal patterns result from differences in shark abundance or fishing effort. This information could then be used to inform and fine-tune management measures such as temporal closures.
Recommendations for management
Our findings highlight concerns over the sustainability of Muncar’s shark fishery, based on the high proportion of threatened, CITES-listed and immature individuals caught. However, the results also highlight several potential management options, which warrant further investigation and exploration with fishers and managers.
We have revealed an implementation gap between trade policy and fisheries management. For example, the Indonesian government’s CITES implementation efforts include a national harvest quota for scalloped hammerheads of 7,000 individuals annually, which is allocated across 27 provinces and includes a recommended minimum size of 2 m total length or 40 kg weight (as outlined in Decree of the Director General of Marine and Marine Space Management Number 1 of 2024; Directorate General of Marine and Marine Space Management, 2024). Although such policies are crucial for providing an overarching management framework, delivering positive outcomes for shark populations in the wild hinges on effective implementation, which is not evident from our data from Muncar.
In terms of specific fisheries management options, the primary goal should be to reduce offtake of threatened species. Our results show that although the longline fishery at Muncar is relatively small in terms of the total number of vessels, it is responsible for the highest number of catches of threatened sharks. Moreover, our spatial analysis and linear modelling suggest there could be spatial and temporal trends in these catches, with certain fishing grounds representing a higher risk to sharks, particularly at certain times of the year. These findings can be used to apply a mitigation hierarchy approach for fisheries management (Booth et al., Reference Booth, Squires and Milner-Gulland2019, Reference Booth, Powell, Yulianto, Simeon, Muhsin and Milner-Gulland2022). The first management measure to explore would be avoiding catches of threatened species altogether, for example by closing the longline fishery in Muncar. This could have major economic and social implications for the fishers involved in the short term. However, this might be offset by a livelihood transition or fishing vessel buy-out programme (Macintosh et al., Reference Macintosh, Bonyhady and Wilkinson2010; Shidqi et al., Reference Shidqi, Sari, Alopen, Bang, Arianto and Kopong2025), enabling affected fishers to transition to other sustainable fisheries or different sources of income.
If a moratorium on catching threatened shark species turns out to be not feasible on socio-economic grounds, other measures to reduce fishing impacts could include closures in certain areas or at specific times. For example, seasonal closures could be implemented during May if it was confirmed that this time of year coincided with important breeding and aggregation times for scalloped hammerheads. Spatial closures could be implemented in specific breeding or aggregation areas for threatened species, such as Blongas (Fig. 1), which overlaps with the fishing grounds of Muncar fishers. This location has been identified as an Important Shark and Ray Area (ISRA; a discrete, three-dimensional portion of habitat that is critical for the survival and recovery of shark, ray and chimaera populations, identified through standardized scientific criteria and expert knowledge, and intended to inform spatial conservation and management strategies; IUCN SSC Shark Specialist Group, 2024) because of scalloped hammerhead aggregations. Other management options include limits on fishing effort and/or catch volume to restrict vessel entry into the fishery or to impose a cap on the total allowable catch per season. A final option could be remediation, through retention bans and mandatory safe release of certain threatened or CITES-listed species. However, this may be difficult to implement, especially for scalloped hammerhead sharks because they exhibit high post-capture mortality (Dapp et al., Reference Dapp, Walker, Huveneers and Reina2016; Booth et al., Reference Booth, Pienkowski, Ramdlan, Naira and Muhsin2025). Ultimately, any management strategies will need to be devised in consultation with fishers to ensure they are both ecologically effective and socio-economically feasible, thereby supporting both conservation goals and coastal livelihoods (Booth et al., Reference Booth, Squires and Milner-Gulland2019b).
Broader implementation of CITES regulations in Indonesia could be supported by dedicated fishery monitoring teams conducting regular, unannounced sampling at landing sites and markets across all 27 provinces, verifying compliance with quotas and size limits. Concurrently, robust traceability systems would help to prevent illegal trade and misreporting throughout the supply chain (Prasetyo et al., Reference Prasetyo, McDevitt, Murray, Barry, Agung, Muttaqin and Mariani2021). Finally, community-based fisheries management programmes could be fostered by engaging local fishing communities in initiatives to promote voluntary adoption of pro-conservation actions through norm- and incentive-based approaches (Booth et al., Reference Booth, Ramdlan, Hafizh, Wongsopatty, Mourato and Pienkowski2023, Reference Booth, Pienkowski, Ramdlan, Naira and Muhsin2025; Shidqi et al., Reference Shidqi, Sari, Alopen, Bang, Arianto and Kopong2025). This suite of practical measures, if implemented as part of an integrated strategy, could help bridge the gap between policy and practice, ensuring that conservation goals for scalloped hammerheads and other threatened and CITES-listed sharks are achieved.
Future research directions
Whilst providing important ecological insights, our study also highlights knowledge gaps that warrant further investigation. Firstly, to better understand patterns of shark abundance across space and time, we require spatially explicit, catch-per-unit-effort data, such as detailed information on fishing vessels’ time at sea, number of hauls of fish and number of hooks per haul (Yulianto et al., Reference Yulianto, Booth, Ningtias, Kartawijaya and Santos2018). In addition, it is important to determine the relative income derived from different shark species and to identify cost-effective measures to mitigate mortality in the most at-risk species. Although we recognize that any interventions must not prevent fishers from maintaining their livelihoods, these socio-economic and ecological factors are critical for designing effective and socially just management strategies (Booth et al., Reference Booth, Squires, Yulianto, Simeon, Muhsin and Milner-Gulland2021, Reference Booth, Powell, Yulianto, Simeon, Muhsin and Milner-Gulland2022).
Supplementary material
The supplementary material for this article is available at doi.org/10.1017/S0030605326103615
Author contributions
Study conception: HB, LA, TK, GY; data analysis: OO, HB; figure preparation: HB, OO, AF, FT; writing: OO, HB, with input from FF, MGS; revision: OO, HB, MGS, FT, AF.
Acknowledgements
This study was supported by a scholarship from the UK government’s Darwin Initiative under a collaborative project between the University of Oxford and IPB University. Mobula Indonesia (MI) provided data; the Centre for Marine and Coastal Resources Research and Development (BPSPL), Technical Implementation Unit of Muncar Fishing Port (UPT Muncar), Muncar Marine and Fisheries Agency (DKP Banyuwangi), and Protection and Management of Fisheries and Coastal Resources and Conservation Areas (PSP3K) supported the interviews. We thank all fishers in Muncar for their time and support, especially Mr Kasim, as a leader of the fisher community; and the enumerators team, Antika Rizka, Chindy Larasati, Hasan Rizal, Zulfikar Gilang Maulana and Gozali Irianies.
Conflicts of interest
None.
Ethical standards
This research abided by the Oryx guidelines on ethical standards and was conducted with approval from the Interdivisional Research Ethics Committee at the University of Oxford (ref. R66416/RE001) and Indonesia’s National Research and Innovation Agency (BRIN; ref. 407/ E5/E5.4/ SIP/2019, 39/SIP/IV/FR/1/2023 and 17/SIP.EXT/IV/FR/5/2023).







 Open access

