1. Introduction
The inclined jet in crossflow (JICF), produced by injecting a jet obliquely into a mainstream flow through an orifice, has been extensively studied in engineering scenarios (Mahjoub Said et al. Reference Mahjoub Said, Mhiri, El Golli, Le Palec and Bournot2003; Han, Dutta & Ekkad Reference Han, Dutta and Ekkad2012) and natural adaptations (Gad-el-Hak & Mureithi Reference Gad-el-Hak and Mureithi2022). As a canonical configuration in fluid mechanics, the inclined JICF features a characteristic vortical system comprising the horseshoe vortex, shear-layer vortices, and the counter-rotating vortex pair (CRVP), sharing a flow geometry resembling that of a regular JICF (Mahesh Reference Mahesh2013; Milani, Ling & Eaton Reference Milani, Ling and Eaton2021). Specifically, the inclined configuration offers distinct advantages in various applications, such as mitigating flow separation and promoting wall attachment while suppressing mixing, thereby achieving superior system aerothermal performance (Milanovic & Zaman Reference Milanovic and Zaman2003; Zhang et al. Reference Zhang, Zhang, Wang and Tan2020; Li et al. Reference Li, Meng, Yin, Hui and Li2022). Under smooth-wall conditions, the structure and evolution of these vortices are governed primarily by the velocity ratio (VR = Uj /U 0, where Uj is the jet velocity, and U 0 is the mainstream velocity) and are highly sensitive to the properties of the incoming boundary layer, including its thickness and turbulence intensity (Shi, Li & Ren Reference Shi, Li and Ren2024). In practical settings, surface roughness is nearly unavoidable. It can originate from particulate deposition on turbine-module surfaces (Zhang et al. Reference Zhang, Huang, Zhou, Tian and Liu2023b ), biologically derived surface textures (Zhang et al. Reference Zhang, Zeng, He and Liu2023d ), or the complex geometry of urban canopy structures (van Reeuwijk & Huang Reference van Reeuwijk and Huang2025). Roughness in such contexts can significantly alter the boundary-layer characteristics that, in turn, modulate the downstream JICF dynamics. Such externally imposed surface perturbations introduce non-negligible deviations from the canonical boundary-layer state, leading to non-negligible changes in JICF behaviour, and potentially degrading its performance in practical applications (Hamed, Tabakoff & Wenglarz Reference Hamed, Tabakoff and Wenglarz2006). Nevertheless, the evolutionary characteristics of JICF across different roughness regimes remain unclear, and the mechanisms by which roughness influences the jet–crossflow interaction are still poorly understood. As a result, our current understanding of roughness-affected JICF is limited, highlighting the need for further detailed investigation.
Based on the roughness Reynolds number (
 ${k}_{s}^{+}$
), rough surfaces are commonly categorised into hydraulically smooth (
 ${k}_{s}^{+}\lt {k}_{\textit{Smooth}}^{+}$
), transitionally rough (
 ${k}_{\textit{Smooth}}^{+}\leq {k}_{s}^{+}\leq {k}_{\textit{Rough}}^{+}$
) and fully rough (
 ${k}_{s}^{+}\gt {k}_{\textit{Rough}}^{+}$
) regimes, each inducing distinct modifications to flow characteristics. In the present study, these boundary-layer modifications are primarily reflected in the evolution of multi-scale structures and the formation of secondary flows. One such modification is the modulation of large-scale coherence. Compared with the coherence over smooth surfaces (Lee & Sung Reference Lee and Sung2011), roughness enhances the growth rate of large-scale structures, producing a steeper inclination, and redistributing momentum laterally (Kaminaris, Balaras & Schultz Reference Kaminaris, Balaras and Schultz2025). Small-scale vortices generated by roughness elements reduce the ability of large-scale structures to organise and sustain near-wall low-speed streaks, resulting in an energy transfer from low- to high-order motions (Cardillo et al. Reference Cardillo, Chen, Araya, Newman, Jansen and Castillo2013). Roughness-induced perturbations also narrow the low-speed streaks and increase their number, and with increasing roughness, these streaks fragment in the streamwise direction, giving rise to additional small-scale structures (Wu et al. Reference Wu, Xiang, Li and Yin2025). Secondary flows, defined as large-scale motions perpendicular to the mainstream direction, are frequently observed over ridge-type and strip-type (two-dimensional) roughness using vortex-identification methods (Kevin et al. Reference Kevin, Monty, Bai, Pathikonda, Nugroho, Barros, Christensen and Hutchins2017; Vanderwel et al. Reference Vanderwel, Stroh, Kriegseis, Frohnapfel and Ganapathisubramani2019). Nevertheless, studies explicitly characterising secondary flows generated by three-dimensional roughness are limited (Barros & Christensen Reference Barros and Christensen2014). Evidence for such motions has been inferred indirectly, e.g. through periodically distributed Reynolds stresses, uniformity in streamwise velocity, or reduced-order model analyses (Kaminaris et al. Reference Kaminaris, Balaras, Schultz and Volino2023, Reference Kaminaris, Balaras and Schultz2025; Ma et al. Reference Ma, Xu, Sung and Huang2023, Reference Ma, Xu, Sung, Tian and Huang2025). This is consistent with Prandtl’s second-kind secondary flows, which arise from lateral imbalances between the production and dissipation of Reynolds stresses (Hinze Reference Hinze1967). Periodically distributed momentum pathways can be simultaneously identified: low-momentum pathways (LMPs) correspond to locally enhanced Reynolds stress associated with upwash motion, whereas high-momentum pathways (HMPs) correspond to locally weaker Reynolds stress associated with downwash motion. In summary, roughness-induced boundary-layer flows are complex and cannot be characterised solely by increased turbulence intensity. Yet studies examining the evolutionary behaviour of roughness-affected boundary layers across different roughness regimes remain limited, particularly in the transitionally rough regime (
 ${k}_{\textit{Smooth}}^{+}\leq {k}_{s}^{+}\leq {k}_{\textit{Rough}}^{+}$
), where near-wall flow features are highly elaborate due to the interplay between viscous stress and form drag (Flack et al. Reference Flack, Schultz, Barros and Kim2016).
On the other hand, studies on roughness-affected JICF have primarily concentrated on surface jet–scalar transport for engineering purposes. Most previous works investigate specific roughness morphologies (Lewis et al. Reference Lewis, Barker, Bons, Ai and Fletcher2011; Wilkins et al. Reference Wilkins, Lynch, Thole, Vincent, Quach and Mongillo2022b; Zhang et al. Reference Zhang, Wang, Zhou, He and Liu2023c ; Xu et al. Reference Xu, Wang, Niu, Zhou, Peng and Liu2025) or a limited set of roughness configurations (Goldstein et al. Reference Goldstein, Eckert, Chiang and Elovic1985; Barlow & Kim Reference Barlow and Kim1995), leading to conclusions that are often difficult to reconcile – particularly at high velocity ratios – regarding whether surface scalar transport is degraded or recovered. These inconsistencies stem from the lack of a quantitative framework identifying which roughness scales the JICF can perceive and respond to. Recent findings indicate that for JICF systems, the wall-scalar response is governed primarily by the ratio of roughness scale (ks -based) to jet hole diameter, rather than by height, slope, or ks alone (Huang et al. Reference Huang, Wang, Zeng, Chen, Zhou, Wen, Peng and Liu2024b ). This scaling provides a unified basis for interpreting previously conflicting reports of scalar deterioration versus recovery. Building on this framework, it has also been shown that upstream roughness plays a dominant role in modulating steady wall-scalar distributions and in inducing asymmetric unsteady scalar dynamics (Huang et al. Reference Huang, Wang, Li, Chen, Zhou, Peng and Liu2024a ), both of which are strongly influenced by the underlying JICF vortical structures (Zhou et al. Reference Zhou, Chen, Liu, Wen and Peng2018). However, investigations of the flow behaviour of roughness-affected JICF remain scarce and have mostly addressed only the mean flow field (Wilkins et al. Reference Wilkins, Lynch, Thole, Vincent, Quach and Kaufman2022a ). How JICF dynamics – particularly flow intermittency, multi-scale coherence, and the energy redistribution associated with different roughness regimes – responds to upstream roughness remains largely unknown, despite its expected importance.
Although research on the effects of roughness in boundary-layer flows has advanced and provided valuable insights, its specific influence on downstream JICF behaviour and associated vortical structures remains poorly understood. Given the large spatial extent of the rough-wall and JICF domains – and the resulting high computational cost of high-fidelity simulations – an experimental approach is adopted here. However, commonly used experimental techniques still exhibit limitations in resolving the near-wall flow features that are strongly influenced by surface roughness. Laser Doppler velocimetry suffers from an inherent limitation in spatial resolution (Fischer Reference Fischer2021). Magnetic resonance velocimetry is limited by its spatiotemporal resolution, despite offering valuable three-dimensional flow field diagnosis. (Gunady et al. Reference Gunady, Milani, Banko, Elkins and Eaton2021). While time-resolved particle image velocimetry (TR-PIV) struggles with wall reflection and ill-resolved near-wall vectors due to unmatched refractive indices (Abu Rowin et al. Reference Abu Rowin, Manovski, Chung and Hutchins2025; Hecht 2012). To address these limitations, we employ a refractive-index-matching (RIM) based TR-PIV technique, which has recently been applied to diagnose internal and near-wall flows (Qu & Xiong Reference Qu and Xiong2024; Huang et al. Reference Huang, Xu, Vicano, Qu, Xiong, Zhou and Liu2026). By matching the refractive indices of the solid model and working fluid, this method effectively minimises surface distortion and light reflections. Motivated by the need for a well-resolved experimental characterisation of roughness-affected JICF dynamics, this study leverages RIM-based TR-planar PIV and stereo PIV (SPIV) to develop a physics-based understanding of how upstream roughness modifies jet–mainstream interactions and downstream vortex evolution. Nevertheless, the influence of upstream roughness on JICF has not yet been fully elucidated, and warrants more detailed experimental investigation.
The objective of this study is to systematically investigate turbulent boundary-layer flows across different roughness regimes, and their induced modulations on JICF. To focus on fundamental mechanisms and isolate the dominant effect of upstream roughness, the surface downstream of the jet orifice is kept smooth. Three upstream surface regimes are considered: smooth, transitionally rough (
 ${k}_{s}/{D}=$
0.129), and fully rough (
 ${k}_{s}/{D}=$
0.782), and their effects on downstream JICF are examined at three velocity ratios (VR = 0.33, 0.67, 1.0). The transitionally rough regime induces a global modulation, producing a binary JICF behaviour characterised by a vertically stretched CRVP. In contrast, the fully rough regime imposes a local, asymmetric modulation through periodic secondary flows, leading to differentiated development of the CRVP components at lower velocity ratios (VR ≤ 0.67). The experimental set-up is detailed in § 2. Subsection 3.1 presents the flow behaviour over the upstream roughness. Subsection 3.2 reports the mean planar PIV results of JICF. Subsection 3.3 details the unsteady flow behaviour of JICF, including vorticity evolution and dynamic analysis. Subsection 3.4 presents the SPIV results, including turbulent statistics, CRVP development, and the effects of roughness-induced periodic secondary flows on the CRVP.
2. Methodology
2.1. Experimental set-up
The experiments are performed in a closed-circuit, low-speed vertical RIM facility, and a schematic of the test rig is shown in figure 1. The test section has channel width 100 mm and height 60 mm. Fluid temperature is stabilised using a heat exchanger and a water-cooling tower. Honeycomb straighteners are installed at the entrance of the developing section. A test plate with a cylindrical jet hole of diameter D = 7 mm and inclination angle 35° is mounted in the test section. The jet is supplied from a plenum measuring 28.5D × 17.2D × 8.6D, which includes a buffering baffle to further stabilise the flow. The distance between the honeycomb and the jet hole is set to 100D.
Experimental set-up for the PIV measurements.

In this study, two PIV techniques are employed, as illustrated in figure 2(a). Planar PIV is used to measure two velocity components on a two-dimensional plane. Two high-speed cameras operated at 1000 Hz, together with a 532 nm continuous laser, provide highly spatiotemporal resolution velocity fields. The centre plane (
 ${z}/{D}=$
0), spanning
 ${x}/{D}=-$
9 to
 ${x}/{D}=$
9, is selected to capture the full evolution of the JICF. The SPIV is used to obtain all three velocity components on two-dimensional planes. Four lateral measurement planes (
 ${x}/{D}=-$
1.8, 1, 3, 5) are positioned to characterise the upstream condition and the vertical and spanwise development of the CRVP. Three velocity ratios, VR = 0.33, 0.67, 1.0, are examined. Identical camera and laser settings are applied to both PIV systems, allowing all measurements to be time-resolved. PMMA-RhB-Frak particles (30–50 μm) are used as tracers to enhance scattering under 532 nm illumination. For each operating condition, 4000 image pairs are acquired, and velocity fields are computed and assembled using standard cross-correlation algorithms.
Schematics of (a) the two-dimensional PIV and SPIV measurement set-ups, (b) the experimental apparatus in operation, and (c) a sample recorded particle image.

Surface roughness in this study is characterised using the equivalent roughness height (ks
), which is determined from the maximum peak-to-valley height (k), the base diameter (S), and the geometric configuration of the roughness elements. To preclude the confounding dynamics of upstream–downstream roughness coupling, and to establish a pure mechanistic baseline for the yet-unresolved upstream effects, a canonical smooth test plate was downstream utilised for this investigation. A cone-shaped element is adopted as the representative roughness morphology, as its shape resembles the surface features encountered in various practical contexts. For example, the roughness type of the degraded or manufactured turbine module has been described as bulges (Zhang et al. Reference Zhang, Huang, Zhou, Tian and Liu2023b
), canyon-like shape (Ma et al. Reference Ma, Harvey, Wellman and Wood2019) and scattered protrusions (Wildgoose & Thole Reference Wildgoose and Thole2023), while the bio-fouled surfaces have been described as truncated cone (Womack et al. Reference Womack, Volino, Meneveau and Schultz2022) and cosine protrusions (Ma et al. Reference Ma, Xu, Sung, Tian and Huang2025). The elements are arranged in a compact staggered pattern to effectively force complex near-wall wake interactions (Vadlamani, Tucker & Durbin Reference Vadlamani, Tucker and Durbin2018) and facilitate the ks
determination. Surface roughness in this study is characterised using the jet-hole normalised equivalent roughness height (
 ${k}_{s}/{D}$
), which is determined from the roughness shape and density parameter (Λ
S
) using the empirical correlation (Flack & Schultz Reference Flack and Schultz2010), which is reliable for cone-shaped roughness morphologies:
 \begin{align} \smash{\raise-23pt\hbox{$\bigg\{$}}\dfrac{k_{s}}{k}& =1.583\times 10^{-5}\varLambda_{S}^{5.683},\varLambda _{S}\lt 7.842,\nonumber\\ \dfrac{k_{s}}{k}& =1.802\varLambda_{S}^{0.03038}, 7.842\leq \varLambda _{S}\leq 28.12,\nonumber \\ \dfrac{k_{s}}{k}& =255.5\varLambda_{S}^{-1.454},\varLambda _{S}\gt 28.12,\end{align}
where the roughness shape and density parameter ΛS is defined as (Sigal & Danberg Reference Sigal and Danberg1990)
 \begin{equation} \varLambda _{S}=\left(\frac{S}{S_{f}}\right)\left(\frac{A_{S}}{A_{f}}\right)^{1.6} ,\end{equation}
where
 ${S}/{S}_{f}$
denotes the ratio of the unroughened surface area to the cumulative frontal area of the roughness array, and A
S
and A
f
represent the windward wetted surface area and the frontal projected area of a single roughness element, respectively. The cone-shaped roughness elements employed in the present study are well-characterised by this correlation, which has been verified by Huang et al. (Reference Huang, Wang, Zeng, Chen, Zhou, Wen, Peng and Liu2024b
). Two types of cone-shaped elements are selected to represent moderately rough (case 2) and severely rough (case 3) surfaces. These cases differ in their
 ${k}_{s}/{D}$
and
 ${k}/{D}$
ratios relative to the jet-orifice diameter, as summarised in table 1. A smooth surface is also included for comparison.
Parametric information for the various roughness configurations.

In this study, a sodium iodide (NaI) solution is used as the working fluid because its refractive index can be matched to that of acrylic at appropriate concentration and temperature. The procedures for determining the required concentration and performing the temperature calibration follow Huang et al. (Reference Huang, Xu, Vicano, Qu, Xiong, Zhou and Liu2026). As shown in figures 2(b,c), once the solution is properly calibrated, wall reflections are greatly reduced, and the boundaries of the roughness elements and jet orifice become nearly invisible. The density and viscosity of the RIM NaI solution are 1771.2 kg m-3 and 0.0017 Pa s, respectively (Bai & Katz Reference Bai and Katz2014). The PIV measurement uncertainties are estimated through standard error-propagation methods. The uncertainties are estimated to be approximately 2.8 % for planar PIV and 3.7 % for stereo PIV, via standard error propagation of calibration and algorithmic variables. Based on the high-precision RIM calibration (Qu & Xiong Reference Qu and Xiong2024), RIM errors were minimised under matched fluid temperature (3 × 10⁻⁵ with pixel error <0.1 pixel) and considered negligible. The final values primarily sum the quadrature of spatial calibration errors (2 % for planar, 3.14 % for stereo) and cross-correlation uncertainties (∼2 %) (Lazar et al. Reference Lazar, DeBlauw, Glumac, Dutton and Elliott2010; Wilson & Smith Reference Wilson and Smith2013; Sciacchitano & Wieneke Reference Sciacchitano and Wieneke2016).
3. Results and discussion
Figure 3 presents instantaneous fields of absolute velocity for the JICF under smooth and rough (
 ${k}_{s}/{D}=$
0.782) upstream surfaces at VR = 1.0. Upstream of the jet orifice (
 ${x}/{D} \lt - 2$
), the boundary-layer flow over the smooth surface (figure 3
a) exhibits relatively calm behaviour, with only weak near-wall pulsations. In contrast, the boundary layer over the rough surface (figure 3
b) displays a more intricate and spatially complex pattern. The near-wall velocity magnitude is noticeably reduced due to the increased drag introduced by the roughness elements (Kadivar, Tormey & McGranaghan Reference Kadivar, Tormey and McGranaghan2021). Downstream of the roughness (
 ${x}/{D}$
≥ –2), the influence of the roughness persists and continues to propagate, interacting with the inclined jet. The reduction in velocity magnitude remains detectable even at
 ${x}/{D}=$
8, despite the geometrically smooth downstream region. These observations highlight the importance of characterising the upstream flow behaviour to understand its modulation of the inclined jet. Accordingly, the following analysis first examines the roughness-affected upstream boundary-layer flow, and then investigates how these upstream modifications alter the downstream JICF dynamics.
Full-field snapshots of instantaneous absolute velocity at VR = 1.0 for both (a) smooth surface and (b) roughened upstream surface conditions.

3.1. Upstream boundary-layer flow mechanism under various roughness configurations
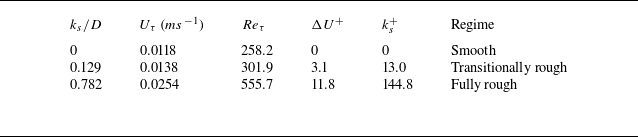
The mean flow characteristics of the upstream boundary layer (
 ${x}/{D}$
≤ –2) under different roughness configurations are first examined. Figure 4(a) shows the streamwise velocity profiles at
 ${x}/{D}=-$
4, where the boundary-layer thickness is similarly identified as approximately 3D. For the transitionally rough case (
 ${k}_{s}/{D}=$
0.129), the streamwise velocity is noticeably reduced within
 ${y}/{D}$
≤ 0.6, after which the profile converges to that of the smooth wall for
 ${y}/{D}$
> 0.6. In contrast, the fully rough case (
 ${k}_{s}/{D}=$
0.782) exhibits a much thicker roughness-affected region: the profile remains non-converged until approximately
 ${y}/{D}$
> 2.8, indicating a substantially deeper penetration of roughness effects into the boundary layer. The friction velocity
 ${U}_{\tau}$
is determined over the log layer in the region y
+ > 70 to avoid the roughness sublayer, where the slope of U
+ versus ln y
+ equals
 ${1}/{\kappa}$
(with
 $\kappa=0.41$
, the von Kármán constant), and B = 5.1 for a smooth surface:
 \begin{align} U^{+}=\frac{1}{\kappa }\ln y^{+}+B-\Delta U^{+} .\end{align}
As shown in figure 4(b), the composite description with a logarithmic region (the magenta solid line) is included for reference (Marusic et al. Reference Marusic, McKeon, Monkewitz, Nagib, Smits and Sreenivasan2010; Krug, Philip & Marusic Reference Krug, Philip and Marusic2017) and matches well with the smooth-surface profile. Accordingly, the roughness functions ΔU
+
are evaluated to be 3.1 for
 ${k}_{s}/{D}=$
0.129, and 11.8 for
 ${k}_{s}/{D}=$
0.782. Additional parameters are summarised in table 2. Based on the computed ΔU
+ and
 ${k}_{s}^{+}$
values, the
 ${k}_{s}/{D}=$
0.129 surface is classified as transitionally rough, while the
 ${k}_{s}/{D}=$
0.782 surface corresponds to a fully rough regime, referring to
 ${k}_{{Smooth}}^{+}=5$
and
 ${k}_{{Rough}}^{+}=70$
(Kadivar et al. Reference Kadivar, Tormey and McGranaghan2021). Based on boundary-layer thickness, friction velocity and kinetic viscosity, Re
τ
is estimated as 258.2, 301.9 and 555.7 for smooth, transitionally rough and fully rough regimes, respectively, which show Re
τ
magnitudes for turbulent boundary layers similar to those reported in previous literature (Seddighi et al. Reference Seddighi, He, Pokrajac, O’Donoghue and Vardy2015; Tardu, Doche & Bauer Reference Tardu, Doche and Bauer2019).
Roughness and flow parameters for the different upstream surface conditions.

Mean velocity profiles at
 ${x}/{D}=-$
4: (a) outer-scaled variables and (b) log-law-based variables, under various roughness regimes.

Contours of (a) the normal Reynolds stress and (b) the Reynolds shear stress for the smooth surface,
 ${k}_{s}/{D}=$
0.129 and
 ${k}_{s}/{D}=$
0.782.

Outer-scaled Reynolds stresses are presented in figure 5. The contours of the streamwise normal Reynolds stress are shown in figure 5(a), with two solid contour levels (0.014 in white and 0.018 in black) included to help to identify their affected positions in heights. The heights of these contours rise progressively with increasing roughness, indicating a deeper penetration of roughness effects into the boundary layer. Relative to the smooth case, the normal Reynolds stress below the black dashed line is enhanced for
 ${k}_{s}/{D}=$
0.129. In the fully rough case (
 ${k}_{s}/{D}=$
0.782), the region of elevated normal Reynolds stress becomes substantially thicker, although the stress below the black dashed line is weaker than in the transitionally rough case. The Reynolds shear stress contours (figure 5
b) show a monotonic increase with increasing
 ${k}_{s}/{D}$
. This behaviour indicates that stronger surface roughness diminishes the integrity of the viscous sublayer, reduces viscous damping, and thereby amplifies the Reynolds shear stress. As a summary, the transitionally rough regime exhibits a distinct local maximum in the normal Reynolds stress, whereas the fully rough regime still yields the largest overall stress levels.
Contours of upstream instantaneous vorticity for (a) smooth surface, (b)
 ${k}_{s}/{D}=$
0.129, and (c)
 ${k}_{s}/{D}=$
0.782, with Δt = 0.15 s.

The vorticity evolutions for the three surface regimes are next examined. White contour lines (U/U 0 = 0.8) are used to visualise the instantaneous variation in near-wall streamwise velocity thickness. In the smooth regime (figure 6 a), the boundary layer exhibits a clean and relatively stable structure: weak unsteadiness arises only from the sporadic passage of near-wall streaks. The white contour line remains consistently thin, indicating a weakly intermittent incoming flow. In the transitionally rough regime (figure 6 b), near-wall streaks become more numerous and remain mostly unbroken, showing pronounced interactions with the roughness morphology. The white contour line displays strong intermittency, switching between thick and thin regions. In the fully rough regime (figure 6 c), near-wall streaks are again intensified but undergo rapid breakdown into small-scale, fragmented structures. The white contour lines at this regime tend to exhibit a persistently enlarged thickness, reflecting a moderately intermittent state rather than sharp oscillations. These observations explain the differences in normal Reynolds stress shown in figure 5. In the transitionally rough regime, the increased number of non-fragmented vortices enhances their interactions with the wall, amplifying near-wall streamwise fluctuations, and producing locally elevated Reynolds stress. In the fully rough regime, the viscous sublayer is completely destroyed, causing near-wall streaks to break down quickly. This breakdown reorganises the near-wall structures, reducing local peak intensities but broadening the overall spatial region influenced by turbulent activity.
One-dimensional pre-multiplied vertical energy spectra of the streamwise velocity fluctuation
 $k_{x}{E}_{U'U'}^{+}$
at
 ${x}/{D}=-$
4 are presented in figure 7. The line at y
+ = 70 marks the estimated onset of the region where the universal logarithmic slope is recovered (as identified in figure 4
b), providing a consistent benchmark for spectral comparison across all regimes. In the smooth regime (figure 7
a), two distinct peaks are evident at approximately y
+ = 30, corresponding to canonical motions associated with near-wall streaks and large-scale coherence. In the transitionally rough regime (figure 7
b), two local peaks persist below y
+ = 70; however, their surrounding energy is reduced and their connectivity weakened, indicating more isolated structures. This suggests that while the multi-scale organisation of the boundary layer is largely preserved, roughness perturbs the self-sustaining coherent structures that underpin wall turbulence, redistributing the energy signatures (Cardillo et al. Reference Cardillo, Chen, Araya, Newman, Jansen and Castillo2013). Notably, an additional peak emerges for y
+ > 70, associated with both streak-related and large-scale motions. This indicates that dynamics originating beneath the buffer layer can propagate upwards to influence the logarithmic region, generating intermediate-wavenumber features consistent with the strong intermittency observed in the boundary-layer thickness in figure 6(b). In the fully rough regime (figure 7
c), the spectral peaks associated with near-wall streaks and large-scale coherence vanish. At such a high
 ${k}_{s}^{+}$
, the physical location of y
+ ≈ 30 resides entirely within the roughness sublayer. Consequently, the canonical near-wall structures are disrupted by the turbulent wakes of the protruding roughness morphology (Vadlamani et al. Reference Vadlamani, Tucker and Durbin2018), leading to the suppression of the traditional near-wall peak. A residual spectral peak at
 ${y}^{+}\gt70$
, although weaker, reflects moderate flow intermittency under fully rough conditions.
Contours of the one-dimensional pre-multiplied energy spectra of the streamwise velocity fluctuation for (a) smooth surface, (b)
 ${k}_{s}/{D}=$
0.129, and (c)
 ${k}_{s}/{D}=$
0.782.

3.2. Roughness effects on two-dimensional mean behaviour of downstream JICF
Influenced by the upstream boundary-layer flow, the mean behaviour of the JICF is first examined. Figure 8 shows the mean absolute velocity fields for different roughness regimes and velocity ratios. Centrelines passing through the jet-hole centroid (x = 0, y = 0) indicate the macroscopic trajectory of the jet core. Above the orifice, the jet’s oblique injection results in strongly curved postures due to mainstream suppression. Low-speed regions are present immediately downstream of the jet trailing edge. The centreline then gradually flattens out with downstream evolution. At a given velocity ratio, the overall distribution of absolute velocity is similar across roughness levels, suggesting that the bulk jet characteristics are largely preserved. A closer view, highlighted by the black indicator, of enhanced momentum of the jet core is presented for
 ${k}_{s}/{D}=0.129$
. In contrast, it shows slight attenuation of the jet core for
 ${k}_{s}/{D}=0.782$
, indicating that higher roughness enhances momentum exchange with the surrounding flow. Corresponding profiles at
 ${x}/{D}=$
1 and 4 are plotted in figure 9. Globally, the transitionally rough regime attains the highest absolute velocity, whereas the fully rough regime exhibits the lowest. In figure 9(a), the incoming boundary-layer profile is corrupted by the jet momentum injection when VR ≥ 0.67, where distinct peaks appear at
 ${y}/{D}$
≈ 0.5. At VR = 0.67, the peak velocity marginally increases to 0.93 in the transitionally rough regime (a minor increment over the smooth baseline 0.92), but undergoes a more severe attenuation down to 0.80 in the fully rough regime (a 13.0 % reduction from the baseline). For VR = 1.0, the local peak velocity reaches its maximum 1.73 in the transitionally rough regime (a 1.8 % increase over the smooth-wall baseline 1.70), whereas it is attenuated to 1.59 in the fully rough regime (a 6.5 % reduction from the baseline). The region at approximately
 ${y}/{D}$
< 0.5 exhibits increased local velocity with rising roughness, suggesting that roughness-induced momentum exchange accelerates the near-wall recovery of low-speed regions. As the flow develops, the influence of the injected jet momentum is progressively assimilated, causing the peak to disappear downstream of
 ${x}/{D}=$
4 (figure 9
b), indicating that the overall flow field tends towards reconstructing the turbulent boundary-layer distribution.
Contours of absolute velocity at
 ${z}/{D}=$
0 for various VR values under upstream conditions of (a) smooth surface, (b)
 ${k}_{s}/{D}=$
0.129, and (c)
 ${k}_{s}/{D}=$
0.782.

Absolute velocity profiles of (a)
 ${x}/{D}=$
1 and (b)
 ${x}/{D}=$
4 for various roughness regimes and VRvalues.

Contours of vertical velocity of
 ${z}/{D}=$
0 at various roughness regimes and VR values (a) Smooth, (b)
 $k_{s}/D=0.129$
and (c)
 ${k}_{s}/{D}=0.782$
.

Figure 10 presents contours of vertical velocity for different roughness regimes and velocity ratios. At a given velocity ratio, increasing roughness reduces the vertical velocity beneath the jet core (highlighted by the black rectangle), indicating suppression of the secondary jet lift, and a corresponding decrease in upward momentum transfer in this region. Quantitative profiles at
 ${x}/{D}=$
2.5 are shown in figure 11. Overall, the vertical velocity decreases progressively with increasing roughness. For the smooth case at VR ≥ 0.67, two peaks – highlighted with green arrows – are observed, corresponding to the jet core and the secondary lift-up. As VR increases, the peak associated with the jet core remains nearly unchanged, whereas the secondary lift-up peak diminishes with increasing roughness: at VR = 0.67, the smooth wall exhibits a distinct secondary peak with magnitude approximately 0.12. The transitionally rough regime attenuates this peak down to approximately 0.09 (25.0 % reduction), and the fully rough regime further suppresses it to approximately 0.086 (28.3 % reduction). This roughness-induced suppression effect becomes even more pronounced at the higher velocity ratio VR = 1.0. The secondary lift-up peak for the smooth case reaches 0.40, but it undergoes a noticeable reduction to 0.31 (22.5 % reduction) and 0.28 (30.0 % reduction) in the transitionally rough and fully rough regimes, respectively. It is reflected that the near-wall momentum exchange in the wall-normal direction is driven by distinct flow mechanisms beyond mean flow analysis, which are induced by enhanced upstream boundary-layer disruption.
Vertical velocity profiles at
 ${x}/{D}=$
2.5 for various roughness regimes and VRvalues (a)
 $\textit{VR}=0.33$
, (b)
 $\textit{VR}=0.67$
, (c)
 $\textit{VR}=1.0$
.

Contours of two-dimensional TKE at
 ${z}/{D}=$
0 for various VR values under upstream surface regimes: (a) smooth, (b)
 ${k}_{s}/{D}=$
0.129, and (c)
 ${k}_{s}/{D}=$
0.782.

As shown in figure 12, the spatial distribution of the two-dimensional turbulent kinetic energy (TKE)
 $\textit{TKE}_{2\hbox{-}D}=0.5(\langle U'U'\rangle +\langle V'V'\rangle )$
within the JICF field reveals a complex, non-monotonic dependency on the upstream surface roughness, at a fixed velocity ratio. In the smooth regime (figure 12
a), the magnitude of TKE2-D
is comparable at both edges of the orifice when VR ≤ 0.67. In contrast, at VR = 1.0, the TKE2-D
near the trailing edge exceeds that of the leading edge, attributed to the merging of fluctuations from the windward and leeward sides (Zhang et al. Reference Zhang, Wang, Wen, He, Liu and Zhou2022). Regions outlined with white solid lines exhibit lower
TKE2-D
than their surroundings, indicating that the jet core remains relatively stable during the jet–crossflow interaction. Roughness induces a clear amplification of
TKE2-D
at the leading edge and a shrinkage of stable jet core above the orifice, providing direct evidence of enhanced windward mainstream–jet interaction. As
 ${k}_{s}/{D}$
increases, TKE2-D
near the orifice initially rises and then decreases, suggesting that increased boundary-layer turbulence does not monotonically destabilise the JICF. Instead, the transitionally rough regime produces the maximum turbulent energy. To provide quantitative comparisons, the integrated and maximum TKE2-D
are then listed in table 3. The integrated TKE2-D
(
 $({1}/{S})\iint _{S}\textit{TKE}_{2\text{-}D}\,{\rm d}x\,{\rm d}y$
) represents the global turbulence level of the region of interest, ranged from the area S (–1 <
 ${x}/{D}$
< 4 and 0 <
 ${y}/{D}$
< 2). At VR = 0.33, the integrated TKE2-D
increases from 0.0102 for the smooth wall to 0.0137 in the transitionally rough regime (34.3 % increase), and further rises slightly to 0.0138 in the fully rough regime. A similar trend is observed at VR = 0.67, where the value grows consecutively from 0.0123 to 0.0161 (30.9 % increase) and ultimately to 0.0166. This indicates that at low to moderate velocity ratios, increasing roughness continuously elevates the macroscopic turbulence level across the entire flow field. Conversely, the maximum TKE2-D
peaks within the transitionally rough regime, and subsequently attenuates in the fully rough regime. For instance, at VR = 0.33, the maximum surges by 84.0 % (from 0.0282 to 0.0519) at the transitionally rough regime, but drops by 26.2 % (to 0.0383) at the fully rough regime. The VR = 0.67 case exhibits a parallel behaviour. Although these localised maximum values are generated in the vicinity of the jet, their fluctuations do not highly dominate the globally integrated statistics. When the velocity ratio is elevated to VR = 1.0, both the integrated and maximum TKE2-D
exhibit a synchronous non-monotonic trend. They peak in the transitionally rough regime, where the integrated TKE jumps by 67.4 % (from 0.0175 to 0.0293) and the maximum TKE2-D
surges by 68.4 % (from 0.0532 to 0.0896). Upon further shifting to the fully rough regime, the maximum drops by 35.4 % (to 0.0579). Unlike the monotonic increase observed at lower VR cases, the integrated value also decreases by 24.6 % (to 0.0221). This synchronous behaviour indicates that at this higher velocity ratio, the jet fluctuations are significantly intensified and exert a much more influential role over the global region.
Integrated and maximum TKE2-D under different rough regimes and velocity ratios, expressed as integrated TKE2-D (maximum TKE2-D ).

3.3. Roughness effects on unsteady dynamics of downstream JICF
The vorticity evolution of the JICF is examined for two representative velocity ratios, VR = 0.33 and 1.0. As shown in figure 13, the instantaneous vorticity fields for VR = 0.33 correspond to mainstream-dominated conditions. In this regime, the flow is governed primarily by negative shear-layer vortices generated by the crossflow, whereas the positive vortices ejected from the jet orifice act mainly as an intermittent pulsation to the downstream field. Under the smooth-wall condition (figure 13
a), the production of positive vortices (A
1) is very weak. These vortices remain confined near the surface (y/D ≈ 0.5), and decay rapidly due to suppression by the stronger negative vortices. This behaviour is consistent with the low fluctuation levels and minimal TKE2-D
observed in figure 12(a). In the transitionally rough regime (
 ${k}_{s}/{D}$
= 0.129) with a thick incoming boundary layer (figure 13
b), roughness thickens the inflow and modifies the local velocity profile, thereby strengthening the positive vortices (A
2). These vortices are able to penetrate to significantly higher wall-normal locations, reaching
 ${y}/{D}$
≈ 2 during their evolution, accompanied by negative vorticity that potentially manifests as a larger-scale hairpin vortex. In contrast, when the transitionally rough surface is subjected to a thin incoming boundary layer (figure 13
c), the positive vortices (A
3) display shedding and development characteristics similar to the smooth-wall case. In the fully rough regime (
 ${k}_{s}/{D}$
= 0.782), the incoming flow is saturated with vorticity from fragmented upstream structures. Consequently, the positive vortices (A
4) ejected from the jet experience an in situ decay almost immediately after formation. It is indicated that at low velocity ratio, the downstream evolution in the fully rough regime is largely governed by roughness-induced flow dynamics.
Contours of instantaneous vorticity for downstream JICF (VR = 0.33) at (a) smooth surface, (b)
 ${k}_{s}/{D}=$
0.129 (thick incoming flow), (c)
 ${k}_{s}/{D}=$
0.129 (thin incoming flow), and (d)
 ${k}_{s}/{D}=$
0.782, with Δt
1 = 0.05 s.

Contours of instantaneous vorticity for downstream JICF (VR = 1.0) at (a) smooth surface, (b)
 ${k}_{s}/{D}=$
0.129 (thick incoming flow), (c)
 ${k}_{s}/{D}=$
0.129 (thin incoming flow), and (d)
 ${k}_{s}/{D}=$
0.782, with Δt
1 = 0.05 s.

At the higher velocity ratio VR = 1.0, the flow is dominated by strong shear between the mainstream and the jet, which actively triggers Kelvin–Helmholtz (K–H) instability and leads to the continuous formation of shear-layer vortices. Under the smooth-wall condition (figure 14
a), the upstream flow maintains a relatively steady negative-vorticity distribution associated with the turbulent boundary-layer velocity gradient. As a result, the shear-layer vortices generated through jet–crossflow interaction (A
1) shed and evolve in a regular, sequential manner. In the transitionally rough regime (
 ${k}_{s}/{D}=$
0.129), the effect of roughness on JICF evolution exhibits a clear binary behaviour. With a thick incoming boundary layer (figure 14
b), the increased boundary-layer thickness reduces the local velocity, thereby intensifying the velocity shear at the jet–crossflow interface. This enhancement promotes the formation of stronger and more coherent positive-vorticity structures (A
2), which lift off and rise to significantly higher wall-normal positions (
 ${y}/{D}$
≈ 3). In contrast, when the incoming flow is thin (figure 14
c), the shear-layer vortices (A
3) undergo shedding and evolution patterns that closely resemble those observed over the smooth wall. Thus for both VR = 0.33 and VR = 1.0, switching between thin and thick incoming boundary layers induces a binary transition in JICF behaviour, alternating between regular shedding and pronounced vortex lift-off. This switching produces the strongest global fluctuations, and enhances sweeping-type unsteadiness. In the fully rough regime (
 ${k}_{s}/{D}=$
0.782), the shear-layer vortices (A
4) are embedded within a dense field of fragmented, small-scale vortices (figure 14
d). This abundance of fine-scale turbulence accelerates the breakdown of the shear-layer vortices, which undergo rapid fragmentation near
 ${x}/{D}$
≈ 2. The surrounding small-scale structures consume the energy of the larger vortices and inhibit their upward motion, preventing the strong sweeping unsteadiness observed in the transitionally rough case. As a result, the shear-layer vortex A
4 displays reduced vertical penetration, and the large-scale motion appears paradoxically more stable in its trajectory.
To quantitatively elucidate the distinction of the regime-driven binary flow behaviour, a spectral analysis is conducted at VR = 1.0. Specifically, the magnitude-squared coherence (González et al. Reference González, Rodríguez, Sagartzazu, Schumacher and Isasa2010) γ
2 is evaluated between the upstream near-wall streamwise velocity (
 ${x}/{D}=-1.8, 0 \lt$
 ${y}/{D} \lt 0.4$
) and the downstream jet exit absolute velocity (
 ${x}/{D}= 0, 0 \lt $
 ${y}/{D} \lt 0.4$
). This metric isolates the frequency-dependent, phase-locked linear coupling between the incoming boundary layer and the jet dynamics. The coherence is mathematically defined as
 \begin{equation} {\gamma }_{xy}^{2}\left(f\right)=\frac{| P_{xy}(f)| ^{2}}{P_{xx}(f)\,P_{yy}(f)}, \end{equation}
where P xx (f) and P yy (f) denote the power spectral densities of the respective signals, and P xy (f) represents their cross-power spectral density. A coherence value approaching unity signifies a robust, phase-locked correlation between the upstream and downstream flow fields at that specific frequency.
As illustrated in figure 15, the transitionally rough regime (
 ${k}_{s}/{D}=$
0.129) is distinguished by a singular, highly pronounced coherence peak at a characteristic low frequency St = 0.17, achieving a high magnitude (γ
2 > 0.7). This spectral signature manifests a distinct resonance lock-in mechanism compared to other surface regimes. That is, the intermittent thickness variations inherent to the boundary layer impose a localised, low-frequency dynamic forcing upon the downstream inclined jet, consequently triggering the distinct macroscopic alternation between the lift-off and regular shedding states. Conversely, this low-frequency resonance is absent in both the smooth baseline and the fully rough regime. In the fully rough regime, the low-frequency coherence breaks down into broadband turbulence, shattering the large-scale intermittent structures observed in the transitionally rough regime. Bereft of this sustained, coherent low-frequency forcing, the jet is weakly locked into the macroscopic binary mode-switching behaviour, demonstrating that the binary flow is an exclusive product of the transitionally rough regime and its unique intermittent dynamics.
Magnitude-squared coherence (γ
2) between the streamwise velocity in the upstream near-wall region and the absolute velocity at the downstream jet exit for (a) the smooth baseline, (b) the transitionally rough regime (
 ${k}_{s}/{D}=$
0.129), and (c) the fully rough regime (
 ${k}_{s}/{D}=$
0.782).

To recognise the unsteady dynamics of roughness-affected JICF, the extended spectral proper orthogonal decomposition (ESPOD) is utilised to quantitatively establish a correlation between the motions of two distinct fields: the original field (upstream roughness) and the target field (downstream JICF), via the principle of phase synchronisation (Zhang et al. Reference Zhang, Zhou, Tse, Wang, Niu and Mak2023a
). The standard SPOD procedure is performed on the input field (
I
) to extract its most energetic orthogonal structures (Towne, Schmidt & Colonius Reference Towne, Schmidt and Colonius2018; Schmidt & Colonius Reference Schmidt and Colonius2020) and the corresponding modal coefficients needed for phase synchronisation. The cross-spectral density is first estimated based on Fourier realisations (
 $\hat{\kern-0.75pt\boldsymbol{I}}$
) of the original field:
 \begin{equation} \boldsymbol{C}_{\!X}\boldsymbol{=}\frac{1}{N_{b}T}\hat{\kern-0.75pt\boldsymbol{I}}\!\boldsymbol{B}_{\!I}\hat{\kern-0.75pt\boldsymbol{I}}^{H} ,\end{equation}
where N b and B I are the number of Fourier realisations and the spatial inner product weighting matrix for X , respectively. The principal orthogonal spatial modes and their energies are obtained by solving the weighted eigenvalue problem
 \begin{equation} \boldsymbol{C}_{I}\kern-1pt\boldsymbol{B }_{\kern-1pt{I}}\boldsymbol{\varPsi }\boldsymbol{=}\boldsymbol{\varPsi\kern-1pt\varLambda } .\end{equation}
Here,
Ψ
contains the SPOD modes from original field (
 $\psi$
f,n
), and
Λ
contains the modal energies (λ
f,n
). Then the modal coefficients a
f,n
(l) are computed by projecting the Fourier realisations
 $\hat{\kern-0.75pt\boldsymbol{I}}^{(l)}$
onto the orthogonal SPOD modes
 $\psi$
f,n
:
 \begin{equation} a_{f,n}\left(l\right)=\Big\langle \hat{\kern-0.75pt\boldsymbol{I}}^{\left(l\right)},\psi _{f,n}\Big\rangle .\end{equation}
The modal coefficients from the original field are used to linearly extend the modes to the responding target field (
R
), enforcing phase synchronisation between the input structures and the output response. The non-orthogonal ESPOD modes
 $\phi$
f,n
(x
y
) of the target field are computed using the inverse transformation based on the shared modal coefficients:
 \begin{equation} \varphi _{f,n}\left(x_{R}\right)={\sum }_{l=1}^{N_{b}}\left(\frac{{a}_{f,n}^{*}(l)}{N_{b}T\lambda _{f,n}}\right){\hat{r}}_{f}^{\left(l\right)}\left(x_{R}\right) .\end{equation}
Therefore, the original and target fields can be reconstructed using the same set of modal coefficients, confirming that the modes (
 $\psi$
f,n
and
 $\phi$
f,n
) are synchronised across all Fourier realizations:
 \begin{align} \begin{cases} {\hat{i}}_{f}^{\left(l\right)}\left(x_{I}\right)={\sum }_{n=1}^{N_{m}}a_{f,n}(l)\,\psi _{f,n}(x_{I}),\\ {\hat{r}}_{f}^{\left(l\right)}\left(x_{R}\right)={\sum }_{n=1}^{N_{m}}a_{f,n}(l)\,\varphi _{f,n}(x_{R}). \end{cases} \end{align}
The ESPOD modal energy
 $\tilde{\lambda }_{f,n}$
, which quantifies the contribution of the synchronised mode
 $\phi$
f,n
to the total variance (E
R
) of the target field, is calculated using the SPOD eigenvalues and the squared spatial norm of the ESPOD modes:
 \begin{equation} \overline{E}_{R}=\int_{-\mathrm{\infty }}^{+\mathrm{\infty }}\sum_{n=1}^{N_{m}}\lambda _{f,n}\left\langle \varphi _{f,n}(x_{R}),\varphi _{f,n}(x_{R})\right\rangle\,{\rm d}f=\int_{-\mathrm{\infty }}^{+\mathrm{\infty }}\sum_{n=1}^{N_{m}}\tilde{\lambda }_{f,n}\,{\rm d}f .\end{equation}
Since the ESPOD framework relies on these foundational spectral estimations, a parameter sensitivity analysis is conducted for the individual input and target fields, where the corresponding modes remain stable across different window lengths (800–1500) and overlap ratios (40 % to 75 %), demonstrating the robustness of the basic spectral estimations. Therefore, to ensure an adequate number of Fourier realisations while effectively mitigating spectral leakage, window length 800 with a 50 % overlap is selected. It should be noted that due to their non-orthogonal nature (Zhang et al. Reference Zhang, Zhou, Tse, Wang, Niu and Mak2023a ), the resulting ESPOD target modes exhibit a certain degree of sensitivity to the modal coefficients calculated under different SPOD-insensitive parameter sets, leading to modest, localised variations in the spatial modal distributions, while the global modal behaviours remain robustly captured.
The instantaneous vertical velocity is examined to characterise the spatial lift-off behaviour of the JICF. Figure 16 presents the corresponding energy spectra for VR = 0.33, with modal distributions at St = 0.17 and 0.29 selected because they exhibit locally significant energy peaks. The JICF’s unsteady behaviour stems primarily from K–H shearing instability, with the corresponding St matching ranges reported in previous studies (Milani et al. Reference Milani, Ching, Banko and Eaton2020; Wang, He & Yan Reference Wang, He and Yan2022; Huang et al. Reference Huang, Xu, Vicano, Qu, Xiong, Zhou and Liu2026). At St = 0.17, the modal response becomes increasingly complex as roughness increases, spreading to cover both the near-wall field and the far field. In the smooth regime (figure 16
a), distinct, independent wavepackets are observed shedding from the orifice before undergoing rapid decay at
 ${x}/{D}$
≈ 4. For the transitionally rough regime (figure 16
b), a connection is established between the far field and the orifice-generated response. This linkage creates the visual impression that the far field is tugging the near-wall field upwards. The fully rough regime (figure 16
c) exhibits a pronounced interaction between far-field and near-wall regions. As shown by the black arrows, the spacing between the two paths first contracts at
 ${x}/{D}$
≈ 3, then expands downstream at
 ${x}/{D}$
≈ 4. For the upper arrow, upstream wavepackets inject energy into the near-wall structures; once merged, the combined wavepacket rapidly fans out with downstream development. The modal distribution at St = 0.29 corresponds to the higher-frequency component of the shearing instability. In the smooth-wall case, finer wavepackets are generated from the orifice, following an arch-like trajectory that peaks at
 ${x}/{D}$
≈ 3. This structure changes significantly in the transitionally rough regime, where the wavepacket becomes highly stretched and partially bifurcates downstream of
 ${x}/{D}$
≈ 4; its wall-normal evolution closely matches the observed binary shedding of positive vorticity (figures 13
b,c). Conversely, for the fully rough surface, the wavepacket originating at the orifice at St = 0.29 possesses a weak signal magnitude (green arrow). This is coupled with the continuous movement of wavepackets observed upstream to downstream along
 ${y}/{D}$
= 1 (yellow arrow), which strongly suppresses the hole-generated wavepackets. It is indicated that the response of the downstream dynamics remains governed by roughness-induced signals, leading to the inhibition of a low-velocity-ratio jet signal at this higher frequency (St = 0.29). Thus unlike the smooth and transitional rough regimes where the jet signal responds extensively at St = 0.29, the fully rough regime experiences rapid and widespread amplification at the lower-frequency signal (St = 0.17) due to the upstream energy injection.
Energy spectra and modal distributions for the vertical velocity of downstream JICF (VR = 0.33) at (a) smooth surface, (b)
 ${k}_{s}/{D}=$
0.129, and (c)
 ${k}_{s}/{D}=$
0.782. The red, black and blue lines denote the ESPOD energy, the energy associated with the upstream roughness, and the energy of the downstream JICF, respectively.

Figures 17(a–c) present the energy spectra and corresponding modal distributions for VR = 1.0, where St = 0.17, 0.25, 0.71 are selected as the locally dominant frequencies, respectively. For mode 1 at St = 0.17, the modal distribution in the smooth regime (figure 17
a) is highly disorganised, scattering across both the near and far fields. This structure indicates that the downstream flow dynamics does not respond to upstream input in a regular pattern, such that the signal associated with regular shedding is less sensitive to excitations at this frequency. When roughness is present, clear wavepackets are shed from the orifice, demonstrating a pronounced low-frequency coherence of the jet under roughness-induced upstream forcing. For the transitionally rough regime (figure 17
b), the wavepacket maintains a similar size from its inception until it begins to fan out and attenuate in signal strength at
 ${x}/{D}$
≈ 8. In contrast, the signals for the fully rough regime (figure 17
c) are found to be highly deformed, and decay at
 ${x}/{D}$
≈ 5. This rapid decay corresponds physically to the early fragmentation of the shear-layer vortices observed in the vorticity field (figure 14
d). We consider St = 0.25 as the frequency associated with more detailed shearing motion. At this frequency, the smooth regime induces clear, regular motion originating from the orifice with organised arch-like wavepackets that peaks at
 ${x}/{D}$
≈ 3, corresponding to the secondary lift-off effect in figure 10(a). In the transitionally rough regime, the near-wall and far-field wavepackets evolve independently. As indicated by the green arrows, two distinct evolutionary paths similarly emerge: the lower path resembles the regular shedding trajectory, while the upper path corresponds to the lift-off motion observed under strong boundary-layer thickening (figure 14
b). These dual paths arise from the continued influence of jet-dominated shear-layer instability on the binary flow behaviour, allowing the low-frequency coherence of the shearing structures to remain detectable. The fully rough regime exhibits a far-field energy injection pattern similar to that observed at VR = 0.33. As indicated by the black arrows, the spacing between the two flow paths initially contracts at
 ${x}/{D}$
≈ 4, and subsequently expands downstream at
 ${x}/{D}$
≈ 5. This pattern demonstrates that at this high velocity ratio, the signal induced by the fully rough regime remains active as the response, and injects energy to amplify the JICF signal. Nonetheless, the modal response signal at VR = 1.0 is less pronounced than at VR = 0.33 because the high-momentum jet is more resistant to upstream input. The higher-frequency mode at St = 0.79 displays a monotonic dependence on roughness where the spatial extent of the wavepacket shrinks with increasing roughness. In the fully rough regime, the wavepacket expands rapidly at
 ${x}/{D}$
≈ 2 but vanishes by
 ${x}/{D}$
≈ 5, associated with the accelerated decay under strong small-scale turbulence of high frequency. In summary, transitionally rough regimes induce a binary evolutionary trajectory that accelerates the stretch of low-frequency coherence associated with K–H structures. For fully rough regimes, the low-frequency coherence is strongly expanded as upstream signals are injected into the orifice-generated signals, while the high-frequency motions decay rapidly, associated with the intensified small-scale fragmentation. Consequently, the multi-frequency unsteadiness of the JICF becomes progressively dissipated.
Energy spectra and modal distributions for the vertical velocity of downstream JICF (VR = 1.0) at (a) smooth surface, (b)
 ${k}_{s}/{D}=$
0.129, and (c)
 ${k}_{s}/{D}=$
0.782.

The motion of the jet centreline is examined to elucidate the roughness-affected sweeping mechanism. The instantaneous centreline trajectory provides a direct measure of the macroscopic dynamics of the jet core (Zhang et al. Reference Zhang, Wang, Wen, He, Liu and Zhou2022). The centreline of the JICF, denoted as y 0(x 0,t), is defined as the time-resolved path of the streamline that passes through the centroid of the jet orifice, where x 0 and y 0 represent the streamwise and vertical coordinates, respectively. In the present analysis, x 0 is sampled at uniformly spaced positions, while y 0 varies with time. To decouple and interpret the complex dynamical behaviour of the centreline, singular value decomposition is employed to extract the most energetic and structurally meaningful modes:
 \begin{equation} {y}_{0}'\left(x_{0},t\right)=y_{0}\left(x_{0},t\right)-\overline{y}_{0}\left(x_{0},t\right)=\sum_{k=1}^{r}{\Phi} \varLambda W^{\rm T} ,\end{equation}
where ΛW
T denotes the temporal coefficient of each mode, and Φ represents the corresponding spatial mode. The first three modes are selected as they capture the most energetic components of the centreline dynamics. Across all velocity ratios, figure 18 shows that mode 1 exhibits no distinct peak, whereas modes 2 and 3 contain one and two identifiable peaks, respectively. These peaks correspond to the positions where the modal deformation of the centreline reaches its maximum for each mode. Mode 1, lacking a clear peak, reflects the macroscopical sweeping of the jet. For both VR = 0.33 and VR = 1.0, roughness increases the modal amplitude relative to the smooth case, with the transitionally rough condition (
 ${k}_{s}/{D}=$
0.129) producing the strongest enhancement of large-scale motion. The slope of mode 1 at VR = 1.0 is generally smaller than at VR = 0.33 over
 ${x}/{D}=$
0−2, indicating that freshly ejected high-momentum jets have not yet strongly invaded the crossflow, thereby exhibiting stronger resistance to sweeping. At VR = 0.33 (figure 18
a), the profiles of modes 2 and 3 show a clear trend: with increasing roughness, the modal peaks first shift upstream, then shift slightly downstream. Relative to the smooth surface, the streamwise shift reaches approximately 1.6D for mode 2 and 0.9D for mode 3. At VR = 1.0 (figure 18
b), the variations in modes 2 and 3 are much less pronounced, making the trend less visually apparent. To quantify these effects, the streamwise locations of the peaks – denoted as P
2 for mode 2, and P
3–1 and P
3–2 for mode 3 – are extracted and shown as histograms. Similar trends appear for both velocity ratios: in the transitionally rough regime (
 ${k}_{s}/{D}=$
0.129), the energy peaks shift upstream, indicating that disturbance amplification mechanistically initiates earlier along the streamwise direction. In contrast, in the fully rough regime (
 ${k}_{s}/{D}=$
0.782), the peaks shift back downstream, reflecting a recovery towards the smooth-wall behaviour. This spatial trend is coherently consistent with the ESPOD analysis, which reveals the rapid multi-frequency dissipation of the JICF dynamics and the subsequent attenuation of unsteadiness. It can therefore be deduced that at higher velocity ratios, for the transitionally rough regime, intermittent variations in boundary-layer thickness will continuously unstabilise the shedding shear-layer vortices, macroscopically resulting in the persistence of the sweeping unsteadiness. Conversely, for the fully rough regime, the high-momentum jet core at elevated VR is anticipated to exhibit greater resistance to the fine-scale, fragmented incoming turbulence. Thus the localised modulation and accelerated dissipation effects induced by the fully rough surface are expected to diminish.
Singular value decomposition analysis on centreline motions across different roughness regimes and VR values. Plots show the first three modes for (a) VR = 0.33 and (b) VR = 1.0. The images on the right-hand side are histograms of the streamwise locations (x/D) corresponding to the modal peak points (P 2, P 3–1, P 3–2).

3.4. Spatial developing mechanism of downstream JICF
The contours of three-dimensional TKE at streamwise locations
 ${x}/{D}=$
1, 3, 5 for different upstream roughness regimes and VRvalues are presented in figure 19. Under smooth-surface conditions, the TKE reaches its maximum at
 ${x}/{D}=$
3 (figure 19
a). This delayed peak indicates that the jet core remains relatively stable near the orifice, producing weak initial fluctuations at
 ${x}/{D}=$
1; stronger fluctuations develop downstream at
 ${x}/{D}=$
3, followed by TKE decay due to turbulent dissipation. In contrast, the transitionally rough regime (
 ${k}_{s}/{D}$
= 0.129) exhibits the largest overall peak TKE among all roughness states (figure 19
b). As highlighted by the white dashed rectangle, this regime produces a strong fluctuation region that persists farther downstream and spreads more broadly in the vertical direction. For the fully rough regime (
 ${k}_{s}/{D}$
= 0.782), the maximum TKE appears immediately at
 ${x}/{D}=$
1 (figure 19
c), followed by a rapid downstream decay. This behaviour suggests that the fragmented upstream vortex structures characteristic of the fully rough regime undergo an intense, instantaneous interaction with the JICF upon initial contact, leading to immediate energy transfer and subsequent rapid dissipation. Additionally, pronounced TKE patches appear on both sides of the main jet-induced high-TKE core, with magnitudes comparable to the peak JICF-generated TKE at VR = 0.33. These observations point to a non-negligible contribution from the fully rough regime to the overall turbulence field, with indications of a degree of independence from other flow components.
Contours of TKE along streamwise positions (
 ${x}/{D}=$
1, 3, 5) at various roughness regimes and VR values (a) Smooth, (b)
 $k_{s}/D=0.129$
and (c)
 ${k}_{s}/{D}=0.782$
.

Figure 20 illustrates how upstream roughness influences the CRVP topology through the distribution of swirling strength. Under the smooth-wall condition (figure 20
a), the CRVP maintains a more circular and more symmetric cross-sectional shape across all VR. As expected, increasing the velocity ratio enhances the CRVP swirling strength at a given
 ${x}/{D}$
due to the higher jet momentum. Additionally, for any fixed VR, the swirling strength decreases monotonically with increasing streamwise distance, reflecting the gradual turbulent dissipation of the coherent structure. In the transitionally rough regime (
 ${k}_{s}/{D}$
= 0.129; figure 20
b), the CRVP shape becomes noticeably altered, as highlighted by the black dashed rectangle. Relative to the smooth baseline, the CRVP exhibits a stretching in the wall-normal direction and a compression in the spanwise direction. This modified topology directly stems from the unsteady upstream dynamics. As described in § 3.3, this roughness regime generates the strongest sweeping unsteadiness in the JICF, dispersing instantaneous vortex structures over a wider wall-normal extent. Time-averaging subsequently smears these motions, producing a CRVP that appears vertically elongated and laterally narrowed. The fully rough regime (
 ${k}_{s}/{D}=$
0.782; figure 20
c) induces the most pronounced asymmetry and differential dissipation within the CRVP. At VR = 0.33, the positive component of the CRVP at
 ${x}/{D}=$
1 is suppressed and only begins to expand further downstream (
 ${x}/{D}=$
3) before dissipating at
 ${x}/{D}=$
5. In contrast, the negative component shows slight expansion at
 ${x}/{D}=$
1 but is nearly extinguished by
 ${x}/{D}=$
3, indicating a prematurely initiated decay on this side. At VR = 0.67, the CRVP remains relatively symmetric near the orifice (
 ${x}/{D}=$
1), but asymmetry emerges by
 ${x}/{D}=$
3, mirroring the VR = 0.33 behaviour: the positive component develops a flatter topology, whereas the negative component becomes vertically stretched. The positive component consistently retains a stronger maximum swirling strength, allowing its core to persist longer. At VR = 1.0, the CRVP topology lies between those of the smooth and transitionally rough regimes, and shows no distinct asymmetry across the examined planes. This indicates that at the higher VR, the jet possesses greater resistance to asymmetric upstream perturbations and is modulated mechanistically by the large-scale, moderately intermittent structures advected from the roughness-affected mainstream.
Contours of swirling strength along streamwise positions (
 ${x}/{D}=$
1, 3, 5) at various roughness regimes and VR values (a) Smooth, (b)
 $k_{s}/D=0.129$
and (c)
 ${k}_{s}/{D}=0.782$
.

The spatially asymmetric development of the CRVP observed at VR ≤ 0.67 suggests the presence of an additional mechanism introduced by the fully rough regime. To elucidate how upstream surface conditions influence downstream oblique JICF, standard SPOD analysis is performed on the time-resolved streamwise velocity field at the upstream plane (
 ${x}/{D}=$
−1.8). Modes corresponding to the global maximum energy at this upstream station are selected for visualisation, as shown in figure 21(a), with their spatial distributions depicted in figure 21(b). For the smooth wall, no distinct energy peak is observed due to the monotonically decreasing variation; thus St = 0.105 is used for comparison. Under smooth-wall conditions, the dominant mode exhibits strong coupling between large-scale coherence in the outer layer and near-wall structures. This interconnectedness indicates efficient energy transfer from the outer large-scale motions down to the wall region. In the transitionally rough regime (
 ${k}_{s}/{D}=$
0.129), the large-scale coherence in the outer region shrinks noticeably, weakening the correlation between outer-layer motions (above the solid line) and near-wall fluctuations. Simultaneously, independent small wavepackets emerge closer to the wall, indicating that roughness elements begin to disrupt the coherent energy transfer from the outer layer, and thereby break the strong top-down coupling characteristic of smooth-wall flows. These near-wall wavepackets remain periodic and independent, but exhibit comparatively weaker energy. In the fully rough regime (
 ${k}_{s}/{D}=$
0.782), the outer-layer large-scale coherence is strongly attenuated, reflecting the breakdown of orderly unsteady motion into smaller, more chaotic turbulence that cannot be captured effectively at the dominant mode frequency. Conversely, the near-wall region experiences amplified wavepackets, which are larger in spatial extent and stronger in energy compared to the transitionally rough regime. These near-wall structures remain periodic and independent, but possess sufficient energy to influence downstream dynamics, likely contributing to the CRVP asymmetry observed in figure 20(c) at VR ≤ 0.67.
(a) The SPOD modal energy spectra and (b) corresponding modal distributions at x/D = −1.8, for smooth surface,
 ${k}_{s}/{D}=$
0.129 and
 ${k}_{s}/{D}=$
0.782.

Contours of (a) the dominant mode at St = 0.07 (the projected upstream roughness morphology is marked as a magenta dashed line) and (b) the Reynolds shear stress at
 ${x}/{D}=$
1 for VR = 0.33 under the fully rough regime.

Originating from
 ${x}/{D}=$
−1.8, the intrinsic three-dimensionality and unsteadiness of the JICF are strongly modulated by the upstream roughness, leading to pronounced asymmetry in CRVP evolution, particularly at VR ≤ 0.67. The SPOD analysis of the instantaneous streamwise velocity at VR = 0.33 and
 ${x}/{D}=$
1 yields the modal distribution shown in figure 22(a). The Reynolds shear stress distribution in figure 22(b) is provided as a representative measure of the enhanced turbulent momentum exchange, as the remaining Reynolds stress components exhibit similar spatial structures. The far-field wavepackets in figure 22(a) almost align laterally with those at the upstream plane (
 ${x}/{D}=$
−1.8; figure 21
b), indicating the inheritance of upstream-induced structures. This periodically modulated spatial modal distribution produces a measurable periodicity in the Reynolds stress field: as marked by the solid lines, the red and blue contours correspond to peaks and troughs, with red indicating strong turbulence, and blue representing relative deficits. Previous studies (Barros & Christensen Reference Barros and Christensen2014; Ma et al. Reference Ma, Xu, Sung and Huang2023) have shown that such Reynolds stress gradients generate periodic secondary flows, giving rise to localised upwash and downwash motions. Accordingly, regions of strong Reynolds stress define LMP, while weaker regions define HMP. In this modal framework, red regions correspond to upwash zones (LMP) and blue regions to downwash zones (HMP). The CRVP, also shown in figure 22(a), exhibits an asymmetric distribution relative to
 ${z}/{D}=0$
. The negative component of CRVP (
 $z/D\lt0$
) on the LMP-dominated side experiences upwash, which stretches and intensifies local turbulence, leading to rapid vortex expansion and decay in the near-to-mid field. Conversely, the positive CRVP component (
 ${z}/{D}$
>0) on the HMP side undergoes inhibiting downwash, suppressing vortex expansion and turbulent breakdown, and producing a flatter, more compact cross-sectional profile. This indicates delayed dissipation on the HMP side, resulting in more sustained streamwise development originating from the jet. To address the potential influence of spanwise geometric alignment, the projected morphology of the upstream roughness elements is superimposed onto figure 22(a) with a magenta dashed line. It reveals that the left and right legs of the CRVP are situated at similar relative spanwise positions to the roughness array, yet they exhibit distinctly different evolutionary fates. Furthermore, the spatial scale of the identified SPOD wavepacket is approximately 2–3 times larger than a single roughness element. This indicates that this dynamics is relatively independent of individual elements; instead, it operates through the collective merging of the upstream roughness wakes to form a macroscopic modulation (Kaminaris et al. Reference Kaminaris, Balaras, Schultz and Volino2023; Ma et al. Reference Ma, Xu, Sung, Tian and Huang2025). This demonstrates that the observed asymmetry is not a mere geometric artefact, but originates from a more intrinsic, larger-scale periodic motion. For the low-velocity-ratio case (VR = 0.33), these periodic secondary flow effects are asymmetrically significant from the orifice (
 ${x}/{D}=$
1). The positive CRVP component (HMP side) is constrained by the local high-momentum region, while the negative component (LMP side) experiences stronger turbulence, producing rapid expansion and decay by
 ${x}/{D}=$
3. At the moderate velocity ratio (VR = 0.67), the stronger initial jet temporarily resists these influences, producing a nearly symmetric CRVP at
 ${x}/{D}=$
1. Downstream (
 ${x}/{D}=$
3), the asymmetry becomes pronounced, with the vortex structure stretching on the LMP side, and flattening on the HMP side. By
 ${x}/{D}=$
5, both vortices have largely dissipated; however, thresholded contours indicate that the positive CRVP component on the HMP side still occupies a larger effective spatial area.
Reproduced from a previous study analysing unsteady jet scalar dynamics over a nominally identical rough configuration (Huang et al. Reference Huang, Wang, Li, Chen, Zhou, Peng and Liu2024a
), figure 23 shows that the fully rough regime exhibits pronounced asymmetry at VR = 0.33. In this regime, mode 1 is dominated by streamwise pulsations, whereas mode 2 reflects lateral sweeping unsteadiness. Their study further revealed a scalar-mode asymmetry: in the region
 ${z}/{D}$
> 0, streamwise pulsations are more pronounced, while sweeping motions are comparatively weaker. The solid lines indicate the lateral positions of the LMP and HMP identified in figure 22. This observation aligns with the present results, where the
 ${z}/{D}$
> 0 region corresponds to the HMP, resulting in delayed streamwise decay and a more compact vortex topology, in contrast to the LMP-dominated side.
Unsteady analysis on the wall-scalar field for JICF (
 $\textit{VR}=0.33$
) under various upstream surface regimes (Huang et al. Reference Huang, Wang, Li, Chen, Zhou, Peng and Liu2024a
): (a) most energetic and (b) second most energetic modal distributions.

In summary, schematic diagrams have been developed to illustrate how different upstream surface regimes affect the JICF. Figure 24(a) represents the smooth regime as the baseline. Under the transitionally rough regime (figure 24 b), the incoming mainstream exerts a predominantly global influence: strong intermittent variations in boundary-layer thickness induce a binary flow behaviour in the downstream JICF, enhancing sweeping motions and producing a vertically stretched CRVP in the time-averaged sense. In contrast, the fully rough regime (figure 24 c) primarily generates periodic secondary flows that act locally on different CRVP components. Here, the HMP associated with downwash motions suppresses the vertical growth of one CRVP component, delaying its decay, while the LMP associated with upwash motions stretches the other component vertically, accelerating its decay.
Schematic illustration of CRVP development in the JICF under different upstream roughness regimes: (a) smooth regime, (b) transitionally rough regime, and (c) fully rough regime.

4. Conclusions
The experimental investigation revealed the distinct physical mechanisms through which upstream surface roughness modulates both the boundary layer and the behaviour of an inclined JICF, using RIM-based PIV/SPIV measurements. In the transitionally rough regime (
 ${k}_{s}/{D}=$
0.129), the upstream boundary layer exhibits strong intermittent variations in thickness, as confirmed by energy spectrum analysis showing an emerging spectral peak while preserving multi-scale coherence. This intermittency imposes a global modulation on the downstream JICF, triggering a binary flow behaviour – alternating lift-off and regular shedding – in the JICF, producing a pronounced vertically stretched CRVP due to enhanced sweeping unsteadiness on a time-averaged basis. The ESPOD analysis further reveals that this binary state drives a bifurcation of the low-frequency coherence, producing distinct evolutionary pathways that correspond to a prematurely initiated centreline streamwise amplification of disturbances. Mechanistically, the transitionally rough regime generates the peak TKE within the JICF field, demonstrating that enhanced boundary-layer turbulence exerts a non-monotonic influence on jet stability. In contrast, the fully rough regime (
 ${k}_{s}/{D}=$
0.782) induces rapid fragmentation of near-wall streaks. The ESPOD analysis indicates that this fragmentation accelerates the decay of multi-frequency coherence. In particular, the low-frequency component is triggered into an ephemeral amplification through upstream signal injection. The dynamical peaks of the centreline shift back downstream in the fully rough regime, reflecting a partial recovery towards smooth-wall behaviour, corroborated by the ESPOD evidence of rapid multi-frequency dissipation and the associated attenuation of large-scale unsteadiness. This secondary flow mechanism is directly linked to the observed asymmetric development of the CRVP at lower VR ≤ 0.67: the CRVP component over the HMP is vertically suppressed with delayed decay, whereas the component over the LMP is vertically stretched and decays more rapidly. Overall, this study highlights how different roughness regimes distinctly modulate JICF dynamics, deepening our fluid-mechanical understanding. Guided by the physically scaled links (
 ${k}_{s}/{D}$
), these findings provide a valuable mechanistic basis for practical applications involving roughness-affected jets in crossflow. To uncover the underlying physics without the confounding effects of geometric complexity, the current study utilised canonical flow and roughness configurations. With these fundamental mechanisms now identified, future studies could systematically evaluate the strong heterogeneous and anisotropic effects of roughness morphologies on JICF dynamics, incorporating upstream–downstream coupling effects. Furthermore, broadening the investigated flow conditions to encompass wider velocity ratios and practical engineering scales is essential to establish a more comprehensive regime map for these structural modulations. Ultimately, building upon these mechanistic findings, further research could develop robust active and passive flow control strategies tailored for engineering scenarios of roughness-affected JICFs.
Acknowledgements
The authors gratefully acknowledge financial support for this study from the National Natural Science Foundation of China (grant nos 12472284 and 52276033).
Declaration of interests
The authors report no conflict of interest.