Introduction
Heterogeneous catalysts based on metal nanoparticles are invaluable to the production of many industrially important chemicals and pharmaceuticalsReference Ertl, Knozinger and Weitkamp1 and as protection for the environment, as exemplified by catalytic converters.Reference Balaj, Balteanu, Rossteuscher, Beyer and Bondybey2 Despite many decades of development and refinement, most industrial catalysts still employ nanoparticles with broad size distributions and poorly defined shapes. By replacing these nanoparticles with uniform, shape-controlled nanocrystals, it is possible to markedly enhance the performance of many catalytic systems in terms of activity, selectivity, and stability.Reference Somorjai and Kliewer3
Computational simulations and experimental studies involving bulk single-crystal substrates have long established that the activity and selectivity of a heterogeneous catalyst, for a structure-sensitive reaction, can both be enhanced by controlling the arrangement of atoms on the surface. For example, it has been demonstrated that bulk substrates of Pt can selectively catalyze different types of chemical reactions depending on the surface structure, with the {100} and {210} facets being most active for reactions involving H2 and CO, respectively (see the following section).Reference Falicov and Somorjai4,Reference Sander, Imbihl, Schuster, Barth and Ertl5 Similar dependences have also been observed for many other different combinations of metals and reactions.Reference Zhou and Li6 These examples clearly demonstrate the promise of shape control in maximizing the cost effectiveness and achieving sustainable use of many rare metals. The essence of these studies, however, could not be realized until very recently when it became possible to synthesize metal nanocrystals with controlled shapes, and thus well-defined facets on the surface.Reference Xia, Xiong, Kim and Skrabalak7 Thanks to recent advances in shape-controlled synthesis, now is an exciting and rewarding time to rationally design the next generation of catalysts with unparalleled performance for a myriad of reactions by integrating our synthetic capability with a mechanistic understanding of the reaction chemistry. In this article, we discuss the impact of shape-controlled metal nanocrystals on catalysis, together with a brief summary of the solution-based methods developed for their synthesis. We highlight the practical benefits of these materials in the context of practical reactions, such as the oxygen reduction and formic acid oxidation.
Shape control and its importance in heterogeneous catalysis
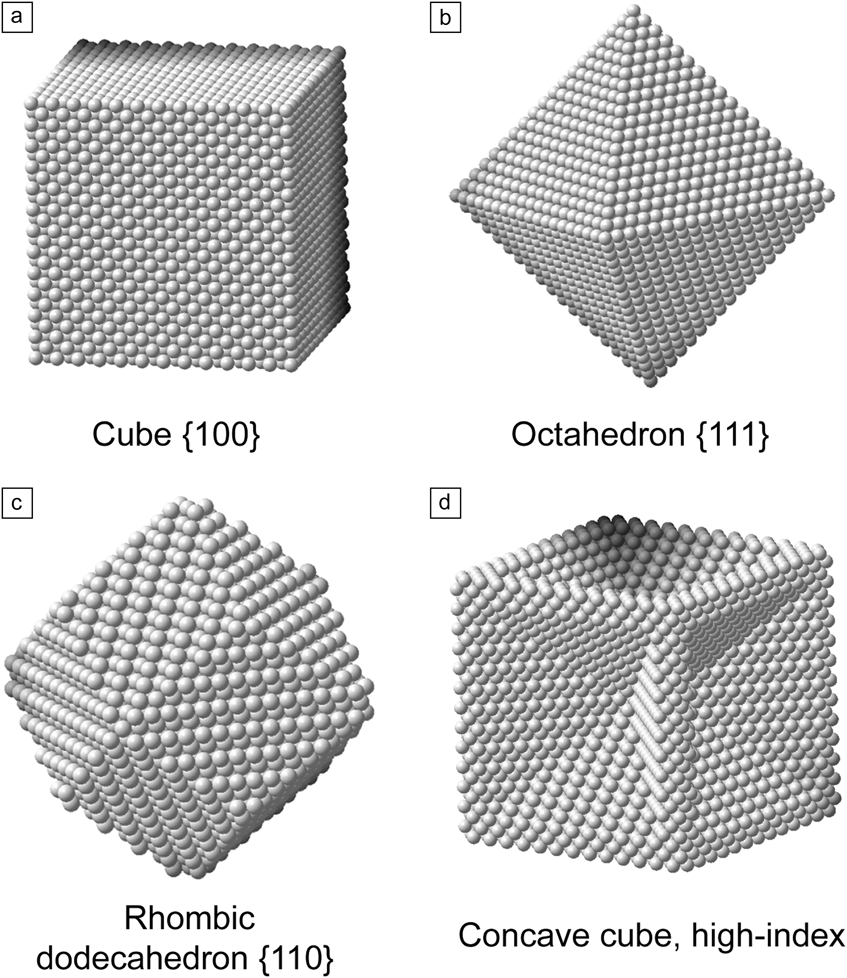
At a fundamental level, shape control allows us to maneuver the types and proportions of facets that encase the surface of a nanocrystal. These crystallographic facets, each characterized by a specific geometric arrangement of atoms, are commonly identified by their Miller indices {hkl}. Figure 1a–c illustrates nanocrystals of a face-centered cubic (fcc) metal in three basic shapes, each enclosed by a single type of crystal facet on all sides. Examples of metals that crystallize in the fcc structure include Au, Ag, Pd, and Pt. The cube in Figure 1a is enclosed by six {100} facets with a square symmetry, while the octahedron in Figure 1b is covered by eight {111} facets with hexagonal symmetry. Each type of facet possesses a characteristic surface free energy, γ{hkl}, and for the low-index facets under vacuum, they follow the trend of γ{110} > γ{100} > γ{111}.Reference Wang8 The difference in free energy among various types of facets is instrumental in controlling the shape of a nanocrystal during synthesis as well as its resultant catalytic properties. It is the variation in characteristic atomic structure and surface free energy that allows a single element to show multiple catalytic behaviors, depending on the crystal facet involved in the reaction.Reference Burda, Chen, Narayanan and El-Sayed9 For example, it has been shown that hydrogenation of benzene on a Pt catalyst covered by {111} facets produces a mixture of cyclohexane and cyclohexene.Reference Bratlie, Kilewer and Somorjai10 In comparison, an identical reaction catalyzed by a Pt catalyst covered by {100} facets produces only cyclohexene. It has also been reported that the rate of ammonia formation from a stoichiometric mixture of gaseous hydrogen and nitrogen on an Fe catalyst with {111} facets was 17- and 418-fold higher than the same reaction catalyzed by Fe catalysts with {100} and {110} facets, respectively.Reference Spencer, Schoonmaker and Somorjai11
Examples of four types of shape-controlled nanocrystals. (a–c) Nanocrystals enclosed by a specific set of low-index facets: cube enclosed by {100} facets with a square lattice; octahedron enclosed by {111} facets with a hexagonal lattice; and rhombic dodecahedron enclosed by {110} facets with a rectangular lattice, respectively. (d) A concave nanocube enclosed by 24 high-index facets.

Besides the common shapes shown in Figure 1a–c, there exist nanocrystals composed of so-called high-index facets, denoted by at least one Miller index exceeding 1.Reference Zhang, Jin and Xia12 As an example, Figure 1d shows a concave nanocube enclosed by a total of 24 high-index facets. Compared with low-index facets, these surfaces are characterized by a higher free energy and a much higher density of steps and kinks composed of atoms with a low number of the nearest neighbor atoms, denoted by the coordination number (CN). This unique feature makes these nanocrystals highly desirable for use in various types of catalytic reactions. It should be pointed out, however, that the same properties that make these nanocrystals catalytically active, such as high densities of steps and kinks, also make them susceptible to deterioration in the harsh physical and chemical environments of a typical reaction. This issue needs to be addressed before these nanocrystals can be translated from academic studies to real-world applications.
Synthetic approaches to shape control
Over the past decade, metal nanocrystals with many different shapes have been synthesized by our group and others.Reference Xia, Xiong, Kim and Skrabalak7 While numerous routes have been developed, solution-phase synthesis has shown the most remarkable capability, reproducibility, and versatility in controlling the shape (and size) of metal nanocrystals. Examples of metal nanocrystals produced using this approach include those with low-index facets such as cubes, octahedra, tetrahedra, cuboctahedra spheres, bars, right bipyramids, decahedra, icosahedra, and pentagonal rods/wires from metals as diverse as Cu, Ag, Au, Pd, Pt, and Rh (as well as their alloys). Additionally, nanocrystals with high-index facets such as concave cubes/octahedra, octapods, and dendritic structures have also been prepared.Reference Zhang, Jin and Xia12 For a recent review, please refer to our last article in MRS Bulletin.Reference Xia, Xia, Wang and Xie13
The formation of nanocrystals can be generally divided into two major steps. The first step involves the homogeneous nucleation and subsequent formation of seeds when a salt precursor is reduced or decomposed. In this step, different types of seeds can be created, including those with single-crystal, singly twinned, and multiply twinned structures.Reference Xia, Xiong, Kim and Skrabalak7 Each type of seed will then evolve into nanocrystals with a unique shape, depending on the reaction conditions. For example, single-crystal seeds evolve into cubes and octahedra depending on the surface capping agent (see the detailed discussion below) present in the reaction solution,Reference Zeng, Zheng, Rycenga, Tao, Li, Zhang, Zhu and Xia14 while multiply twinned seeds will result in the formation of larger decahedra, pentagonal rods, and wires.Reference Sun, Mayers, Herricks and Xia15 Since the various types of seeds tend to nucleate simultaneously during the initial stage of a synthesis, one would obtain a mixture of nanocrystals with different shapes and twin structures. Therefore, it is crucial to control the seed composition in an effort to achieve a high output of the desired product.
Selective dissolution, also known as oxidative etching,Reference Zheng, Zeng, Ruditskiy, Liu and Xia16 offers such a solution by removing the twinned seeds and thereby increasing the yield of the single-crystal product. This process relies on the reaction between high-energy twin defects and a combination of oxygen and ionic species such as halides, with the pair constituting the etchant. The strength of an etchant can be tuned by varying the concentration and the type of the halide ion. For example, it was found that, during the synthesis of Ag nanocubes, replacing Cl– with Br– would remove only the multiply twinned seeds, allowing the singly twinned seeds to evolve into right bipyramids (angles between two of the three bipyramid edges at each apex are 90°).Reference Wiley, Xiong, Li, Yin and Xia17 In a series of recent studies, we demonstrated that the twin structure included in the seeds could be controlled by adjusting the reaction kinetics.Reference Hwang, Wang, Ruditskiy, Zhao, Zhang, Liu, Ye and Xia18 In general, the reduction rates for generating seeds with different types of twin structures tend to decrease in the order of single-crystal > singly twinned > multiply twinned > stacking faults. By using a proper reducing agent, together with optimization of other parameters such as temperature, precursor type, and precursor concentration, we were able to generate a specific type of seed during self-nucleation.Reference Zhu, Zeng, Lu, Liu, Gu and Xia19
The second step of a synthesis involves the growth of the seed via constant deposition of the newly formed metal atoms. In this step, the seed can be directed to evolve into a nanocrystal with a specific shape through multiple strategies, including (1) the use of a capping agent to selectively bind to, and thus single out, the desired facet;Reference Xia, Xiong, Kim and Skrabalak7,Reference Zeng, Zheng, Rycenga, Tao, Li, Zhang, Zhu and Xia14,Reference Peng, Xie, Park, Xia and Xia20 (2) control of the reduction kinetics and surface diffusion;Reference Xia, Xie, Liu, Peng, Lu, Wang, Kim and Xia21 and (3) integration with other processes such as etching and galvanic replacement.Reference Xia, Wang, Ruditskiy and Xia22,Reference Liu, Zheng, Zheng, Guo and Xia23 Figure 2 shows three representative strategies that involve the use of facet-selective capping, surface diffusion, and oxidative etching in conjunction with re-deposition, respectively, for the formation of Ag (Figure 2a) and Pd nanocrystals (Figure 2b–c) with different shapes. By manipulating the respective experimental parameters, it is possible to attain a spectrum of facet complexity, from low-index octahedra to high-index octapods, as well as obtain tight control over particle size for the final products.
Three different strategies for controlling the shape, and thus facets, of nanocrystals. (a) Facet selection through the use of a capping agent. When an Ag single-crystal seed is used, it will evolve into a cube or octahedron, depending on whether the capping agent selectively binds to {100} or {111} facets. Modified with permission from Reference 14. © 2010 American Chemical Society. (b) Shape control through manipulation of the surface diffusion rate (R diffusion) relative to the atom deposition rate (R deposition). When surface diffusion is much lower than atom deposition, concave and multipod structures are created. The opposite relationship leads to the formation of truncated cubes and octahedra. Modified with permission from Reference 21. © 2013 National Academy of Sciences. (c) Shape control through the use of oxidative etching and subsequent reduction and regrowth on a Pd nanocube. The size of the resultant Pd octahedra increases as the ratio of etching-to-regrowth rates (R etching to R regrowth, respectively) decreases. Modified with permission from Reference 23. © 2013 American Chemical Society. Note: PVP, poly(vinyl pyrrolidone); CA, citric acid.
A facet-selective capping agent works by altering the relative free energies of different crystal facets through chemisorption, thus influencing their growth rates.Reference Xia, Xiong, Kim and Skrabalak7 For example, when single-crystal, spherical seeds of Ag, composed of both {100} and {111} facets, are allowed to grow in the presence of poly(vinyl pyrrolidone) (PVP), nanocubes are obtained as the final product (Figure 2a).Reference Zeng, Zheng, Rycenga, Tao, Li, Zhang, Zhu and Xia14 This is a result of the selective capping effect of PVP for the {100} facets, which lowers surface free energy and retards growth. In comparison, Ag octahedra enclosed by {111} facets are obtained when PVP is replaced by sodium citrate or citric acid due to their selective binding to the Ag{111} facets. Furthermore, a capping agent can be used to physically block certain regions on the surface of a seed, forcing newly formed atoms to be deposited on the unprotected facets only.Reference Xie, Lu, Xie, Wang, Kim and Xia24 This approach can be used to generate bimetallic nanocrystals with precisely controlled spatial distributions of various elements, which may provide a useful method for enhancing catalytic activity and stability.
Manipulation of surface diffusion allows us to generate structures of varying complexity simply by altering the reaction temperature.Reference Xia, Xie, Liu, Peng, Lu, Wang, Kim and Xia21Figure 2b shows the mechanism responsible for this control pathway, as well as some of the accessible nanostructures derived from cubic seeds of Pd. The seeds contain Br– ions chemisorbed on {100} facets, which act to block any direct deposition onto the side faces.Reference Peng, Xie, Park, Xia and Xia20,Reference Xie, Lu, Xie, Wang, Kim and Xia24 At relatively low temperatures, and consequently low rates of surface diffusion, the newly formed atoms are mainly deposited on the unprotected {111} corner facets and confined to these sites. This leads to the formation of octapods due to the successive depositions only at corner sites. When the temperature is increased, the resultant increase in the rate of surface diffusion causes the newly deposited atoms to move away from their initial deposition sites and onto the edges, and then the side faces, of the cubic seeds. The result is a gradual transformation of the cubic seeds into concave cubes, truncated cubes, and truncated octahedra.
As an immediate application in catalysis, this method can be used to cover the corners and edges of a Pd nanocube with a frame composed of Rh, a metal possessing a higher melting point than Pd. The resulting concave nanocube showed remarkably improved thermal stability compared to pristine Pd cubes, with the shape being retained even after heating at 500°C for 60 min.Reference Lu, Wang, Xie, Xia and Kim25 A similar approach has also been applied by our group to the synthesis of Pd, Pt, Rh, and Pt-Rh concave nanocubes.Reference Zhang, Jin and Xia12 This approach can also be used to deposit ultrathin, smooth layers of different metals onto the surface of various seeds. We have demonstrated that with the aid of surface diffusion, we could create a uniform, conformal shell of Pt, only a few atomic layers thick, on a Pd nanocrystal.Reference Xia, Xie, Liu, Peng, Lu, Wang, Kim and Xia21 This allows us to obtain an excellent catalytic surface while maintaining an extremely low loading (i.e., mass of material used) of an expensive metal such as Pt or Rh.
A third method for shape control involves the use of etching and/or galvanic replacement of the nanocrystals. For example, a combination of selective etching of specific facets, reduction of the dissolved ions, and subsequent re-deposition of the atoms can generate nanocrystals with varying shapes and sizes simply by changing the concentration of the etching species present in the system. Figure 2c shows the mechanism behind this approach. Using this method, we demonstrated that Pd nanocubes with sharp corners could be transformed into octahedra through the dissolution of corner atoms, followed by their reduction and re-deposition onto the side faces.Reference Liu, Zheng, Zheng, Guo and Xia23 By lowering the concentration of Cl– ions in the etchant and thereby reducing the rate of etching relative to the rate of redeposition, we could obtain Pd octahedra with increased sizes. This result is significant since it allows us to directly control the size of the octahedra, which tend to stop growing upon attaining the octahedral shape during a conventional growth process. Furthermore, a variant of etching known as galvanic replacement, an electrochemical reaction during which a metal with a lower reduction potential is dissolved, and replaced, by a metal with a higher reduction potential, is capable of producing unique structures such as bimetallic octapods, nanoboxes, and nanocages with high-index facets.Reference Xia, Wang, Ruditskiy and Xia22 These nanostructures possess characteristics particularly suited for catalytic applications, such as higher specific surface area and bimetallic composition, which result in increased stability in harsh reaction environments.
Shape-controlled nanocrystals for the oxygen reduction reaction
One of today’s greatest catalytic challenges lies in the manufacture of cost-effective fuel cells for the electrochemical generation of electricity. Polymer electrolyte fuel cells (PEFCs) hold great promise in this regard, and Pt has already been established as the best catalyst needed to drive the electrochemical reactions involved in PEFCs.Reference Gasteiger, Kocha, Sampalli and Wagner26 However, Pt is both a scarce and costly metal, making it imperative to find a more efficient way to utilize it without degrading its catalytic performance. Catalysts based on Pt nanocrystals with controlled shapes may offer an answer by using only a fraction of Pt content used in the conventional catalysts, while delivering comparable catalytic efficiency.Reference Chen, Lim, Lee and Xia27
Two electrochemical half-reactions are combined in a PEFC device to generate electricity: the hydrogen oxidation reaction (HOR) at the anode, which splits hydrogen gas into constituent protons and electrons, and the oxygen reduction reaction (ORR) at the cathode, which combines oxygen atoms, protons, and electrons into water. Of the two, ORR is a slower process and is therefore responsible for the overall efficiency of the system. Thus, it is prudent to turn our attention to the development of Pt nanocrystals, with the highest possible activity toward ORR. The efficacy of such a catalyst is typically benchmarked using three parameters: (1) specific activity, that is, the current density normalized to the electrochemically active surface area (ECSA), (2) mass activity, which corresponds to the current density per unit mass of the catalytic material, and (3) catalyst durability, which is measured by the loss of ECSA or mass activity after a certain period of use. For a catalyst based on Pt nanocrystals, all of these parameters can be optimized by tailoring their shape (and thus the proportions of different facets), size, and elemental composition.
One of our first attempts to increase the activity of an ORR catalyst was based on the idea of depositing Pt on a Pd substrate. This approach has several merits, including a lower overall Pt loading, when compared to pure Pt nanocrystals, and enhanced stability in acidic environments, such as those found inside PEFCs.Reference de Bruijin, Dam and Janssen28 Furthermore, the electronic coupling between Pd and Pt can weaken surface adsorption of oxygen intermediates, such as O atoms, and thereby increase the rate of the overall reaction.Reference Zhang, Vukmirovic, Xu, Mavrikakis and Adzic29 Similarly, catalytic poisons, such as the hydroxyl group, also experience weakened surface adsorption, thus helping to increase the lifespan of the catalyst.
To achieve these benefits, we began with the synthesis of Pd-Pt dendritic nanostructures, consisting of Pd spherical cores and Pt branched arms, with an overall size of around 24 nm (Figure 3a).Reference Lim, Jiang, Camargo, Cho, Tao, Lu, Zhu and Xia30 As a Pt precursor was introduced into a system containing Pd cuboctahedral seeds and ascorbic acid, the growth of branched arms was initiated from multiple sites on the Pd seeds because of a fast reduction rate provided by ascorbic acid and a slow rate of surface diffusion during the synthesis. The heterogeneous nucleation of Pt on Pd was followed by attachment of small Pt nanoparticles simultaneously formed in the reaction system through a homogeneous nucleation process.Reference Lim, Kobayashi, Camargo, Allard, Liu and Xia31 The branched arms of Pt were found to be mainly covered by {111} facets, along with some high-index facets such as {311}. Despite the relatively larger size, our electrochemical measurements indicated that the Pd-Pt bimetallic dendrites were more active than the commercial Pt/C catalyst, showing two- and threefold enhancements in mass and specific activity (Figure 3b, where specific activity data are shown), respectively.
The effect of facet control on the performance of various catalysts for the oxygen reduction reaction. (a–b) Transmission electron microscope (TEM) image and specific activity results, respectively, for Pd-Pt bimetallic nanodendrites. The Pd-Pt bimetallic dendrites were three times more active than the commercial Pt/C catalyst. Modified with permission from Reference 30. © 2009 American Association for the Advancement of Science. (c–d) High-resolution TEM image and specific activity data, respectively, for Pd@Pt core–shell octahedra. The Pd@Pt octahedra possessed a 28 times higher specific activity relative to that of the pure Pd octahedra and four times greater than that for Pt/C. Conventional particles are composed of a random mixture of {100} and {111} facets. Modified with permission from Reference 33. © 2013 The Royal Society of Chemistry. (e–f) TEM image and specific activity data, respectively, for Pt concave nanocubes with high-index facets. The specific activity of Pt concave nanocubes was more than three times higher when compared to the low-index Pt nanocubes, and nearly four times higher than that of Pt/C. Modified with permission from Reference 35. © 2011 Wiley-VCH Verlag GmbH & Co. KGaA, Weinheim. All shown electrochemical results were collected at 0.9 V.
After confirming the benefits of a bimetallic system, we began to focus on nanocrystals with a specific type of facet on the surface. In order to achieve this, Pt shells with {100} and {111} facets were epitaxially deposited onto 6-nm Pd nanocrystals with cubic and octahedral shapes (Figure 3c), respectively.Reference Shao, He, Peles, Odell, Zeng, Su, Tao, Yu, Zhu and Xia32 The Pt deposition was formed through galvanic replacement between a Pt precursor and a thin shell of Cu deposited using an electrochemical reduction method. It should be pointed out that other solution-phase methods, involving chemical reduction only, have also been developed.Reference Xia, Xie, Liu, Peng, Lu, Wang, Kim and Xia21 In a related study, cubes and octahedra made of pure Pd were also benchmarked for ORR, demonstrating a 10-fold difference in specific activity between the cubes and octahedra.Reference Shao, Yu, Odell, Jin and Xia33 This result indicates a preference of ORR for the Pd{100} facets.
An opposite trend was observed when the Pd@Pt core–shell nanocrystals (i.e., with a Pt shell around a Pd core) were tested (Figure 3d). Our catalytic measurements revealed that Pd@Pt octahedra possessed a 28 times higher specific activity relative to that of pure Pd octahedra, while the core–shell cubes performed slightly worse (by 10%) than the Pd cubes. Furthermore, the core–shell octahedra showed specific activity that was almost four times greater than for Pt/C, performing better than the previously discussed Pd-Pt dendrite structures. Subsequent computational studies suggested that the increased activity of the Pt{111} facets could be attributed to a weaker oxygen binding energy on the surface and thus an increase in the overall reaction rate.Reference Shao, He, Peles, Odell, Zeng, Su, Tao, Yu, Zhu and Xia32 Additionally, the Pd@Pt octahedra were shown to be the most stable among the catalysts tested, with a loss of only ∼2% of ECSA after 5,000 test cycles compared to ∼25% for the commercial Pt/C catalyst.
In addition to the low-index structures discussed previously, we synthesized and benchmarked a number of structures with high-index facets such as octapods and concave nanocubes. The first structure was prepared through a galvanic replacement reaction between 20-nm Pd cubes and a Pt precursor.Reference Zhang, Jin, Wang, Li, Camargo, Kim, Yang, Xie and Xia34 The final structure consisted of a Pd octapod, with Pt deposited at the corner sites. At a low (3.4%) loading of Pt, the structure showed mass activity four times higher than that of commercial Pt/C. When the Pt loading was increased, the mass activity decreased sharply, likely due to the loss of Pd-Pt electronic coupling and the increase of Pt in the bulk. Furthermore, concave nanocubes made of pure Pt (Figure 3e) were synthesized through a combination of slow reduction kinetics and a blocking agent adsorbed on the {100} facets of the initial cuboctahedral seeds.Reference Yu, Kim, Zhang and Xia35 These structures contained high-index facets such as {720}, and thus higher densities of catalytically active edges and steps. The specific activity was found to be more than three times higher than the conventional Pt nanocubes enclosed by {100} facets, and almost four times higher than that of commercial Pt/C (Figure 3f). It should be noted that the mass activity of this type of nanostructure was held back by its larger size (15–40 nm) and a significant loss of Pt to the bulk of the catalyst.
In addition to the effects of structure, elemental composition of the nanocrystals can have a dramatic impact on their catalytic activity toward ORR. In particular, as discussed previously, incorporating a secondary metal into the Pt lattice allows for the tuning of the electronic structure of the catalyst, as well as actively reducing material cost owing to the lower amount of Pt needed. In 2007, Stamenkovic and co-workers demonstrated a 90-fold improvement in specific activity, over the state-of-the-art Pt/C for Pt3Ni single-crystal substrates with a (111) surface.Reference Stamenkovic, Fowler, Mun, Wang, Ross, Lucas and Markovic36 A logical next step in the development of this material involved replacing the single-crystal substrates with nano-sized Pt3Ni octahedra, which was initially achieved by Fang et al. and other groups.Reference Zhang, Yang, Fang and Zou37–Reference Wu, Cai, Wang, He and Li40 However, all these attempts to synthesize nano-sized Pt3Ni octahedra involved the use of strongly binding organic capping agents, which drastically lowered the specific activity of these catalysts.
Recently, we were able to synthesize Pt-Ni alloy octahedra enclosed by {111} facets (Figure 4a–b) with tunable elemental compositions and, more importantly, a cleaner catalytic surface.Reference Choi, Xie, Shao, Odell, Lu, Peng, Protsailo, Guerrero, Park, Xia, Wang, Kim and Xia41 By introducing an organic solvent, incorporating CO as a capping agent, and tuning the Pt/Ni ratio with acetic acid, we were able to manufacture 9 nm Pt-Ni octahedra with a recording-setting activity approaching that of the single-crystal Pt3Ni(111) surface. In particular, the mass activity of the Pt2.5Ni octahedra showed a 17-fold improvement over commercial Pt/C and an eightfold improvement over commercial Pt3Ni nanoparticles, highlighting the critical importance of elemental composition and surface cleanliness to the catalytic performance. The Pt2.5Ni showed specific activity that was 51 times higher than that of commercial Pt/C, which was the highest value ever reported for Pt-Ni nanocrystals. Figure 4c shows a summary of the electrocatalytic data. Durability testing showed a specific activity loss of 40% after 5,000 test cycles, which is comparable to commercial Pt/C (34%).
The combined effect of facet and elemental control on the catalytic activity of Pt-based nanocrystals for the oxygen reduction reaction. (a) Transmission electron microscope (TEM) and (b) high-resolution TEM images of Pt–Ni octahedra with an edge length of 9 nm. (c) Specific and mass activity of Pt2.5Ni in comparison with commercial Pt/C and commercially available Pt3Ni. The mass activity of the Pt2.5Ni octahedra showed a 17-fold improvement over Pt/C and an eightfold improvement over commercial Pt3Ni nanoparticles at 0.9 V. Pt2.5Ni showed specific activity that was 51 times higher than that of Pt/C measured at 0.93 V. Modified with permission from Reference 41. © 2013 American Chemical Society.
It should be noted that the previous discussions are based on the assumption that the hydrogen fuel fed into the PEFC is pure. However, realistically, the gas fed into the fuel cells will contain some fraction of impurities. Importantly, even trace amounts of CO in the feed stock will impede the HOR at the anode by poisoning the active sites on the Pt catalyst. To this end, utilizing the preferential oxidation of CO to purify the hydrogen fuel would allow for higher fuel cell efficiency in real world applications. To facilitate this reaction, we fabricated Pt-Pd alloy nanocages through a combination of galvanic replacement and co-reduction.Reference Zhang, Jin, Liu, Wang, Kim, Yang, Xie, Liu and Xia42 The Pt-Pd structures, mainly covered by {100} facets, showed a higher selectivity for CO and a lower maximum conversion temperature when compared to both nanocubes of pure Pd and commercial Pt/C. This increase in performance was likely due to the larger surface area afforded by the hollow interior of the nanocages, as well as the high rate of material transport enabled by their porous structures.
Shape-controlled nanocrystals for the formic acid oxidation reaction
Direct formic acid fuel cells (DFAFCs) represent another route to the electrochemical generation of electricity.Reference Yu and Pickup43 Unlike PEFCs, DFAFCs do not pose an explosive hazard due to the absence of highly flammable hydrogen gas in the system. Instead, protons are generated through electrochemical oxidation of formic acid (a liquid fuel). These fuel cells also show greater overall efficiency when compared to fuel cells based on other liquid fuels such as methanol and ethanol.Reference Zhang, Wang, Wang, Zhai and Cai44 Formic acid oxidation (FAO) constitutes the primary bottleneck of such a device, a problem that may be overcome with the help of an efficient catalyst. FAO can occur through two different reaction pathways: direct dehydrogenation, which evolves CO2 and protons as products, and indirect dehydration, which releases water as a by-product.Reference Shao, Odell, Humbert, Yu and Xia45 The latter pathway also produces CO molecules, which can poison the catalyst by tightly binding to active sites. Furthermore, as with ORR, FAO reactions also favor a specific crystal surface, necessitating the development of facet-controlled nanocrystals in order to maximize the performance.
Our initial focus centered on the synthesis of Pd nanocrystals with precisely controlled ratios between different facets. Previous studies have established that Pd is a better material for FAO catalysts when compared to Pt because the latter preferentially catalyzes the FAO reaction through the indirect dehydration pathway regardless of the type of facet involved, thus making Pd a logical choice for this application.Reference Jin, Zhang, Xie and Xia46 We synthesized a spectrum of Pd nanocrystals with different proportions of {111} and {100} facets by utilizing seeded growth, together with proper kinetics for atomic deposition and surface diffusion. The resultant nanocrystals included cubes (Figure 5a), cuboctahedra (Figure 5b), and octahedra (Figure 5c) approximately 37 nm in size. Our electrocatalytic measurements (Figure 5d) revealed a peak current density that was sixfold greater for Pd cubes when compared to Pd octahedra, indicating a preference of FAO for {100} crystal facets over {111} facets.
The influence of variation in facet proportion on the activity of Pd nanocrystals for the formic acid oxidation (FAO) reaction. (a–c) TEM images of (a) 10 nm Pd cubes, (b) 17 nm Pd cuboctahedra, and (c) 30 nm Pd octahedra. Inset scale bars: 10 nm. (d) Peak current density for the FAO reaction on various Pd nanocrystals. Pd cubes showed sixfold greater current density when compared to Pd octahedra, indicating a preference of FAO for {100} crystal facets over {111} facets. Modified with permission from Reference 46. © 2012 The Royal Society of Chemistry.
It should be noted that when the nanocrystal size was reduced to 5–6 nm, this relationship was reversed, with both nanocrystals performing worse than a similarly sized commercial Pd/C catalyst composed of a mix of {100} and {111} facets.Reference Shao, Odell, Humbert, Yu and Xia45 This difference highlights the effects of nanocrystal size, which also needs to be tightly controlled in order to achieve the greatest catalytic activity. We have also synthesized Pd concave nanocubes with high-index facets, through careful manipulation of the reaction kinetics.Reference Jin, Zhang, Xie and Xia47 These nanocrystals, enclosed primarily by {730} facets, showed a specific activity of almost two times higher than that of similarly sized Pd cubes enclosed by {100} facets, once again emphasizing the catalytic benefits of the more active, high-index surfaces. Subsequently, we turned our attention away from single-crystal structures to nanocrystals with twin defects.Reference Lv, Wang, Choi, Chi, Tao, Pan, Huang, Zhu and Xia48 These are particularly attractive for various catalytic applications due to the highly energetic twin planes that help define their architecture. However, it was challenging to generate such structures with product purity sufficient for catalytic applications.
Most recently, we were able to synthesize 17 nm Pd icosahedra with a multiply twinned structure (Figure 6a), enclosed by {111} facets, with a yield exceeding 94%. These complex structures were generated by slowing down the reduction of the Pd precursor, thus allowing the multiply-twinned seeds to nucleate in higher proportion relative to the single-crystal seeds. FAO catalytic testing showed a 1.9- and an 11.6-fold increase in specific activity (Figure 6b) over the {111}-enclosed Pd octahedra and commercial Pd/C, respectively. Furthermore, the mass activity was shown to be approximately three and two times higher, respectively. These results demonstrated the significance of twin defects as another factor in improving the activity of a heterogeneous catalyst, prompting the need to further investigate this structural feature.
The combined effects of facet and twin defect on the activity of Pd nanocrystals for the formic acid oxidation (FAO) reaction. (a) Transmission electron microscope (TEM) image of a Pd icosahedron with multiply twinned defects. (b) Cyclic voltammetry curves for the FAO reaction comparing the performance of Pd icosahedra, Pd octahedra, and commercial Pd/C. The Pd icosahedra showed a 1.9- and a 11.6-fold increase in specific activity over the Pd octahedra and commercial Pd/C, respectively. Modified with permission from Reference 48. © 2013 Wiley-VCH Verlag GmbH & Co. KGaA, Weinheim. (c) High-resolution TEM image of a Pd right bipyramid with a single twin defect indicated by the red arrow. (d) Cyclic voltammetry curves for the FAO reaction comparing the performance of Pd right bipyramids (RBPs), Pd cubes, and commercial Pd black. Pd right bipyramids, characterized by a twin defect, showed a 2.5- and 7.1-fold increase in specific activity over single-crystal Pd nanocubes and commercial Pd black (i.e., irregular Pd particles), respectively. Direction of arrows indicates the forward and backward voltage scans during the measurements. Modified with permission from Reference 49. © 2013 American Chemical Society. Note: RHE, reference hydrogen electrode; E, potential.
After concluding the previous study, the path to improving FAO catalytic performance was clear. Previous work conducted by us and others suggested that the Pd{100} facets were superior for FAO performance when compared to the {111} facets on both Pd octahedra and icosahedra.Reference Jin, Zhang, Xie and Xia46 Logically, Pd nanocrystals containing twinned defects, but still enclosed by {100} facets, should provide a markedly higher catalytic activity relative to all previously discussed catalysts. To this end, we prepared singly twinned Pd right bipyramids, which possess a single twin defect that separates a set of six {100} facets (Figure 6c).Reference Xia, Choi, Herron, Lu, Scaranto, Peng, Wang, Mavrikakis, Kim and Xia49 Closer inspection of the twin boundary revealed the presence of high-index facets such as {211} capable of further boosting the catalytic activity of the FAO reaction. This synthesis was achieved by utilizing I– as both a capping agent for the {100} facets and an etching species needed to selectively remove the multiply twinned seeds from the reaction system. Electrocatalytic characterization revealed a 2.5- and 7.1-fold increase (Figure 6d) in specific activity over Pd nanocubes and commercial Pd black (i.e., irregular Pd particles), respectively. Furthermore, the Pd right bipyramids also outperformed Pd black in terms of catalytic stability. Follow-up computational simulations revealed that the high-index {211} facets, located at the twin boundaries, encouraged the FAO reaction to follow the direct dehydrogenation pathway, thus limiting the amount of catalytically poisonous CO released during the testing and extending the active lifetime of the catalyst.Reference Xia, Choi, Herron, Lu, Scaranto, Peng, Wang, Mavrikakis, Kim and Xia49
Hydrogenation of alkynes and other reactions
In the chemical and pharmaceutical industries, efficient hydrogenation of alkynes is crucial for the successful production of numerous medicines and fine chemicals (i.e., highly pure chemical compounds). Hydrogenation, in this instance, can be defined as the introduction of a pair of hydrogen atoms into an unsaturated bond, such as the triple or double bonds in alkyne or alkene. Unlike the fuel cell reactions discussed previously, these systems require a very high degree of product selectivity in order to create only the desired compound. With these requirements in mind, we collaborated with Kiwi-Minsker’s group, at the Swiss Federal Institute of Technology in Lausanne, to explore the impact of a specific facet of Pd nanocrystals on the hydrogenation reaction of 2-methyl-3-butyn-2-ol (MBY), a model system.Reference Crespo-Quesada, Yarulin, Jin, Xia and Kiwi-Minsker50 The MBY molecule can be hydrogenated to 2-methyl-3-buten-2-ol (MBE) or over-hydrogenated to 2-methyl-3-butan-2-ol (MBA) upon exposure to hydrogen gas at a high pressure. Several catalysts were prepared for testing, including Pd cubes and octahedra enclosed by the {100} and {111} facets, respectively. It was found that both the {111} and {100} facets were equally effective at converting MBY to MBE, while the highly reactive, low-CN sites, such as those on edges and at vertices, could transform MBY into MBA. The latter phenomenon was explained by the stronger adsorption of MBY to low-CN sites, thus leading to over-hydrogenation. Figure 7 shows schematics of the catalytically active sites and their correlations to the various reaction pathways. Our study showed that the low-CN sites were actually less selective than the faces on the nanocrystals for this particular reaction. Therefore, predictably, as the size of the Pd catalysts was reduced, the selectivity toward MBE production dropped because the fraction of atoms at the face sites decreased. At the same time, the rate of conversion for MBY increased as the Pd nanocrystals became smaller, thus underscoring the need to find a balance between the output efficiency and product selectivity.
The effect of shape control on the hydrogenation of alkyne. (a) Schematic of the two types of catalytically active sites (σ1 and σ2) presented on the surface of Pd nanocrystals. (b) The hydrogenation reaction pathways with different reaction rates (r) corresponding to the different active sites. Modified with permission from Reference 50. © 2011 American Chemical Society. Note: MBA, 2-methyl-3-butan-2-ol; MBE, 2-methyl-3-buten-2-ol; MBY, 2-methyl-3-butyn-2-ol.
As we have established previously, the catalytic performance relies heavily on the available surface area of the material. However, the facet capping agent, which facilitates the growth and subsequent stability of the nanocrystals, can reduce catalytic efficiency by blocking the active surface sites. Washing the nanocrystals may remove the physically adsorbed capping agent, but it will do little to remove the chemically bound species. Several methods have been developed for surface cleaning, including those based on plasma treatment, calcination, and electrochemical imposition. However, all these methods carry a risk of altering the crucial structure of the nanocatalyst. In an attempt to address this issue, our collaborator tested a method based on UV-ozone treatment, which could convert organic capping agents into volatile species at room temperature.Reference Xie, Choi, Xia and Xia51 When PVP-capped Pd nanocubes were subjected to such a treatment, they could be subsequently used for the hydrogenation reaction of acetylene. The removal of the PVP coating resulted in a fourfold increase in catalytic activity relative to the untreated Pd nanocubes. However, the catalyst deactivation, defined as the percentage of initial activity lost after 3.5 hours, was three times higher for the treated nanocubes, highlighting a significant drawback of removing the protecting groups from the particle surface.
In addition to the reactions discussed previously, we have been able to successfully catalyze a number of other reactions using facet-controlled metal nanocrystals. For example, the azo hydrogenation (i.e., the hydrogenation of a N=N double bond) of model methyl red molecules was successfully performed with the help of Pd-Ag alloyed nanoboxes and Pd-Ag-Au nanocages, both of which showed comparable catalytic performance.Reference Crespo-Quesada, Andanson, Yarulin, Lim, Xia and Kiwi-Minsker52 Furthermore, Pd concave nanocubes enclosed by high-index facets were used to catalyze the Suzuki carbon-carbon coupling reaction (i.e., the formation of a C–C bond) between phenylboronic acid and iodobenzene to generate biphenyl.Reference Jin, Zhang, Xie and Xia47 The results revealed an activity 3.5 times higher for Pd concave nanocubes relative to the conventional Pd nanocubes with a similar size but with flat faces. Additionally, the concave structures showed only a 3% loss of activity after three catalytic cycles, and both catalysts were able to successfully maintain their shape throughout the testing.
The importance of size control in heterogeneous catalysis
We have so far mainly focused on the effect of shape control on the catalytic properties of metal nanocrystals. It should be emphasized that size control also plays a pivotal role in determining the catalytic activity of metal nanocrystals.Reference Cobley, Campbell and Xia53 In contrast to a bulk, single-crystal substrate, the three-dimensional configuration of a nanocrystal allows for the presence of multiple types of surface atoms, even for nanocrystals enclosed by a single type of facet. These surface atoms can be classified into three groups: face, edge, and vertex. Our discussions in previous sections only apply to those systems in which catalytic activity is dominated by the atoms on the faces. Each of these groups is individually characterized by a distinct CN, that is, the number of nearest neighbors that surround the atom in question. In general, the CNs for the three groups of atoms adhere to the following trend: face > edge > vertex (Figure 8a). When we reduce the size of the nanocrystal, the percentage of atoms located on the surface increase drastically, as shown in Figure 8b.Reference Mostafa, Behafarid, Croy, Ono, Li, Yang, Frankel and Cuenya55 The increase in surface-to-volume ratio increases the overall catalytic surface area of the catalyst while reducing the mass of the metal needed.Reference An and Somorjai54 The ratio of edge and vertex atoms relative to the face atoms will also vary significantly, with smaller sizes producing higher ratios. Since the atoms with low CNs are generally more reactive, it is reasonable to anticipate an increase in catalytic activity with a decrease in nanocrystal size for certain reactions. For example, Cuenya and co-workers reported that the oxidation of 2-propanol, catalyzed by various Pt nanocrystals, showed a lower onset temperature in the presence of smaller particles.Reference Mostafa, Behafarid, Croy, Ono, Li, Yang, Frankel and Cuenya55 In reality, we have to optimize both the size and shape of metal nanocrystals in order to maximize their catalytic performance.
(a) Atomic model of a cuboctahedral nanocrystal made of a face-centered cubic (fcc) metal, with the coordination numbers labeled for surface atoms positioned, respectively, on a face (f), edge (e), and vertex (v). (b) Plot of the percentage of surface atoms as a function of the edge length of Pd nanocubes (black curve), with data points corresponding to specific edge lengths highlighted in red. When the size of the nanocrystal is reduced, the percentage of atoms located on the surface will drastically increase. Adapted with permission from Reference 55.
Conclusion
Research in nanoscience is marching forward with tremendous speed. With each passing year, we are able to expand our understanding of the subject and to create rational ways to utilize this newfound knowledge to power the never-ending progress. From electronics and optics to catalysis and medicine, every one of these fields will be radically transformed by the availability of well-controlled nanomaterials. Even for a relatively niche application such as heterogeneous catalysis, nanocrystals with controlled shapes hold remarkable promise. By blending together the fundamental principles governing the catalytic behaviors of nanocrystals, we were able to fabricate catalysts with efficiencies far exceeding those of previous generations, while reducing the cost and material waste.
Despite notable achievements in recent years, there still exists a wide gap between the catalysts currently used in practice and the designer catalysts derived from computational and experimental studies involving single-crystal surfaces. This gap can be attributed to a number of technical barriers, including the experimental difficulties in controlling both shape and size of metal nanocrystals, as well as the hurdles in producing nanocrystals in sufficiently large quantities while maintaining the desired uniformity. In addition, the shape taken by nanocrystals is highly sensitive to the chemisorption of molecular species involved in their synthesis or during the catalytic reaction. The shape of a nanocrystal is expected to change when the capping agent used in the shape-controlled synthesis is partially or completely removed, or whenever the nanocrystal is exposed to different reaction environments. As a result, the types of facets on the surface of a nanocrystal, and therefore the proportions of different types of surface atoms, will change dynamically upon its participation in a catalytic reaction, making it extremely challenging to retain the initial activity and selectivity. All of these scientific issues need to be understood and addressed before we can start to rationally develop shape-controlled metal nanocrystals for industrial catalytic applications.
The findings described here do not constitute the end of exploration. In fact, many catalytic avenues remain unexplored, such as the integration of twinned defects with the concave structure or the utilization of more exotic nanocrystal geometries with tunable elemental compositions. As our synthetic capabilities continue to evolve, we should not forget to channel these novel insights into practical applications. Only then can this new, and often bizarre, realm of nanoscience make a lasting impact on the world.
Aleksey Ruditskiy is a PhD candidate in chemistry and biochemistry at the Georgia Institute of Technology, USA, and has been supported by a National Science Foundation Fellowship since February 2013. He received his BE degree in chemical engineering from City College of New York in 2012, where he worked with Ilona Kretzschmar on the electromagnetic assembly of Janus particles. His research interests focus on the synthesis of novel inorganic nanomaterials and their assembly in various media for optical, electronic, and energy applications. Ruditskiy can be reached by email at aruditskiy3@gatech.edu.
Sang-Il Choi has been a postdoctoral fellow in the Xia group at the Georgia Institute of Technology, USA, since September 2012. He received his BS degree in chemistry from Sungkyunkwan University (2005) and his PhD degree in inorganic chemistry from the Korea Advanced Institute of Science and Technology (2011), where he also worked as a postdoctoral fellow. His research interests include the design and synthesis of nanomaterials and exploration of their applications in catalysis. Choi can be reached by email at sangil.choi@bme.gatech.edu.
Hsin-Chieh Peng has been pursuing his PhD degree in chemistry and biochemistry at the Georgia Institute of Technology, USA, since August 2011. He received his BS (2006) and MS (2008) degrees in chemistry from National Taiwan University. He joined the Xia group in January 2012, and his research interests focus on the systematic study of the role of capping agents in controlling the shape evolution of metal nanocrystals. Peng can be reached by email at hcpeng@gatech.edu.
Younan Xia has been the Brock Family Chair and Georgia Research Alliance (GRA) Eminent Scholar in Nanomedicine at the Georgia Institute of Technology, USA, since 2012. He holds joint appointments in the Department of Biomedical Engineering, School of Chemistry and Biochemistry, and School of Chemical and Biomolecular Engineering. Xia received his BS degree from the University of Science and Technology of China (1987), his MS degree from the University of Pennsylvania (1993), and his PhD degree in physical chemistry from Harvard University (1996 with George M. Whitesides). He started as an assistant professor of chemistry (1997) at the University of Washington, was promoted to associate professor in 2002, and then to full professor in 2004. He joined Washington University in St. Louis in 2007 as the James M. McKelvey Professor for Advanced Materials before moving to Georgia Tech. His research interests include nanomaterials, biomaterials, nanomedicine, regenerative medicine, imaging, electrospinning, and colloidal science. Xia can be reached by email at younan.xia@bme.gatech.edu.