

INTRODUCTION
The majority of people in the United States die late in life, secondary to multiple chronic illnesses (Evers et al., Reference Evers, Meier and Morrison2002). Death is often preceded by frailty, a decline in function, and the need for a complicated treatment plan that requires placement in a long-term care (LTC) facility (Boockvar & Meier, Reference Boockvar and Meier2006; Kapo et al., Reference Kapo, Morrison and Liao2007; U.S. Department of Health and Human Services, 2001). In 2000, the number of individuals who paid for LTC services in any setting was 13 million (U.S. Department of Health and Human Services, 2001). By 2050, the number will likely reach 27 million (U.S. Department of Health and Human Services, 2001). In the Veterans Affairs (VA) healthcare system alone, an estimated 9.3 million veterans are currently 65 years or older, and each day ~180,000 additional veterans are admitted to VA facilities for LTC (Health Services Research and Development Service, 2000). The cost of providing LTC services to veterans is estimated to be >$3.3 billion a year (U.S. Department of Veterans Affairs, Office of Geriatrics and Extended Care, 2009). Of the 600,000 veterans who die each year, 29,000 die within VA facilities, and this number is increasing by ~8% each year (Cooley & Salerno, Reference Cooley and Salerno2002).
In the LTC setting, it is difficult to involve patients in decision making because many of them have dementia or other cognitive impairments that affect their ability to understand, communicate, and articulate their preferences (Brock, Reference Brock1996; Cherlin et al., Reference Cherlin, Fried and Prigerson2005). As a result, providers of LTC typically rely on patients' family members for input about services that are necessary and desirable (Brock, Reference Brock1996; Cherlin et al., Reference Cherlin, Fried and Prigerson2005). Because family members play such a crucial role in LTC decision making, their satisfaction with LTC is critical and is considered to be an indicator both of the current quality of care and of the need for quality improvements (American Health Care Association, 2007; McVeigh et al., Reference McVeigh, Jablonski and Penrod2009). However, because survey instruments developed to measure family satisfaction in some care settings may not be valid for measurement in the LTC setting, it is important to assess their applicability to LTC populations (Dy et al., Reference Dy, Shugarman and Lorenz2008; Goldstein & Morrison, Reference Goldstein and Morrison2005; Kutner, Reference Kutner2008).
The FAMCARE Scale is an instrument that was originally designed to measure family satisfaction with advanced cancer care. In our study, we asked the family members of LTC patients in VA facilities to complete the FAMCARE, and then we used their scores to evaluate the instrument's psychometric qualities when used in the LTC setting.
METHOD
Study Setting and Participants
The study was conducted among family members of patients in a geriatric palliative care unit (GPCU) and two traditional nursing home care units (NHCUs) at an urban VA medical center in the Northeastern United States.
The GPCU was developed to serve as a clinical demonstration unit. It consists of 40 beds dedicated to providing care to chronically ill and frail older adults who are in terminal decline but do not have an easily predictable clinical course. The GPCU focuses on addressing the physical, spiritual, and emotional issues of aging to improve quality of life and care near the end of life. However, a “do not resuscitate” order is not a requirement for admission to the unit. The core care team includes one medical doctor (MD), one nurse practitioner, one social worker, one nurse manager, one clinical manager, one regular chaplain plus two or three chaplains rounding intermittently, one nutritionist, five registered nurses, and eight licensed practical nurses. It also includes 10–15 nurse assistants, consultant occupational therapists, physical therapists, and psychologists. The average GPCU patient age is >70 years. At the time of the study, the unit admitted one or two veterans each week. The life expectancy of patients was about one or two years, the average length of stay was eight months, and the average number of deaths per month was five. Approximately 75% of patients had a “do not transfer to acute care” order, and ~50% of veterans who were admitted to the unit died there.
The participating NHCUs included one 40-bed unit and one 60-bed unit. The units were located in the same building and on the same floor but in different hospital wings. One medical doctor oversaw both units, but each unit had separate nurse practitioners, nurse managers, and clinical managers (i.e., “charge nurses”). Veterans admitted to the NHCUs typically were medically and psychiatrically stable, admitted for short-stay rehabilitation, and expected to be discharged to their homes. There were no age or chronic illness requirements for admission, and skilled nursing care was not available. At the time of the study, approximately eight or nine veterans were admitted to the units each week, and there were relatively few patient deaths in the units.
Study Design
The data presented here were collected between September 15, 2004, and December 15, 2004, as part of a quality assurance project conducted by the VA health care system. The Institutional Review Board approved the project and waived the need for informed consent. After the staff developed a census of veterans who had been admitted to the GPCU or the NHCUs during this time period and had been inpatients for at least 30 days, we requested that the veterans' family members participate in a monthly quality assurance survey. We made three attempts to contact family members for the survey. We then interviewed those family members who agreed to be surveyed via telephone on a monthly basis about the care received by the patient. The interview included questions from the FAMCARE Scale. For the purpose of our analysis, we included the last FAMCARE obtained from family members.
The FAMCARE Scale
In 1986, Kristjanson developed the FAMCARE Scale from qualitative research in which the family members of patients with advanced cancer were asked to list indicators of the quality of palliative care (Kristjanson, Reference Kristjanson1986). Based on a qsort and examination of the psychometric properties of the indicators, the original list was shortened (Kristjanson, Reference Kristjanson1986; Kristjanson, Reference Kristjanson1993). The resulting instrument had four subscales and included 20 items: information giving (5 items), availability of care (4 items), physical care (7 items), and psychosocial care (4 items) (Kristjanson, Reference Kristjanson1986; Kristjanson, Reference Kristjanson1993). The instrument asked respondents to indicate their level of satisfaction with cancer care on a 5-point Likert scale in which 1 indicated very satisfied, 2 indicated satisfied, 3 indicated undecided, 4 indicated dissatisfied, and 5 indicated very dissatisfied. The instrument was administered by an interviewer and had a mean data collection time of 22 minutes.
The FAMCARE Scale has been shown to demonstrate excellent internal consistency, temporal stability, and criterion-related validity when it is used to measure family satisfaction with cancer care (Kristjanson, Reference Kristjanson1993; Kristjanson et al., Reference Kristjanson, Leis and Koop1996). Our study was designed to analyze the psychometric properties of the scale when it is used to measure family satisfaction with LTC.
Statistical Analysis
To characterize the patients, their family members, and the responses to the 20 items in the FAMCARE Scale, we used descriptive statistics. To evaluate the internal consistency of the responses, we used the Cronbach alpha correlation coefficient. To explore the dimensionality of the scale, we began with a principal component factor analysis and determined the factor loadings, which are the correlations between the factors and the individual items. We then used the varimax method with Kaiser normalization (Ringdal et al., Reference Ringdal, Jordhoy and Kaasa2003) to rotate the initial factor and determine the communalities (i.e., the h 2, which represents the proportion of the variance in each item that can be explained by the factors). We scrutinized our factor loadings, assigned each of them a subscale name, and compared our subscales with the subscales assigned by Kristjanson (Kristjanson, Reference Kristjanson1986; Kristjanson, Reference Kristjanson1993). Based on our results, we eliminated two of the FAMCARE items to reduce the eigenvalue of the weakest factor. We then ran a revised factor analysis that covered 18 items, rather than 20 items.
RESULTS
Characteristics of Patients and Survey Respondents
During the study period, 77 patients met the criteria for having their family members included in the study. Most of the patients were white, male, and unmarried. Of the 77 patients, 31 were in the GPCU and 46 were in an NHCU. The average age of the GPCU patients was 74 years, and that of the NHCU patients was 71 years. There were no significant differences between the two groups of patients in terms of age, race, gender, marital status, or length of stay.
Telephone interviews were completed by 51 family members (respondents)—16 family members of GPCU patients and 35 family members of NHCU patients. Of the 51 respondents, 24 (47%) were spouses or partners of the patients, 13 (25%) were children or children-in-law, 7 (14%) were siblings, and 2 (4%) were parents. Another 2 (4%) identified their relationship with the patient as “other,” and 3 (6%) had missing information regarding the relationship.
Satisfaction of Respondents
The total satisfaction score of respondents was high, with a mean and standard deviation of 44.7 ± 11.9 of 100 possible points.
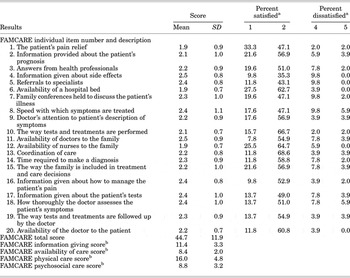
For each of the 20 items on the FAMCARE instrument, the mean scores were <3.0, indicating that the majority of the family member respondents were satisfied with the care given to the patient (Table 1). The highest satisfaction (a mean score of 1.9) was reported for three items: the patient's pain relief (item 1), availability of a hospital bed (item 6), and availability of nurses to the family (item 12). The lowest satisfaction (a mean score of 2.5) was reported for information given about sides effects (item 4) and availability of doctors to the family (item 11); however, very few of the respondents (0.0%–3.9%) reported being “very dissatisfied” with respect to these items. Mean scores on individual items in each of the subscales were as follows: 2.29 ± 0.66 for information giving, 2.29 ± 0.69 for physical care, 2.21 ± 0.79 for psychosocial care, and 2.10 ± 0.51 for availability of care (data not shown). No significant differences were found between responses of family members of GPCU patients and responses of family members of NHCU patients (data not shown).
Results of the FAMCARE Scale administered to the family members of 51 patients receiving long-term care

SD indicates standard deviation.
aOn the 5-point Likert scale, response categories are as follows: 1 = very satisfied; 2 = satisfied; 3 = undecided; 4 = dissatisfied; and 5 = very dissatisfied.
bAverage scores on the FAMCARE subscales, as outlined by Kristjanson (Reference Kristjanson1986, Reference Kristjanson1993). Subscales include the following items: information giving (items 2, 3, 4, 16, and 17); availability of care (items 6, 11, 12, and 20); physical care (items 1, 5, 8, 10, 14, 18, and 19); and psychosocial care (items 7, 9, 13, and 15).
Internal Consistency
The Cronbach alpha correlation coefficient for the total satisfaction score was 0.94. The coefficients for the subscales were 0.80 for information giving, 0.84 for physical care, 0.82 for psychosocial care, and 0.89 for availability of care. Inter-item correlations ranged from 0.19 to 0.70 for information giving, from 0.24 to 0.76 for physical care, and from 0.50 to 0.78 for psychosocial care. The inter-item correlations were low for availability of care, ranging from 0.01 to 0.59. They were particularly low for two of the individual availability items: 0.23 for availability of a hospital bed and 0.16 for availability of nurses to the family.
Factor Analysis
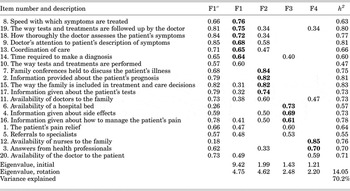
Table 2 reports the factor loadings and communalities. The factor analysis yielded one very strong factor with an eigenvalue of 9.42 and three weak factors with eigenvalues of 1.99, 1.43, and 1.21.
Factor analysis of the FAMCARE Scale with 20 itemsa

a Data are derived from results shown for the 51 respondents and 20 items shown in Table 1. The extraction method was principal component factoring with Kaiser criterion and varimax rotation. High factor loadings (>0.60) are shown in bold. F1″ indicates factor loadings for the first factor in the initial (unrotated) solution. F1, F2, F3, and F4 are factor loadings for the rotated solution, and h2 indicates communalities (the proportion of the variance in each item that is explained by the factors).
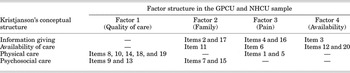
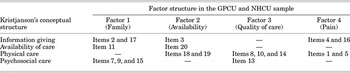
The rotated solution showed four factor loadings (Table 2), which we labeled as the subscales of quality of care (items 8, 9, 10, 13, 14, 18, and 19), family (items 2, 7, 11, 15, and 17), pain (items 1, 4, 5, 6, and 16), and availability (items 3, 12, and 20). A comparison of our subscales with Kristjanson's subscales (information giving, availability of care, physical care, and psychosocial care) indicated that our first factor, quality of care, contained items from Kristjanson's physical care and psychosocial care subscales (Table 3). Our second factor, family, contained items from Kristjanson's subscales of information giving, availability of care, and psychosocial care. Our third factor, pain, contained items from information giving, availability of care, and physical care. Our fourth factor, availability, contained items from information giving and availability of care.
Cross-classification of the conceptual structure (subscales) of the FAMCARE Scale with 20 items

Kristjanson's conceptual structure (Reference Kristjanson1986, Reference Kristjanson1993) is outlined. GPCU indicates geriatric palliative care unit; NHCU, nursing home care unit.
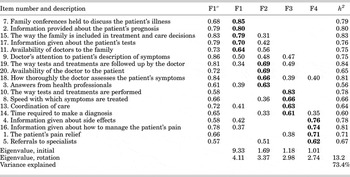
The availability of a hospital bed (item 6) and the availability of nurses to the family (item 12) not only had particularly low factor loadings (0.26 and 0.18, respectively) but also had low correlations with the total FAMCARE score (0.23 and 0.16, respectively) (data not shown). When items 6 and 12 were eliminated, all of the remaining items had factor loadings >0.60 on the first factor in the unrotated solution, and the eigenvalue of the weakest factor was reduced from 1.21 to 1.01 (Table 4). Moreover, both the order of the factor loadings and the content of the subscales (Tables 4 and 5) were affected. While the 20-item factor analysis showed quality of care as the first factor created, the 18-item factor analysis showed family as the first factor created. The quality of care subscale included items 8, 10, 13, and 14 in both the 20-item and 18-item analyses, but it included items 9, 18, and 19 only in the 20-item analysis. The family subscale included items 2, 7, 11, 15, and 17 in both the 20-item and 18-item analyses, but it included item 9 only in the 18-item analysis. The pain subscale included items 1, 4, 5, and 16 in both analyses. The availability subscale included items 3 and 20 in both analyses but included items 18 and 19 in only the 18-item analysis (Table 5).
Factor analysis of FAMCARE Scale with only 18 itemsa

a Data are derived from results shown for the 51 respondents and only 18 of the items shown in Table 1. The 2 items that were eliminated were item 6 (availability of a hospital bed) and item 12 (availability of nurses to the family). The extraction method was principal component factoring with Kaiser criterion and varimax rotation. High factor loadings (>0.60) are shown in bold. F1″ indicates factor loadings for the first factor in the initial (unrotated) solution. F1, F2, F3, and F4 are factor loadings for the rotated solution, and h2 indicates communalities (the proportion of the variance in each item that is explained by the factors).
Cross-classification of the conceptual structure (subscales) of the FAMCARE Scale with only 18 itemsa

Kristjanson's (Reference Kristjanson1986,Reference Kristjanson1993) conceptual structure is outlined. GPCU indicates geriatric palliative care unit; NHCU, nursing home care unit.
a The 2 items that were eliminated were item 6 (availability of a hospital bed) and item 12 (availability of nurses to the family).
DISCUSSION
A review of end-of-life care in United States nursing homes has documented that the quality of LTC is generally poor (Oliver et al., Reference Oliver, Porock and Zweig2005). Although satisfaction is a key outcome of health care and is important to patients and their family members (Cleary & McNeil, Reference Cleary and McNeil1988; Steele et al., Reference Steele, Mills and Long2003), there is a need for the development and use of valid measures of satisfaction in the LTC setting (Kutner, Reference Kutner2008).
FAMCARE is a 20-item instrument that was originally designed by Kristjanson to measure the satisfaction of family members of patients receiving advanced cancer care (Kristjanson, Reference Kristjanson1986; Kristjanson, Reference Kristjanson1993). When we administered the instrument to family members of patients receiving LTC, we found that the majority of the family member respondents were satisfied with the patient's LTC. The results were comparable for two different types of LTC units (GPCU and NHCU), despite the fact that the units had different care goals and different expected death rates.
Our statistical analyses showed that FAMCARE had a high Cronbach alpha correlation coefficient, indicating that the scale has internal consistency in the LTC setting. Whereas Kristjanson found that the items loaded on the subscales of information giving, availability of care, physical care, and psychosocial care in the cancer care setting, our analysis showed that the items loaded on the subscales of quality of care, family, pain, and availability in the LTC setting. The high Cronbach alpha score, the fact that our subscales did not conform to Kristjanson's subscales, and the large difference that we found between the eigenvalues of the first factor and the remaining three factors in our factor analyses all suggest that the FAMCARE scale is unidimensional in this study population. However, the low factor loadings that we found for item 6 (availability of a hospital bed) and item 12 (availability of nurses to the family) suggest that these two items are not really measuring the satisfaction of family members.
Limitations
Our study has several limitations that deserve mention.
First, our study involved a relatively small sample of respondents within a VA health care system, and this may limit the generalizability of our results.
Second, because the FAMCARE was administered as part of a quality assurance project, we have limited demographic data. For example, we do not have information regarding the number of family caregivers who were approached to derive the final sample of 51 participants. In addition, the limited amount of data did not allow for test-retest analysis to determine the reliability of the FAMCARE scale within our selected population over time.
Third, although the family member survey participants had patients in two different LTC units, their responses were comparable. Moreover, the responses showed limited variability in each of the four subscales. Thus, it is possible that the alpha correlation coefficients were inflated because of a ceiling effect. Studies that have used satisfaction measures that are not specifically developed for or adapted to a particular care setting have often demonstrated a ceiling effect (Castle & Engberg, Reference Castle and Engberg2004; Kutner Reference Kutner2008). Moreover, the family of patients requiring LTC may be afraid or reticent to express dissatisfaction or to voice concerns to a physician, health care institution, health plan, or even a researcher (Bond & Thomas, Reference Bond and Thomas1992; Grau et al., Reference Grau, Chandler and Saunders1995; Simmons & Schnelle, Reference Simmons and Schnelle1999). In any case, to increase variability when the FAMCARE is used in different LTC settings, we suggest that its 5-point Likert scale be replaced by a 10-point visual analog scale. The new scale could continue to be anchored by the “very satisfied” response on one end and the “very dissatisfied” response on the other end.
Implications
FAMCARE appears to have good internal consistency when administered to the family members of veterans receiving care in LTC facilities. To improve the instrument's use in the LTC setting, it may be helpful to exclude the two items with weak correlations (the availability of a hospital bed and the availability of nurses to the family), to replace the 5-point scale with a 10-point scale, and to retest the instrument's psychometric properties with a larger sample of family members of patients receiving LTC.