Nomenclature
- π
-
total pressure ratio
-
 $ \eta$
I
-
isentropic efficiency
- p in
-
total pressure of import, Pa
- P out
-
total pressure of export, Pa
- h1
-
inlet enthalpy, J/kg
- h2
-
actual outlet enthalpy, J/kg
- h2 s
-
isentropic outlet enthalpy, J/kg
-
$ \varphi$
-
relative leakage quantity
-
${\dot m_{leak}}$
-
rotor tip clearance leakage flow rate, kg/s
-
${\dot m_{in}}$
-
compressor inlet flow rate, kg/s


1.0 Introduction
The aerodynamic efficiency of aero-engine compressors is closely related to tip clearance control. Tip leakage flow represents one of the most critical secondary flow phenomena within compressor passages. Due to intense interactions between leakage flow, primary flow, endwall boundary layers and other secondary flows, it not only induces flow blockage and endwall losses but also affects inter-stage matching, leading to reduced compressor efficiency, diminished pressure rise capability and decreased operating margin [Reference Ye, Zhao, Cui, Xi and Xu1–Reference Danish, Qureshi, Imran, Khan, Sarfraz, El-Leathy, Al-Ansary and Wei4]. During high-speed engine operation, deformations of hubs, blades and casings caused by centrifugal strain, thermal expansion, rotor imbalance response and thermal bending result in blade-casing rub [Reference Ahmad5, Reference Qiao, Sun, Ding, Zhang, Liao and W6]. The wear of abradable sealing coatings between blades and casings generates non-uniform wear morphologies that alter local clearance dimensions and surface roughness distributions, triggering secondary vortex system reconstruction in leakage flow fields.
The compressor efficiency exhibits a strong correlation with internal losses, among which the tip clearance serves as the primary source of leakage losses [Reference Rajakumar, Ramamurthy and Govardhan7, Reference Chen, Zhou, Zuo, Li, Tao and Chen8]. Berdanier and Key [Reference Berdanier and Key9] investigated the performance variation of a 3.5-stage axial compressor under different tip clearances by replacing casings, revealing that each 1% increase in tip clearance relative to blade height caused a 1.3% efficiency reduction. Chen et al. [Reference Chen, Zuo, Zhou, Li, Sun, Xu and Chen10] demonstrated through studies on a radial-inlet mixed-flow compressor that reducing tip clearance from 1 to 0.25 mm enhanced pressure ratio by 4.52% and improved isentropic efficiency by 2.5%. Sakulkaew et al. [Reference Sakulkaew, Tan, Donahoo, Cornelius and Montgomery11] identified non-monotonic response characteristics of efficiency: when the clearance is below 0.8% chord length, the competitive interaction between leakage mixing loss and viscous shear loss creates an optimal efficiency point; within 0.8%–3.4% chord length range, efficiency linearly decreases with increasing clearance; beyond 3.4% chord length, the sensitivity of efficiency to clearance variation diminishes significantly. Notably, increased tip clearance not only exacerbates steady-state performance losses but also significantly alters unsteady flow characteristics [Reference Rong, Jun, Xuegao, Chao and Wenyu12]. Numerical investigations by Du et al. [Reference Du, Lin, Zhang and Chen13] on NASA Rotor 67 revealed that tip clearances exceeding 1.1% tip chord length induce self-sustained unsteady oscillations in leakage flow fields. At 2.2% chord length clearance, the secondary vortex cores generated by leakage vortex breakdown increased by 40%, accompanied by a 2.3-fold amplification of static pressure fluctuation amplitude. Peng et al. [Reference Peng, Zhang, Wang, Zhang and Li14] confirmed the triggering effect of leakage vortex breakdown on unsteady flows, identifying that the migration of secondary vortex cores induced by leakage vortex-shock interaction constitutes the primary source of pressure fluctuations, whose frequency characteristics transition from single-frequency to broadband with operational condition variations. Through full-annulus simulations, Li et al. [Reference Li, Wu, Tian and Ouyang15] revealed the correlation between tip rotational instability and 31 flow disturbance units, with dynamic mode decomposition further demonstrating that the circumferential modal characteristics of disturbance waves exhibit strong coupling with leakage vortex breakdown processes.
The influence of surface roughness on compressor performance arises from its modification of boundary layer transition and flow separation characteristics [Reference Yu and Howell16]. Bammert et al. [Reference Bammert and Woelk17] experimentally compared smooth and rough blades, demonstrating that increased blade roughness significantly narrows stable operating range while reducing total pressure ratio and efficiency. This stems from roughness-induced flow disturbances – increased blade/passage roughness modifies boundary layer characteristics, with disturbance location critically influencing performance degradation. Morini and Aldi et al. [Reference Morini, Pinelli, Spina and Venturini18–Reference Morini, Pinelli, Spina and Venturini20] numerically demonstrated in NASA Stage 37 that suction-surface roughness exerts stronger effects than pressure-surface, and rotor roughness impacts exceed stator effects. When rotor surface roughness Ra increases from 0.16 to 12.1
 $ \varphi$
m, mass flow, pressure ratio and efficiency all decline, with efficiency losses primarily arising from flow blockage rather than direct roughness losses. Malhotra et al. [Reference Malhotra, Goswami and Amboor Madathil21] further revealed that rotor tip-region roughness causes particularly severe performance deterioration, with leading-edge roughness effects surpassing trailing-edge impacts, while certain localised roughness may unexpectedly improve performance.
Regarding roughness location mechanisms, Syverud et al. [Reference Syverud, Brekke and Bakken22] through GE J85-13 compressor salt-spray experiments showed blade fouling deposition levels at only half of stator values, with pressure-surface deposits generally exceeding suction-surface/endwall accumulations. Kong et al. [Reference Kong, Jeong and Song23] found roughness induces strong turbulent separation in trailing-edge regions, increasing profile losses and altering wake circumferential distributions. Gbadebo et al. [Reference Gbadebo, Hynes and Cumpsty24] visualised that roughness from leading-edge to suction-surface peak locations aggravates 3D flow separation, while downstream regions exhibit minimal impacts. Suder et al. [Reference Suder, Chima, Strazisar and Roberts25] in NASA Stage 37 blades indicated limited pressure-surface roughness effects, attributing performance degradation primarily to leading-edge roughness and blade thickness increases. Back et al. [Reference Back, Hobson, Song and Millsaps26, Reference Back, Sohn and Song27] emphasised that roughness effects in the suction-surface aft region are most significant and found that when Reynolds number exceeds a critical value, the sensitivity of compressor losses and blade loading to roughness is significantly enhanced. These studies collectively demonstrate that performance degradation fundamentally results from 3D flow separation-induced blockage and consequent mass flow reduction, with location-dependent effects arising from varying boundary layer disturbance intensities.
While domestic and international scholars have separately investigated abradable coating wear mechanisms, tip clearance effects on leakage flow, and surface roughness impacts, existing research predominantly focuses on single-factor analyses. Under actual operating conditions, coating wear typically exhibits non-uniform morphological characteristics. Particularly under high scraping speeds, coating materials’ dynamic responses may induce localised melting-recrystallisation phenomena, creating complex 3D tip-region morphologies whose quantitative impacts on unsteady leakage flow characteristics and overall performance remain unclear.
This study establishes computational models of wear morphologies for different hardness coatings under high-speed scraping conditions. Using numerical methods, we investigate structural changes in tip clearance leakage flow caused by coating scraping, revealing the influence laws of coating wear on compressor performance degradation, which provides theoretical support for optimising aero-engine tip clearance design and coating selection.
2.0 Method
2.1 Casing scraping model development
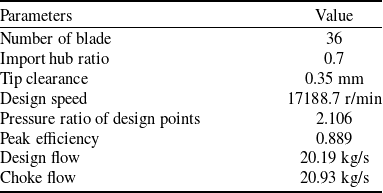
This study focuses on a transonic compressor rotor, Rotor 37. The rotor consists of a casing, blades and a hub, with detailed design specifications provided in Table 1.
Design parameters of Rotor 37

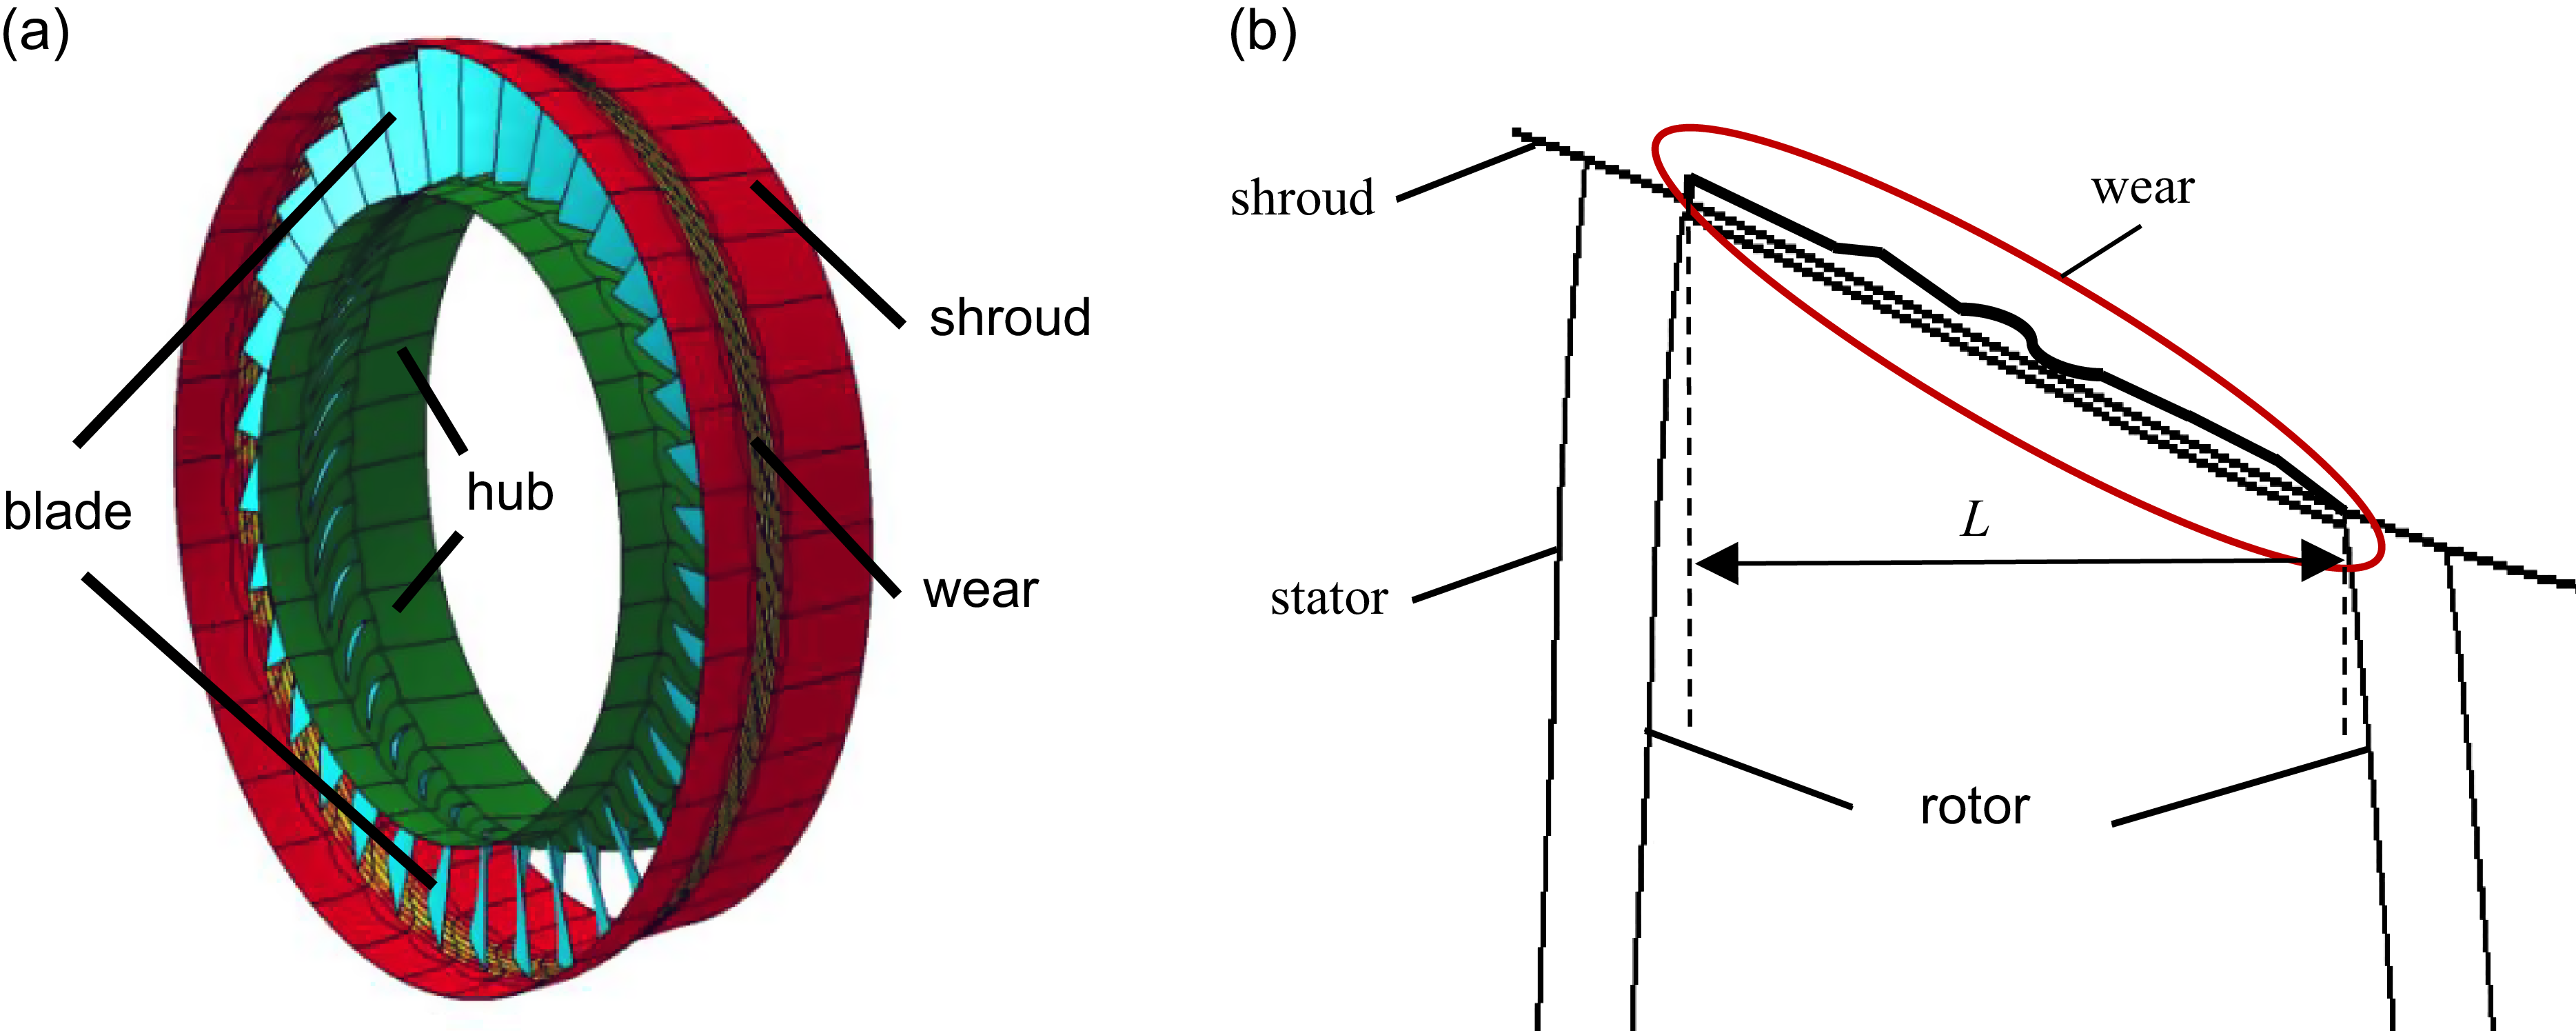
Figure 1 shows the schematic diagram of the blade-casing geometric structure after coating wear. Following the preparation method in Ref. (Reference Qiao, Sun, Ding, Zhang, Liao and W6), aluminum-silicon polyester sealing coatings with hardness values of HR15Y 45, 60 and 75 were fabricated, designated as low-hardness, medium-hardness and high-hardness specimens, respectively. These coatings were subjected to scraping tests at a tip speed of 190 m/s.
The structure of the blade-shroud. (a) Three-dimensional model of casing scraping and (b) two-dimensional model of casing scraping.

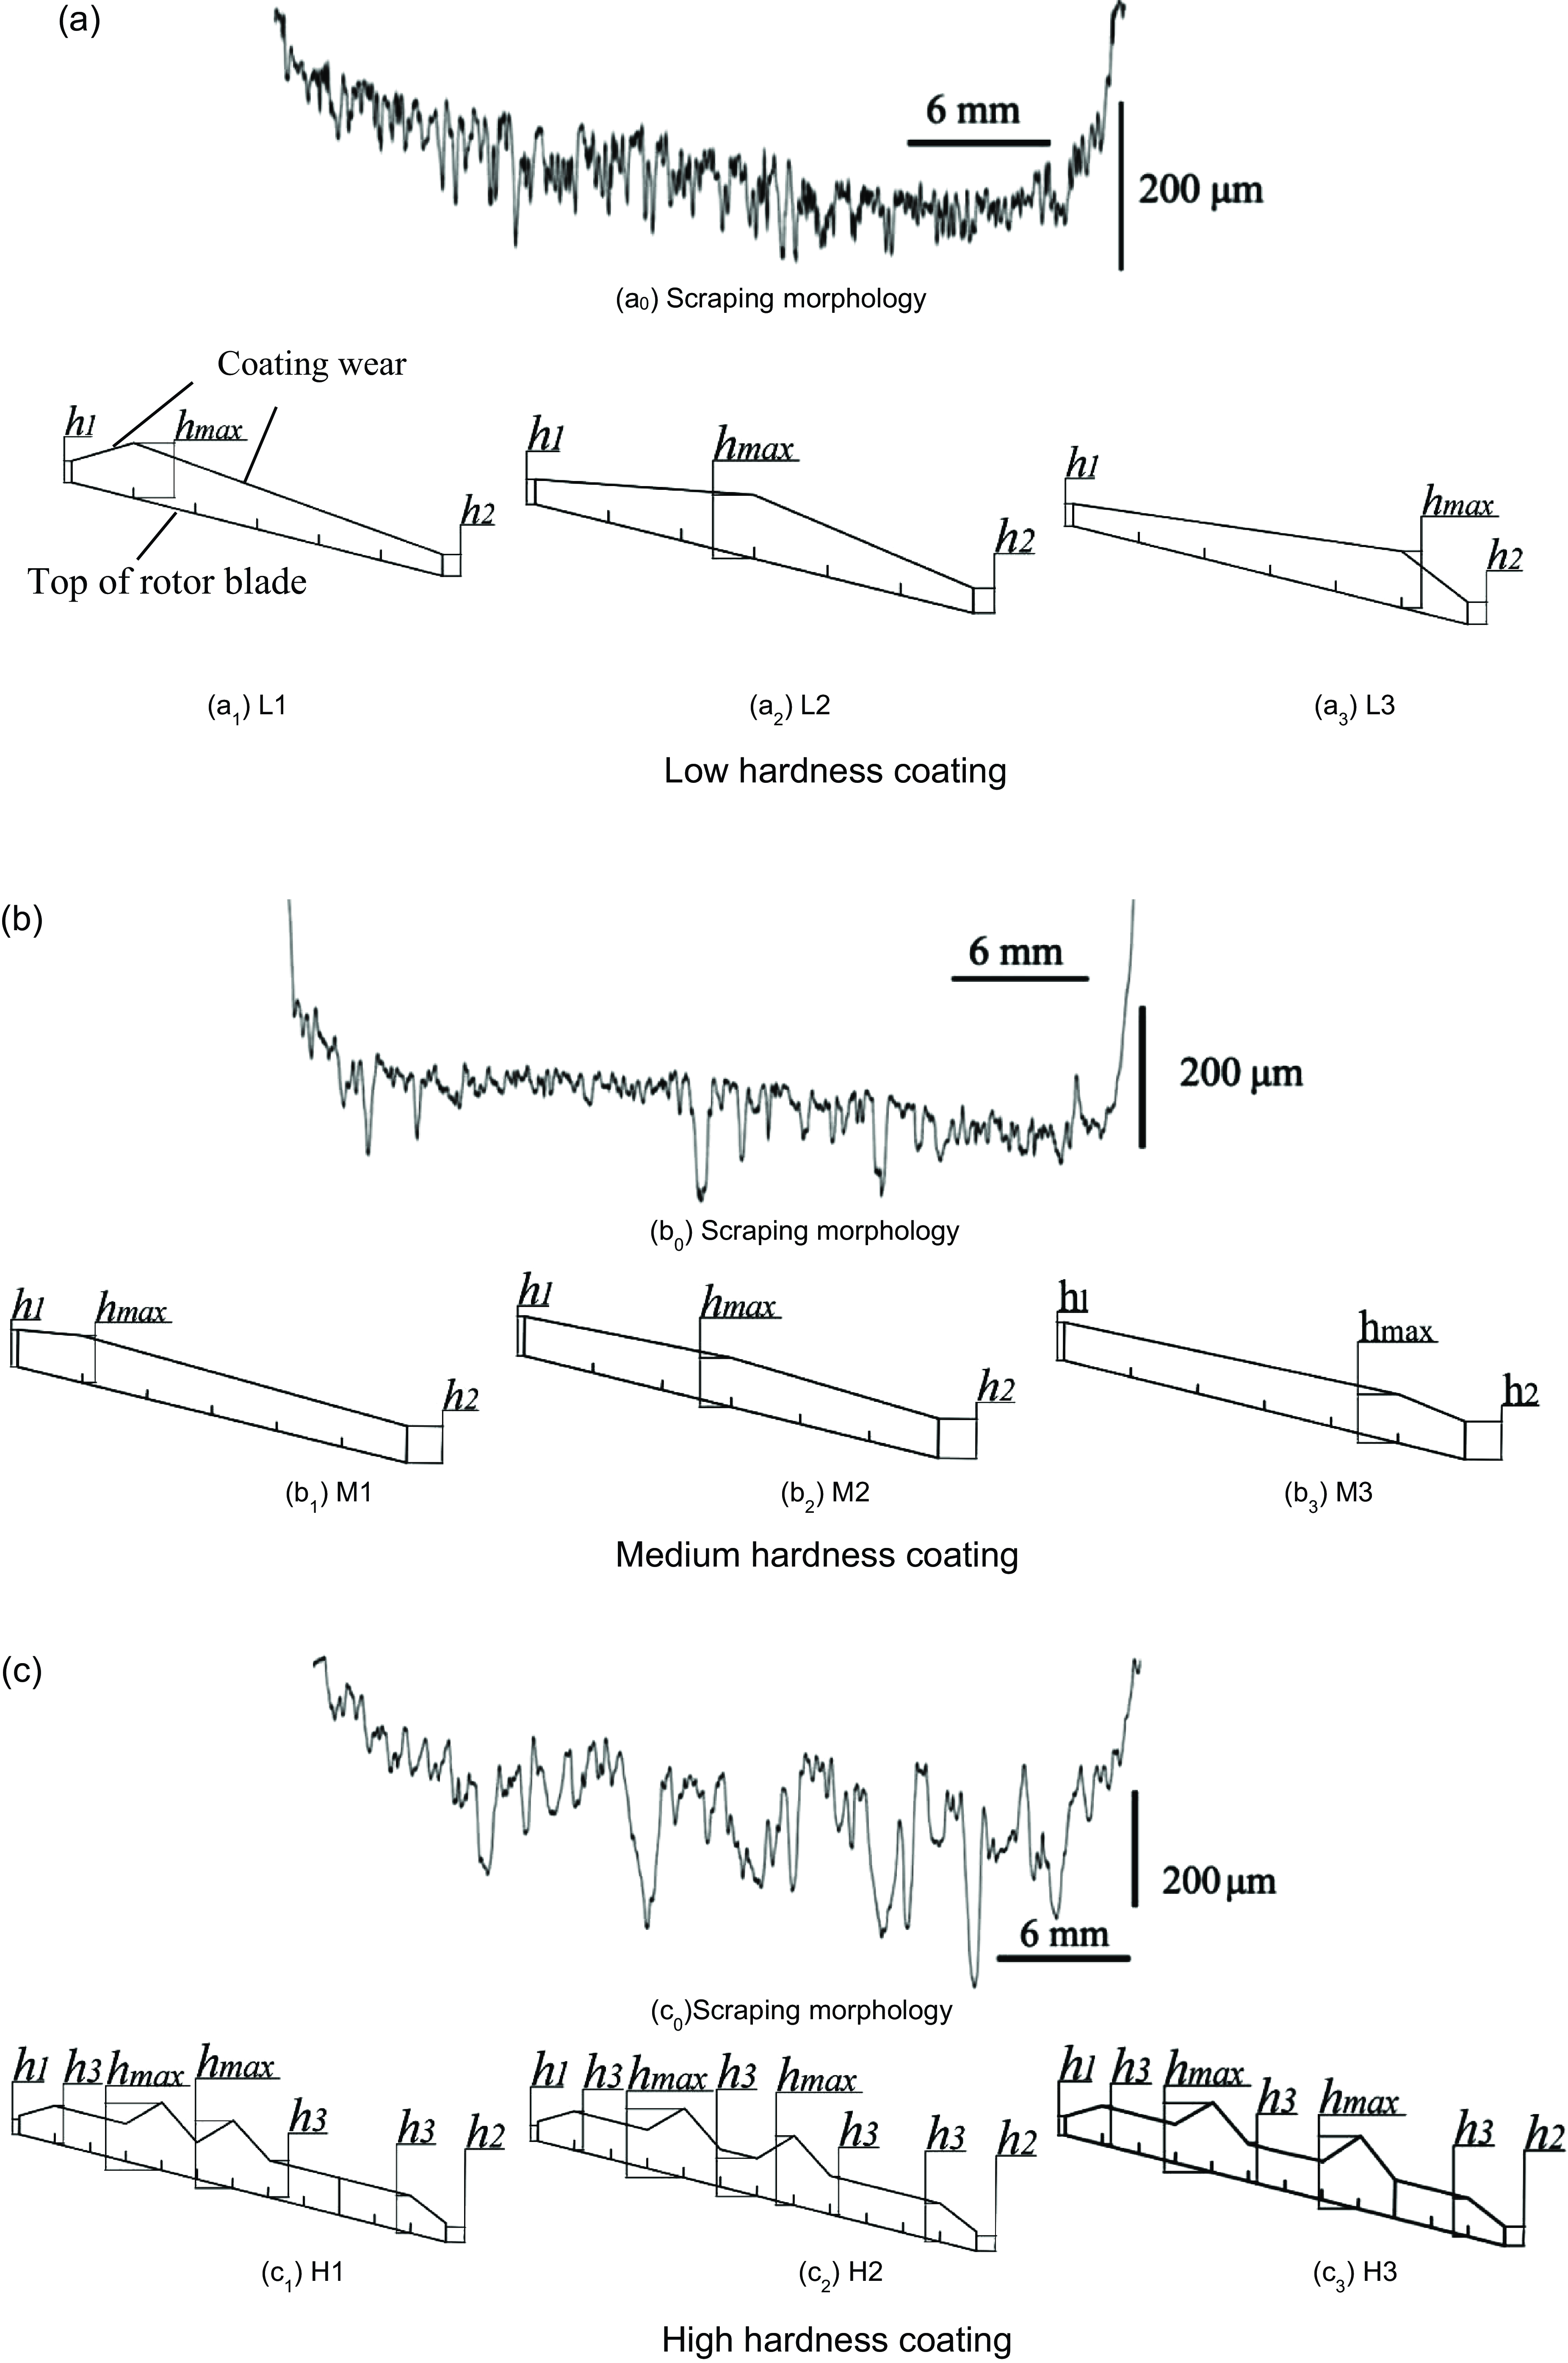
Figure 2 presents the actual topography of scraped regions and schematic diagrams of the simplified models for three coatings of different hardnesses at 190 m/s rotational speed. It can be observed that the casing geometry changes post-scraping: the scraped morphologies for low- and medium-hardness coatings both exhibit a roughly pentagonal profile. The scraping depths at positions relative to the blade edges (denoted as h1 and h2) and the maximum scraping depth at the blade mid-section (hmax) were extracted from the actual topography. The high-hardness coating displayed a more complex morphology, so the scraping depth at the blade mid-section was divided into two parts: a smaller depth (h3) and the maximum depth (hmax). To enhance the generality of simulation results, three simplified models were developed by positioning hmax at the casing locations corresponding to the blade leading edge, mid-section and trailing edge. Minor ‘ploughing groove’ morphologies were simulated via surface roughness. Since the scraping depth is negligible relative to the blade width, its representation in the schematic diagram was exaggerated tenfold for clarity in illustrating the modeling methodology. Geometric parameters of the simplified models are detailed in Table 2.
Real morphology and simplified model of scraping area of different hardness coatings. (a) Low hardness coating, (b) medium hardness coating and (c) high hardness coating.

2.2 Calculation method
This study employs the NUMECA FINE/TURBO flow solver to numerically solve the steady three-dimensional Reynolds-averaged Navier-Stokes (RANS) equations. The Spalart-Allmaras turbulence model with wall functions and a second-order upwind discretisation scheme are adopted to obtain steady-state solutions. The working fluid is modeled as an ideal gas. The inlet boundary is defined as axial inflow with a total temperature of 288.15 K and total pressure of 101, 325 Pa. The outlet boundary condition specifies an average static pressure, which is varied to simulate different operating conditions.
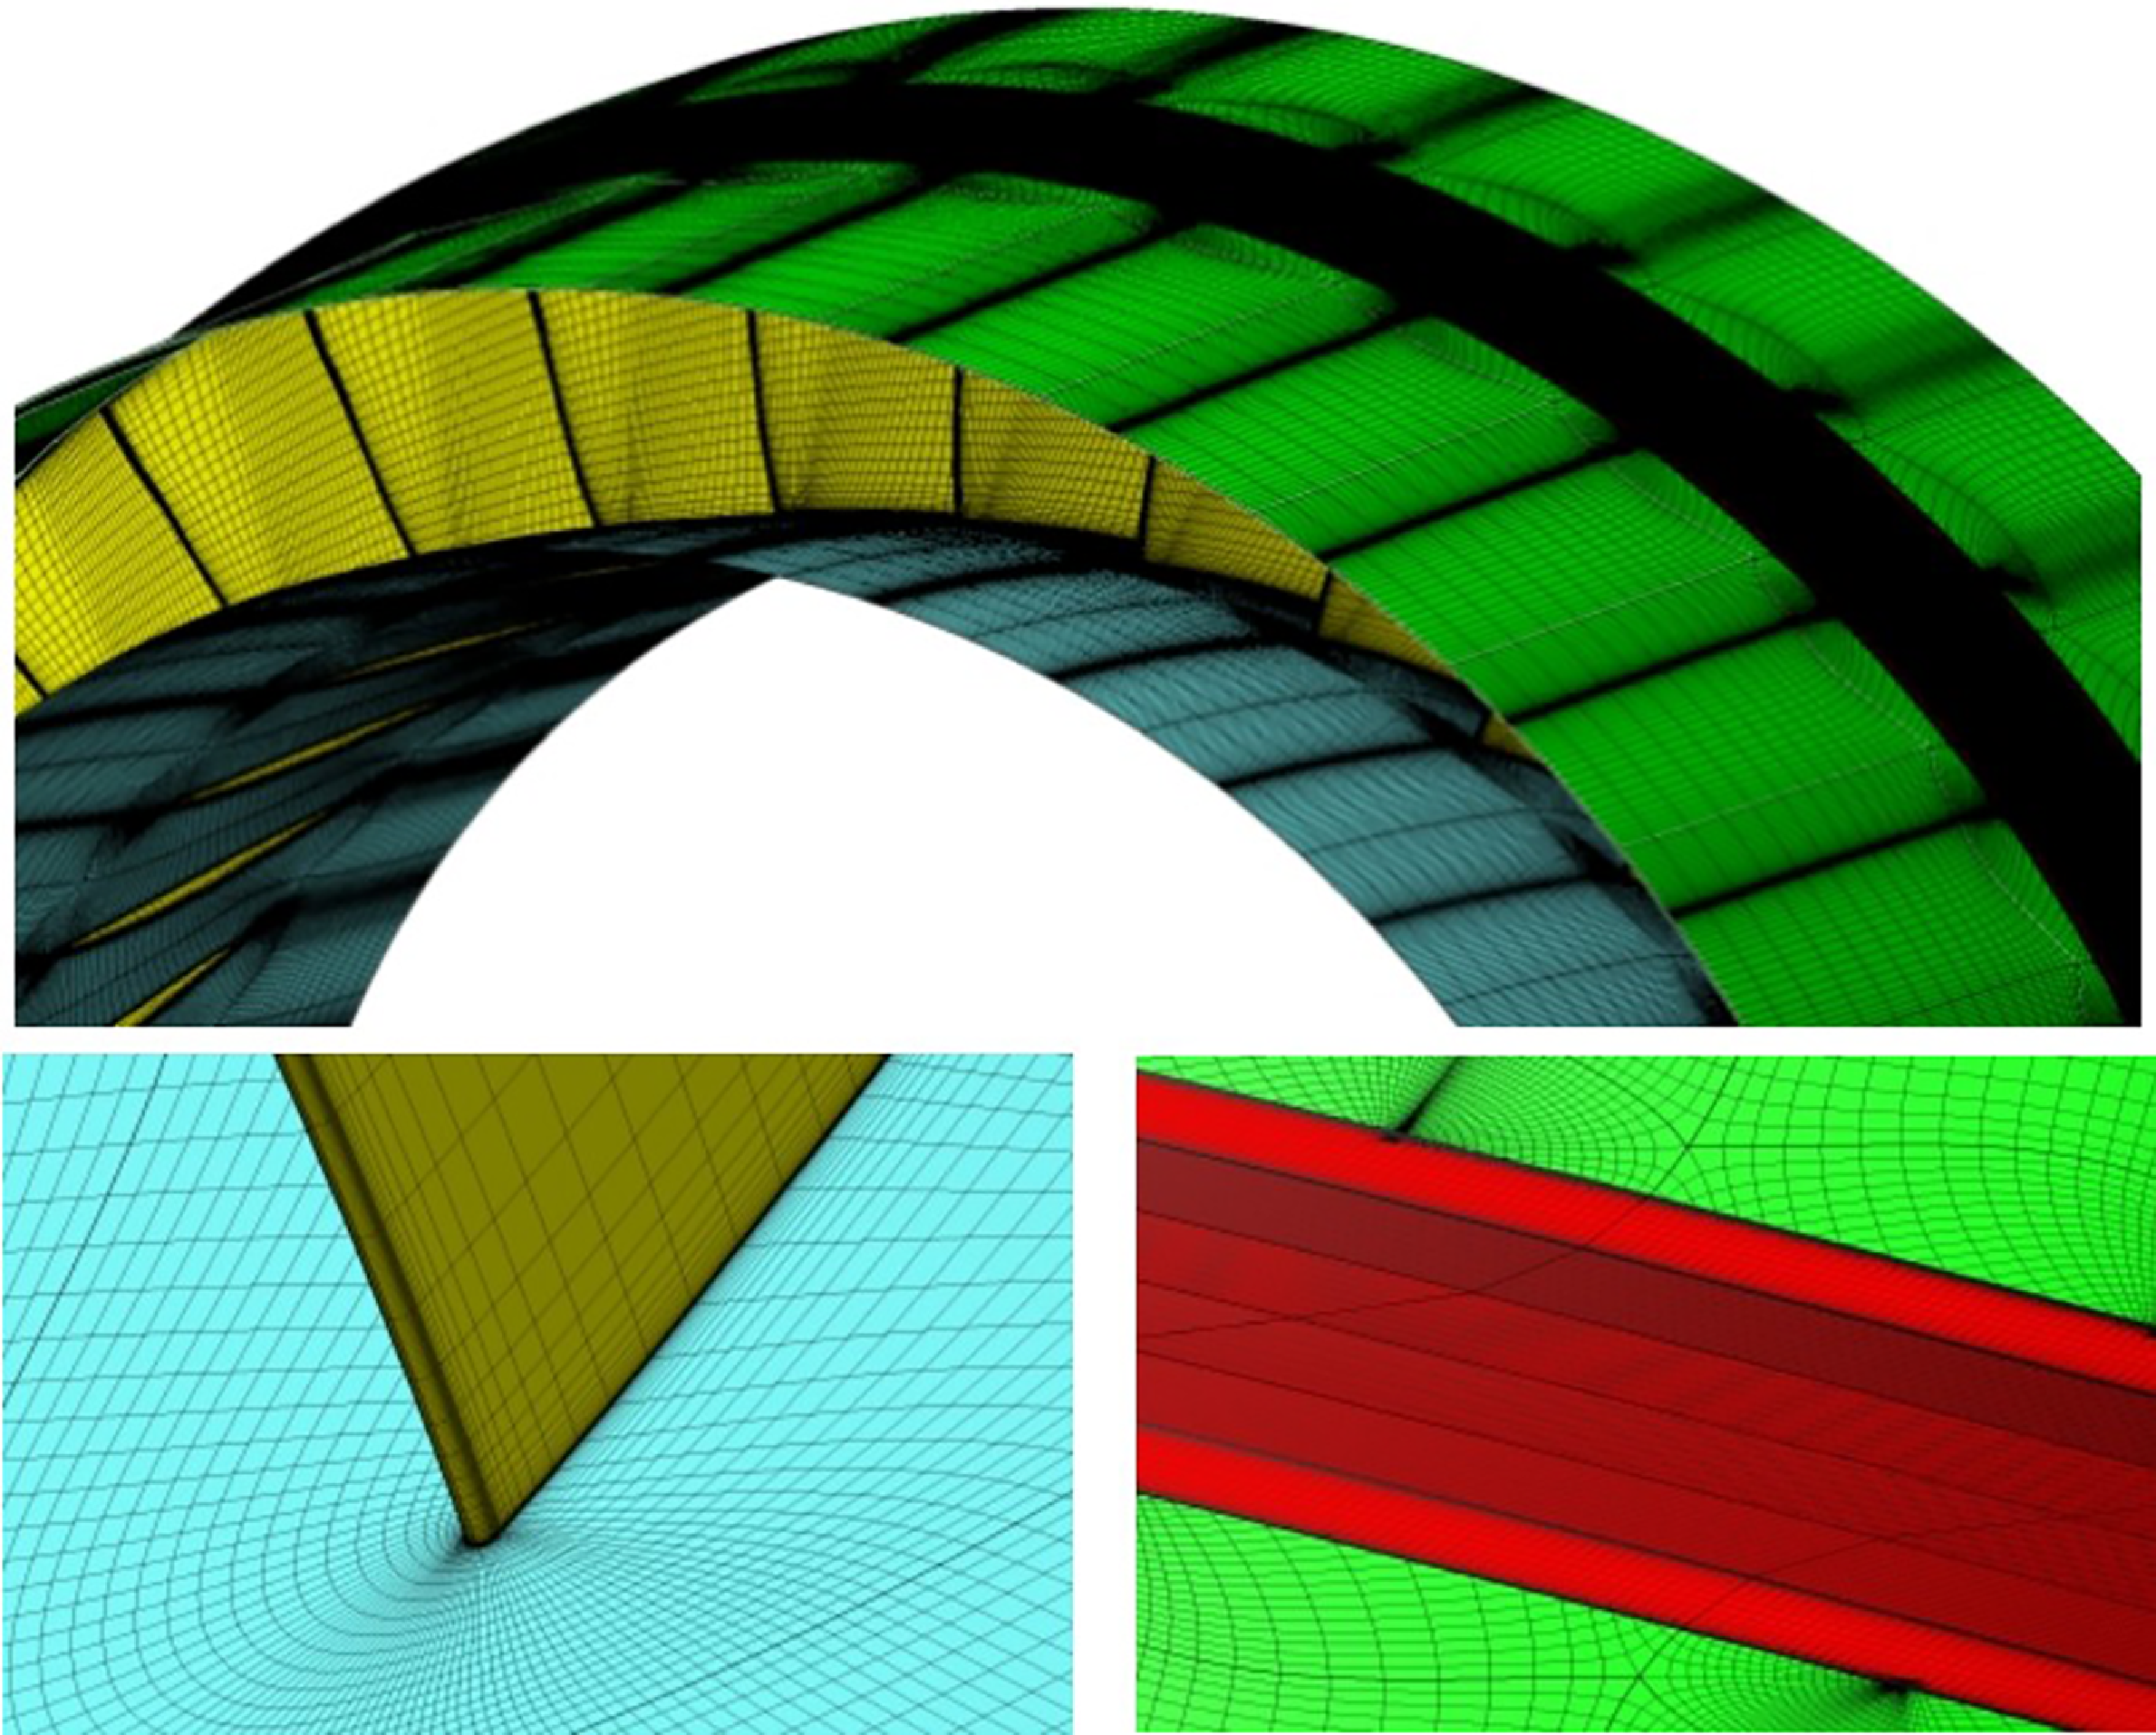
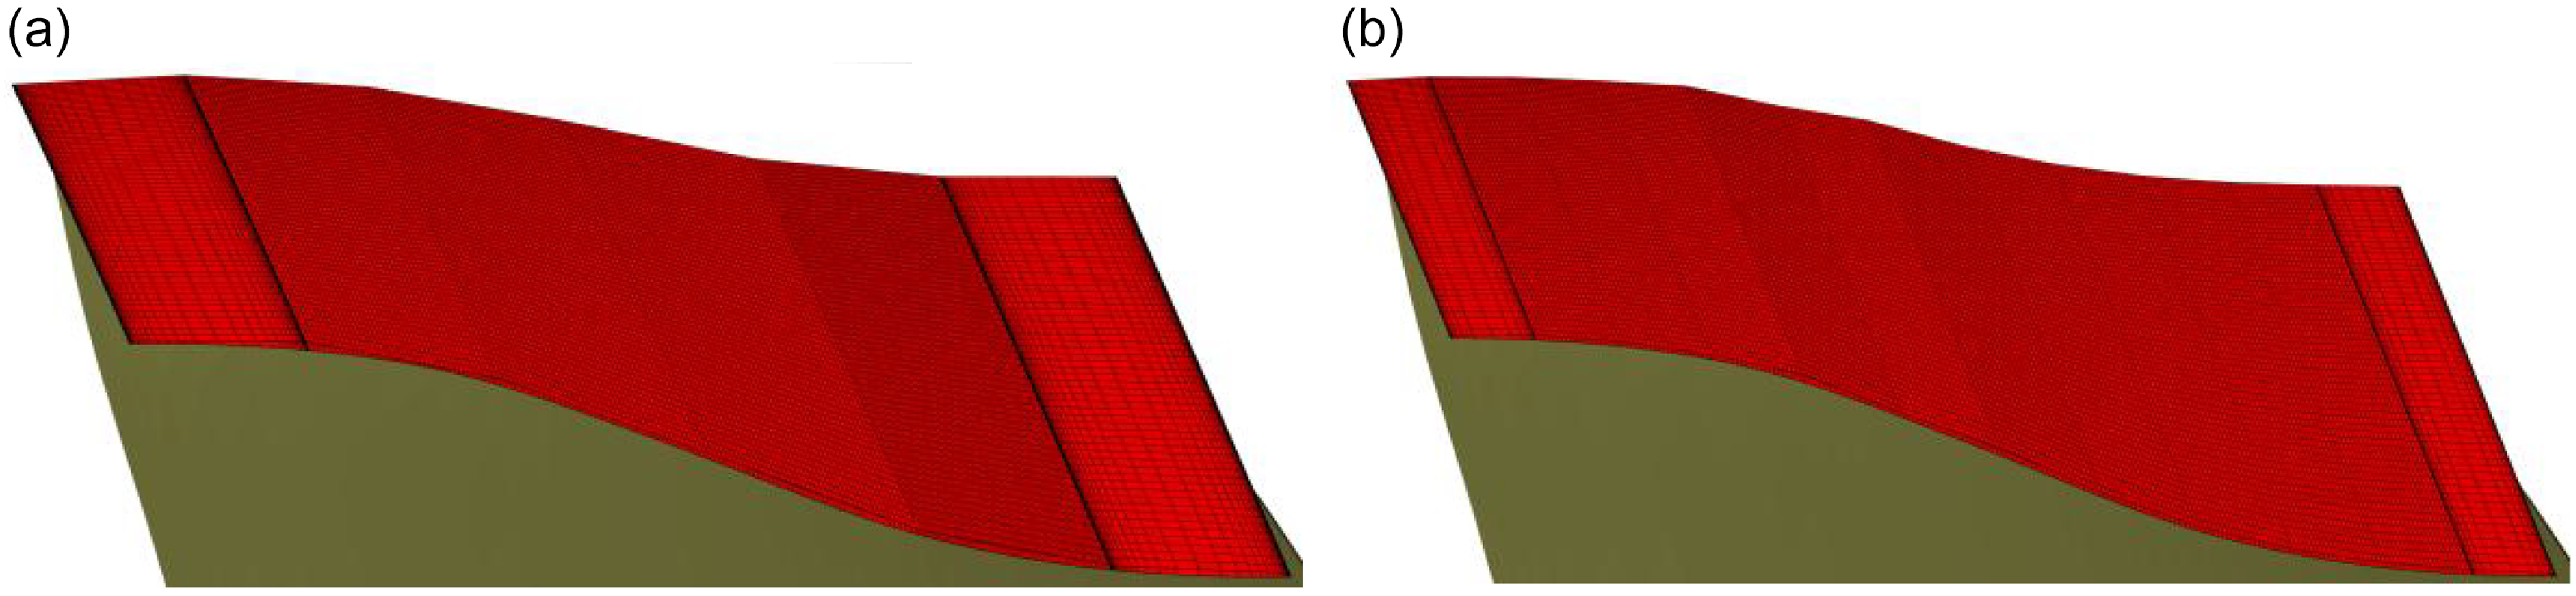
An HOH-topology structured grid is generated in the main flow passage using AutoGrid5, with O-type grids applied to the tip clearance region. All solid-wall boundary layers are treated with refined mesh, where the first-layer grid height is set to 3 × 10⁻⁶ m, to achieve y + = 1. The grid configuration is illustrated in Fig. 3.
It is noteworthy that when performing mesh division for worn areas of the casing, multiple grid blocks are employed to discretise the computational domain. For low-hardness coating and medium-hardness coating, the worn regions are divided into 6 grid blocks respectively, while 12 grid blocks are used for high-hardness coating. The uneven characteristics of the casing wear areas are simulated by controlling the edge length of the grid blocks. Figure 4 corresponds to L1 and H1 wear zone block divisions. Additionally, roughness is defined in the casing’s worn regions, specifically on the left-side face of the first grid block, the right-side face of the last grid block and the top surfaces of all grid blocks. The interior faces are connected with grids to ensure the continuity of fluid flow, heat transfer and other physical quantities.
2.3 Model validation
In compressor design and testing, isentropic efficiency is commonly employed to evaluate performance. Isentropic efficiency is defined as the ratio of the actual mechanical work (consumed work) required for the real, frictional, adiabatic entropy-increasing compression process to the ideal mechanical work (isentropic compression work) required for a frictionless, adiabatic isentropic process.
Geometric parameters of scraping area under different coating hardness conditions

Meshing of computational model.

Grid block partitioning of worn regions for casings with different hardness coatings. (a) L1 and (b) H1.

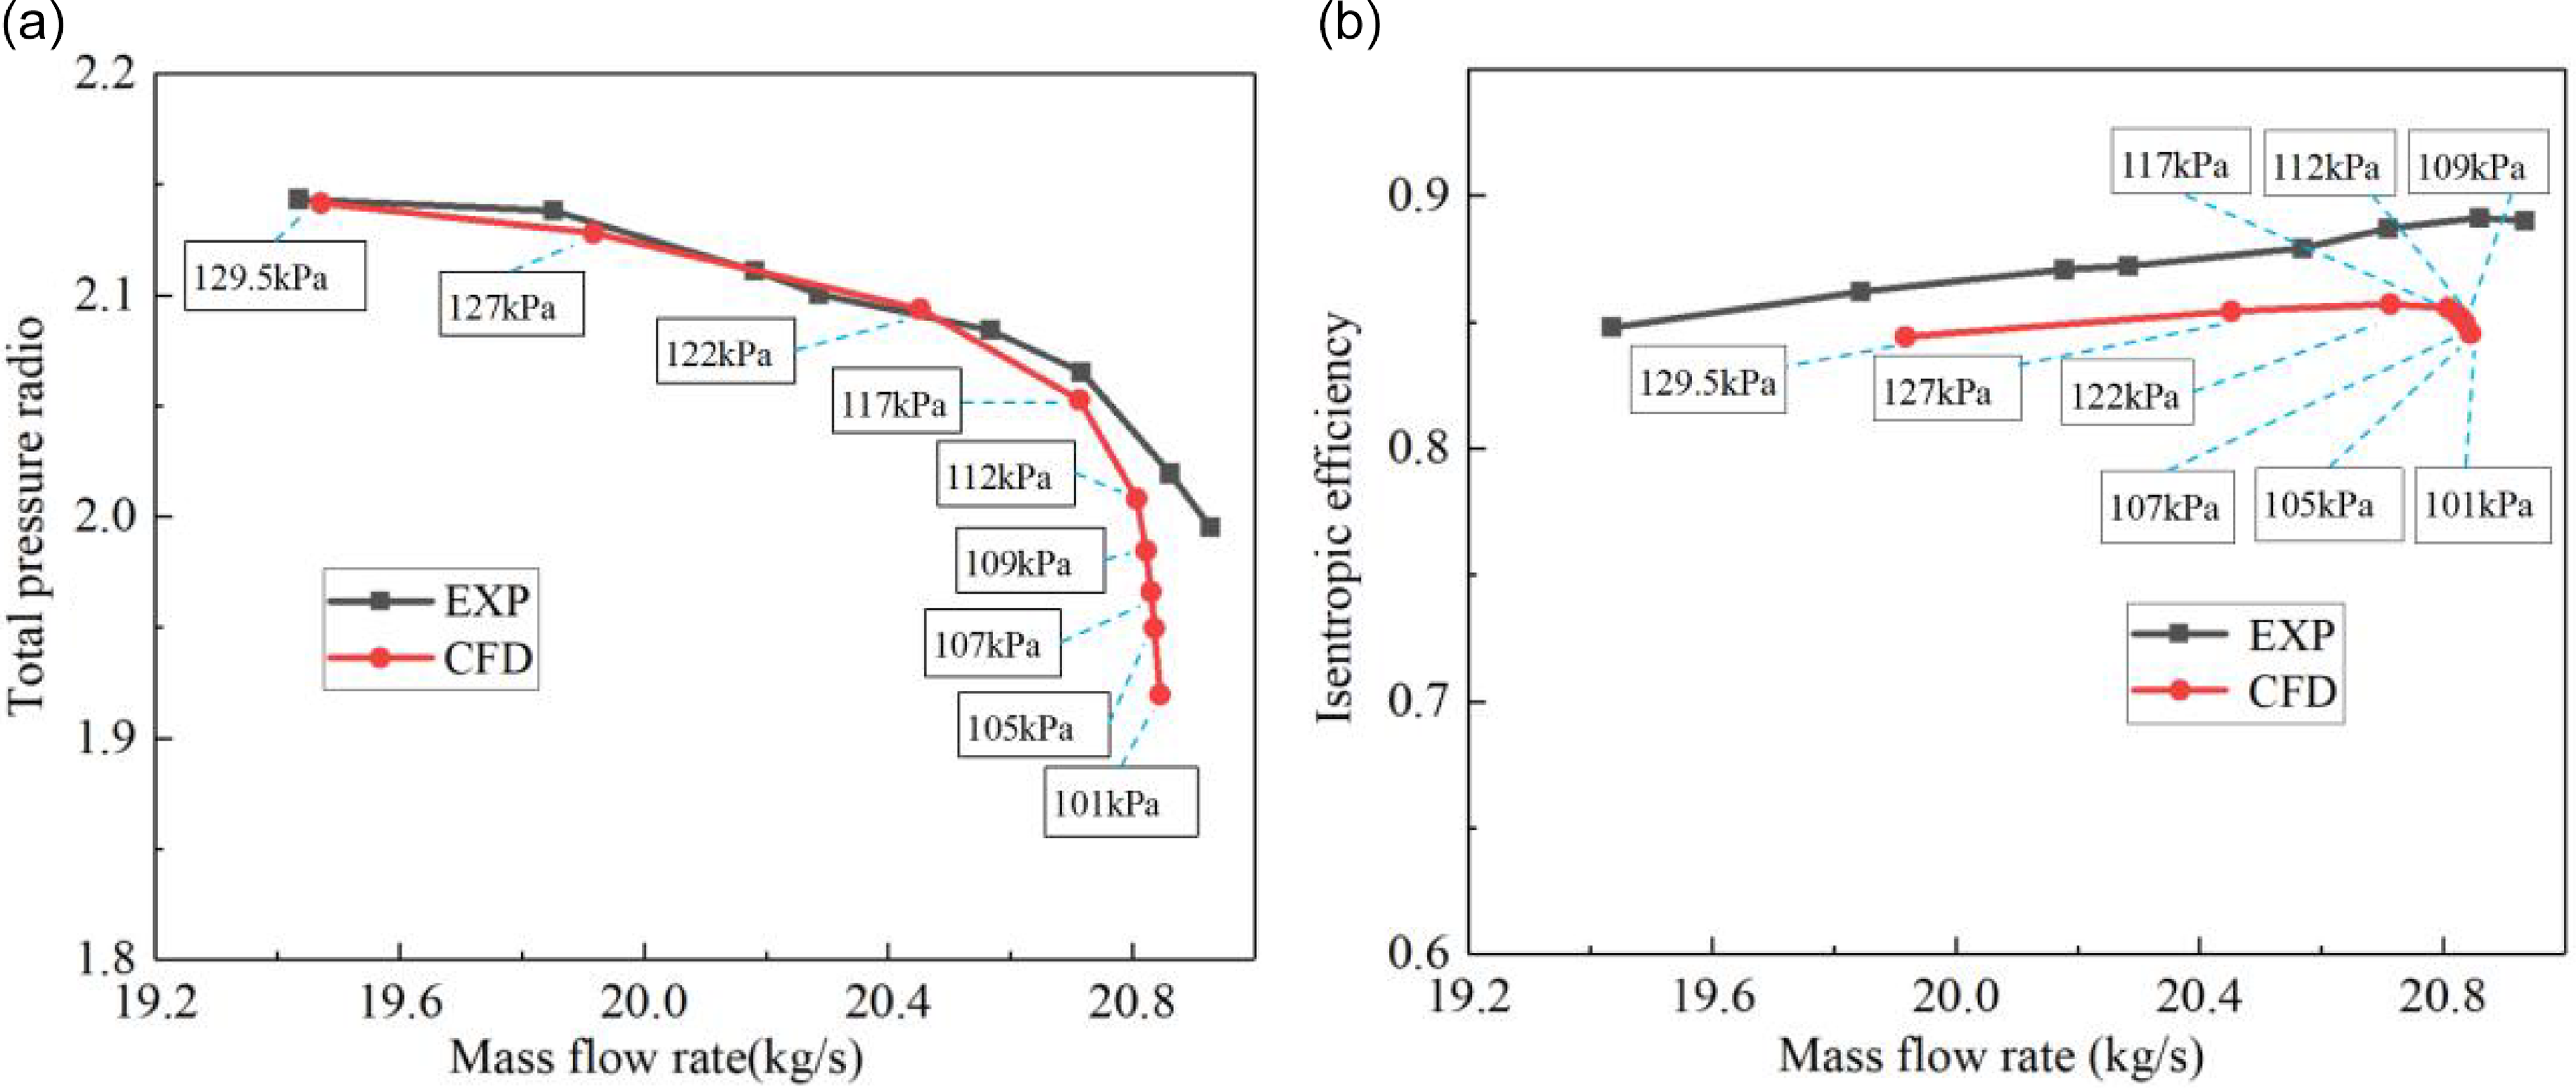
Figure 5 presents a comparison between numerical and experimental results for the pressure ratio characteristics and isentropic efficiency characteristics of Rotor 37 at 100% design rotational speed. The total pressure ratio and isentropic efficiency are defined as follows:
 \begin{align}\pi &= {{{p_{out}}} \over {{p_{in}}}} \\[-10pt] \nonumber \end{align}
 \begin{align}{\eta _I} &= \frac{{{h_{2s}} - {h_1}}}{{{h_2} - {h_1}}}\end{align}
Comparison of experimental data and simulation data. (a) Pressure radio and (b) efficiency.

where
 $\pi $
is the total pressure ratio,
 $ \eta$
I
is the isentropic efficiency, p
in
and p
out
are the total pressure of import and export, respectively, h1
is the inlet enthalpy, h2
is the actual outlet enthalpy and h2
s
is the isentropic outlet enthalpy.
As shown in the figure, the numerically calculated pressure ratio curve agrees well with experimental values, while the efficiency curve is approximately 3% lower. The study attributes this efficiency discrepancy to differences in averaging methods: numerical calculations perform mass-flow averaging across all grid points at varying blade spans and tip regions, whereas experimental data processing applies mass-flow averaging only to elemental performance at different spans, neglecting losses above those spanwise positions. This results in generally higher experimentally derived efficiency values. These findings align with simulations of Rotor 37 by most researchers, thereby validating the numerical methodology.
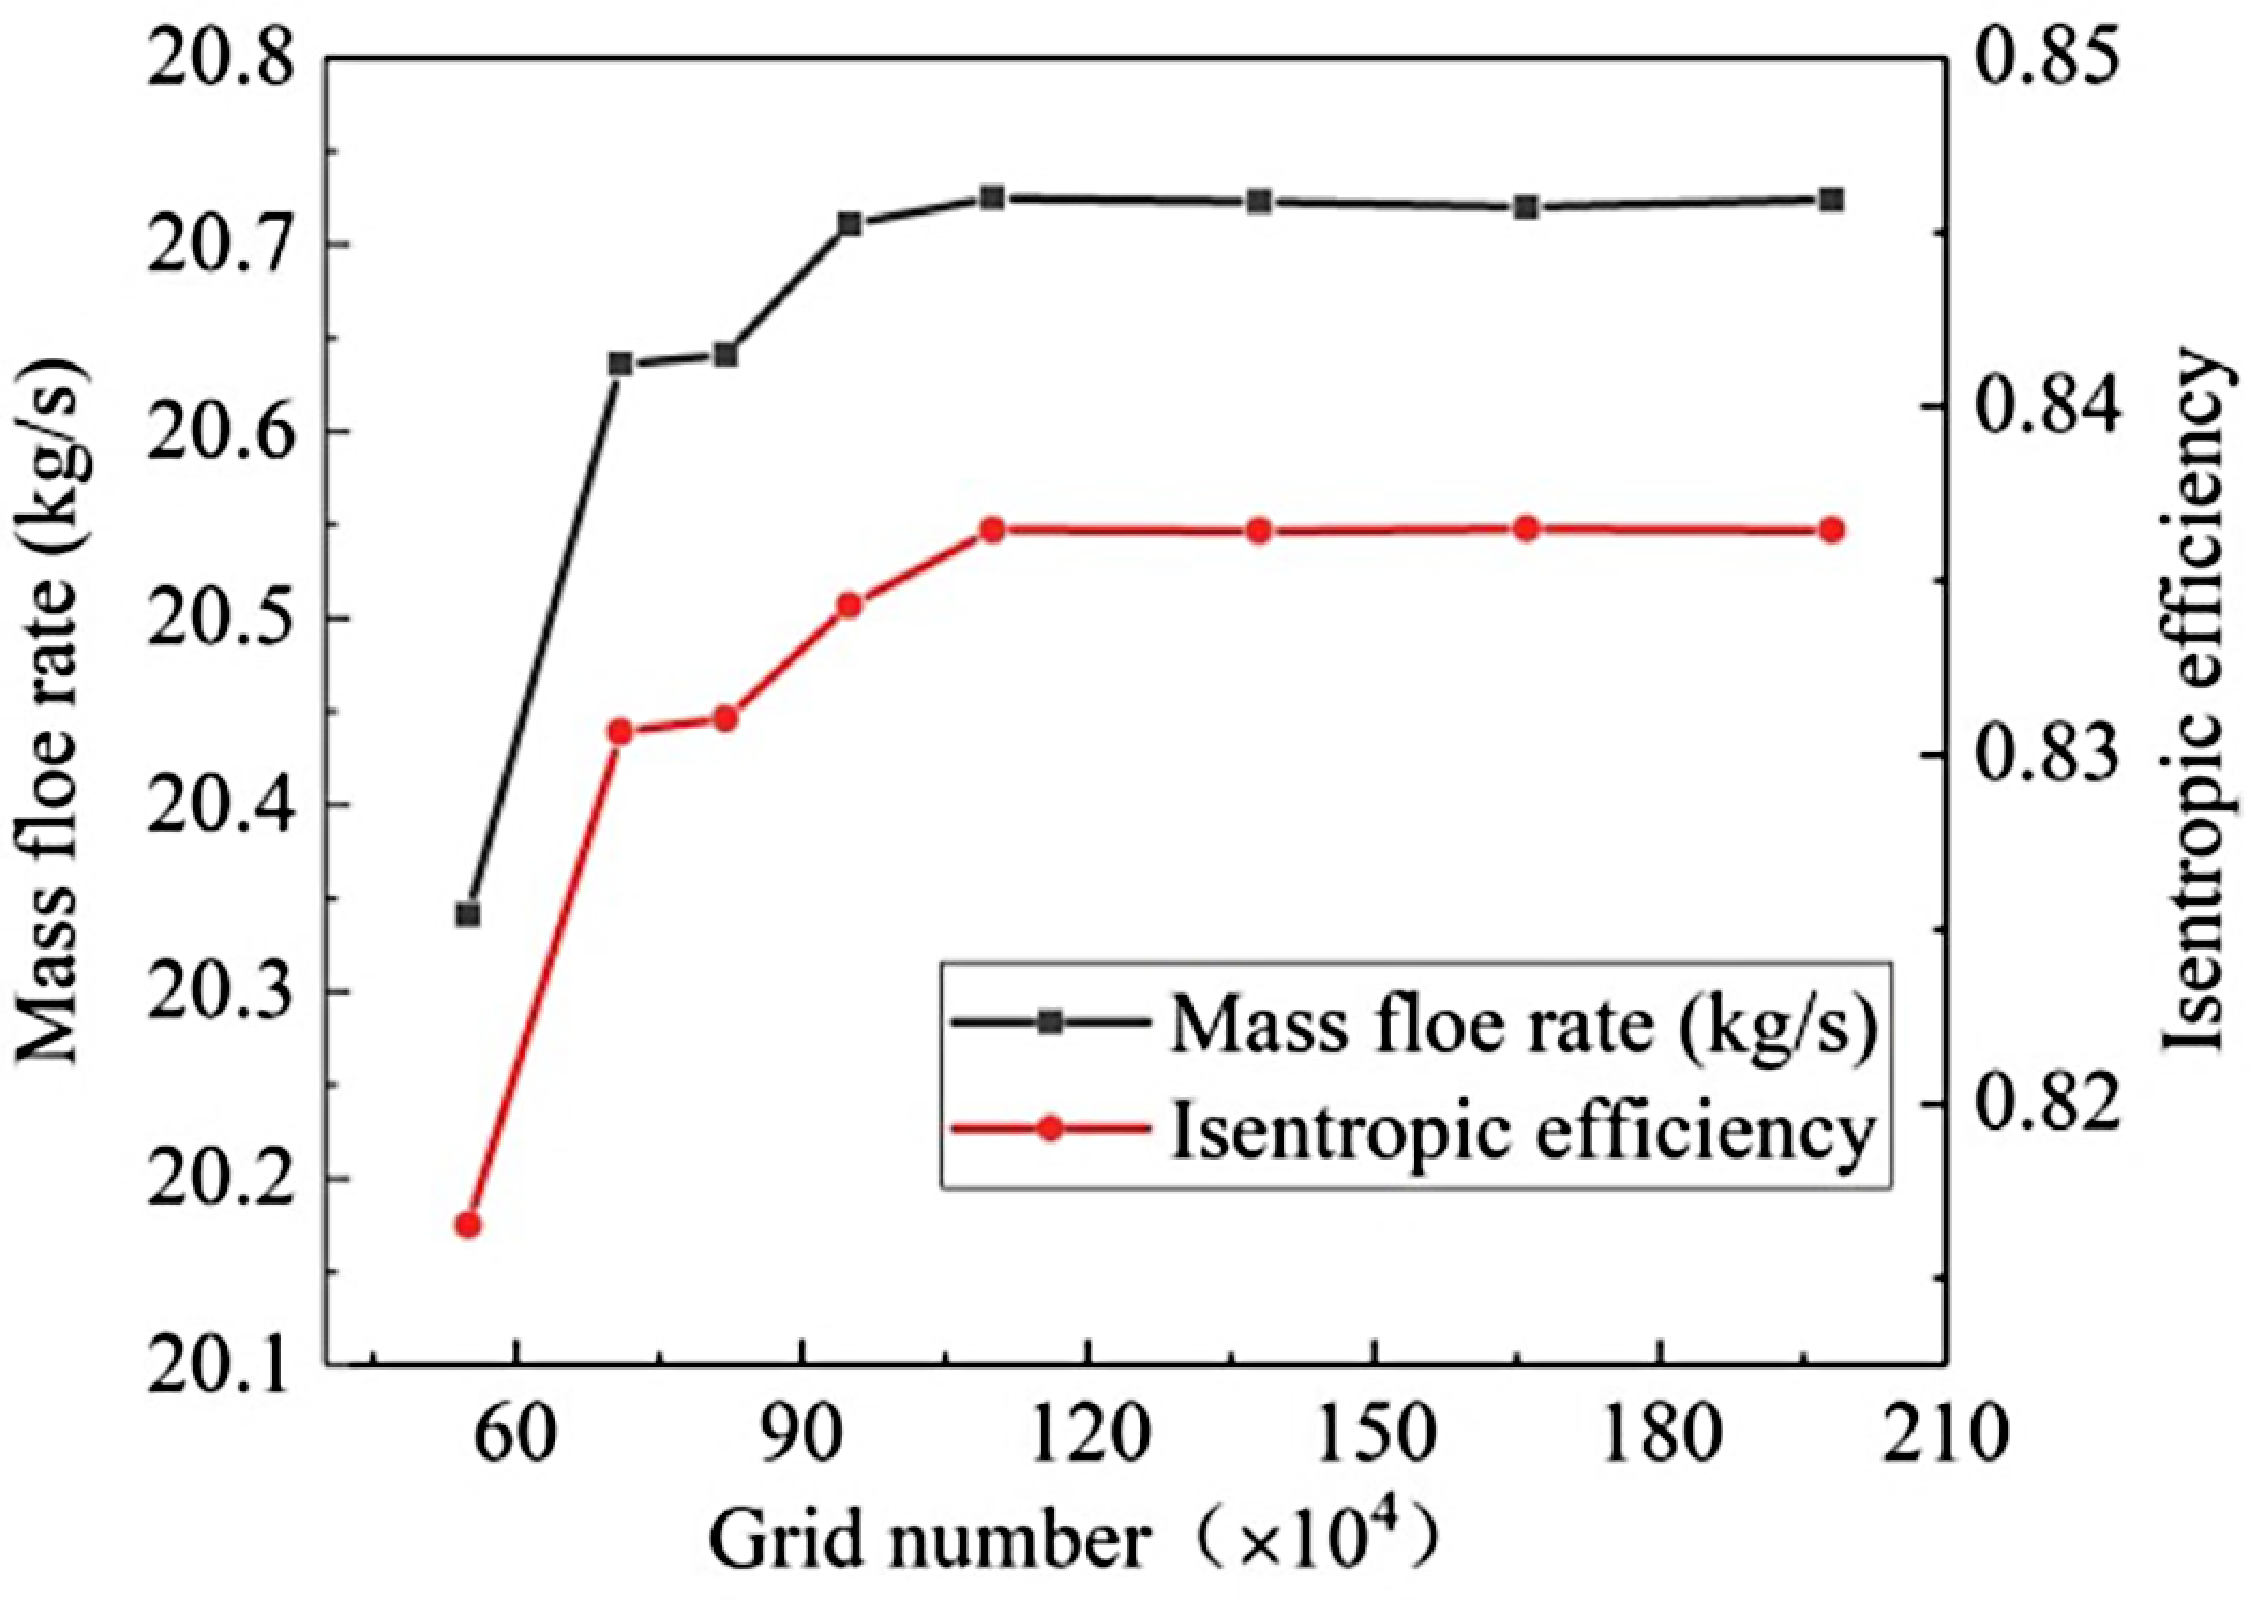
To ensure calculation accuracy and guarantee that the computational grid produces reliable results, this study evaluated the compressor performance parameters under the L2 scraping conditions using eight different grid density configurations, all sharing the same topological structure. The number of grid nodes in the circumferential direction within the interblade passage and the tip gap was locally controlled, resulting in total grid sizes of 0.55, 0.71, 0.82, 0.95, 1.10, 1.38, 1.66 and 1.98 million. The comparisons of compressor performance parameters for different grid sizes are shown in Fig. 6. As evident from the figure, when the grid size reached approximately 1.10 million, the compressor mass flow rate and isentropic efficiency exhibited minimal variations, indicating that grid independence was achieved. Therefore, the grid sizes used in this study were all above 1.10 million.
Comparison of compressor parameters under different grid numbers.

3.0 Results and discussion
3.1 Analysis of the impact of coating hardness and scraping morphology on rotor performance
Numerical simulations of the internal flow field in Rotor 37 under full-load design speed were conducted for coatings of varying hardness subjected to scraping. Outlet backpressures were set to 101, 102, 107 and 112 kPa for comparative analysis.
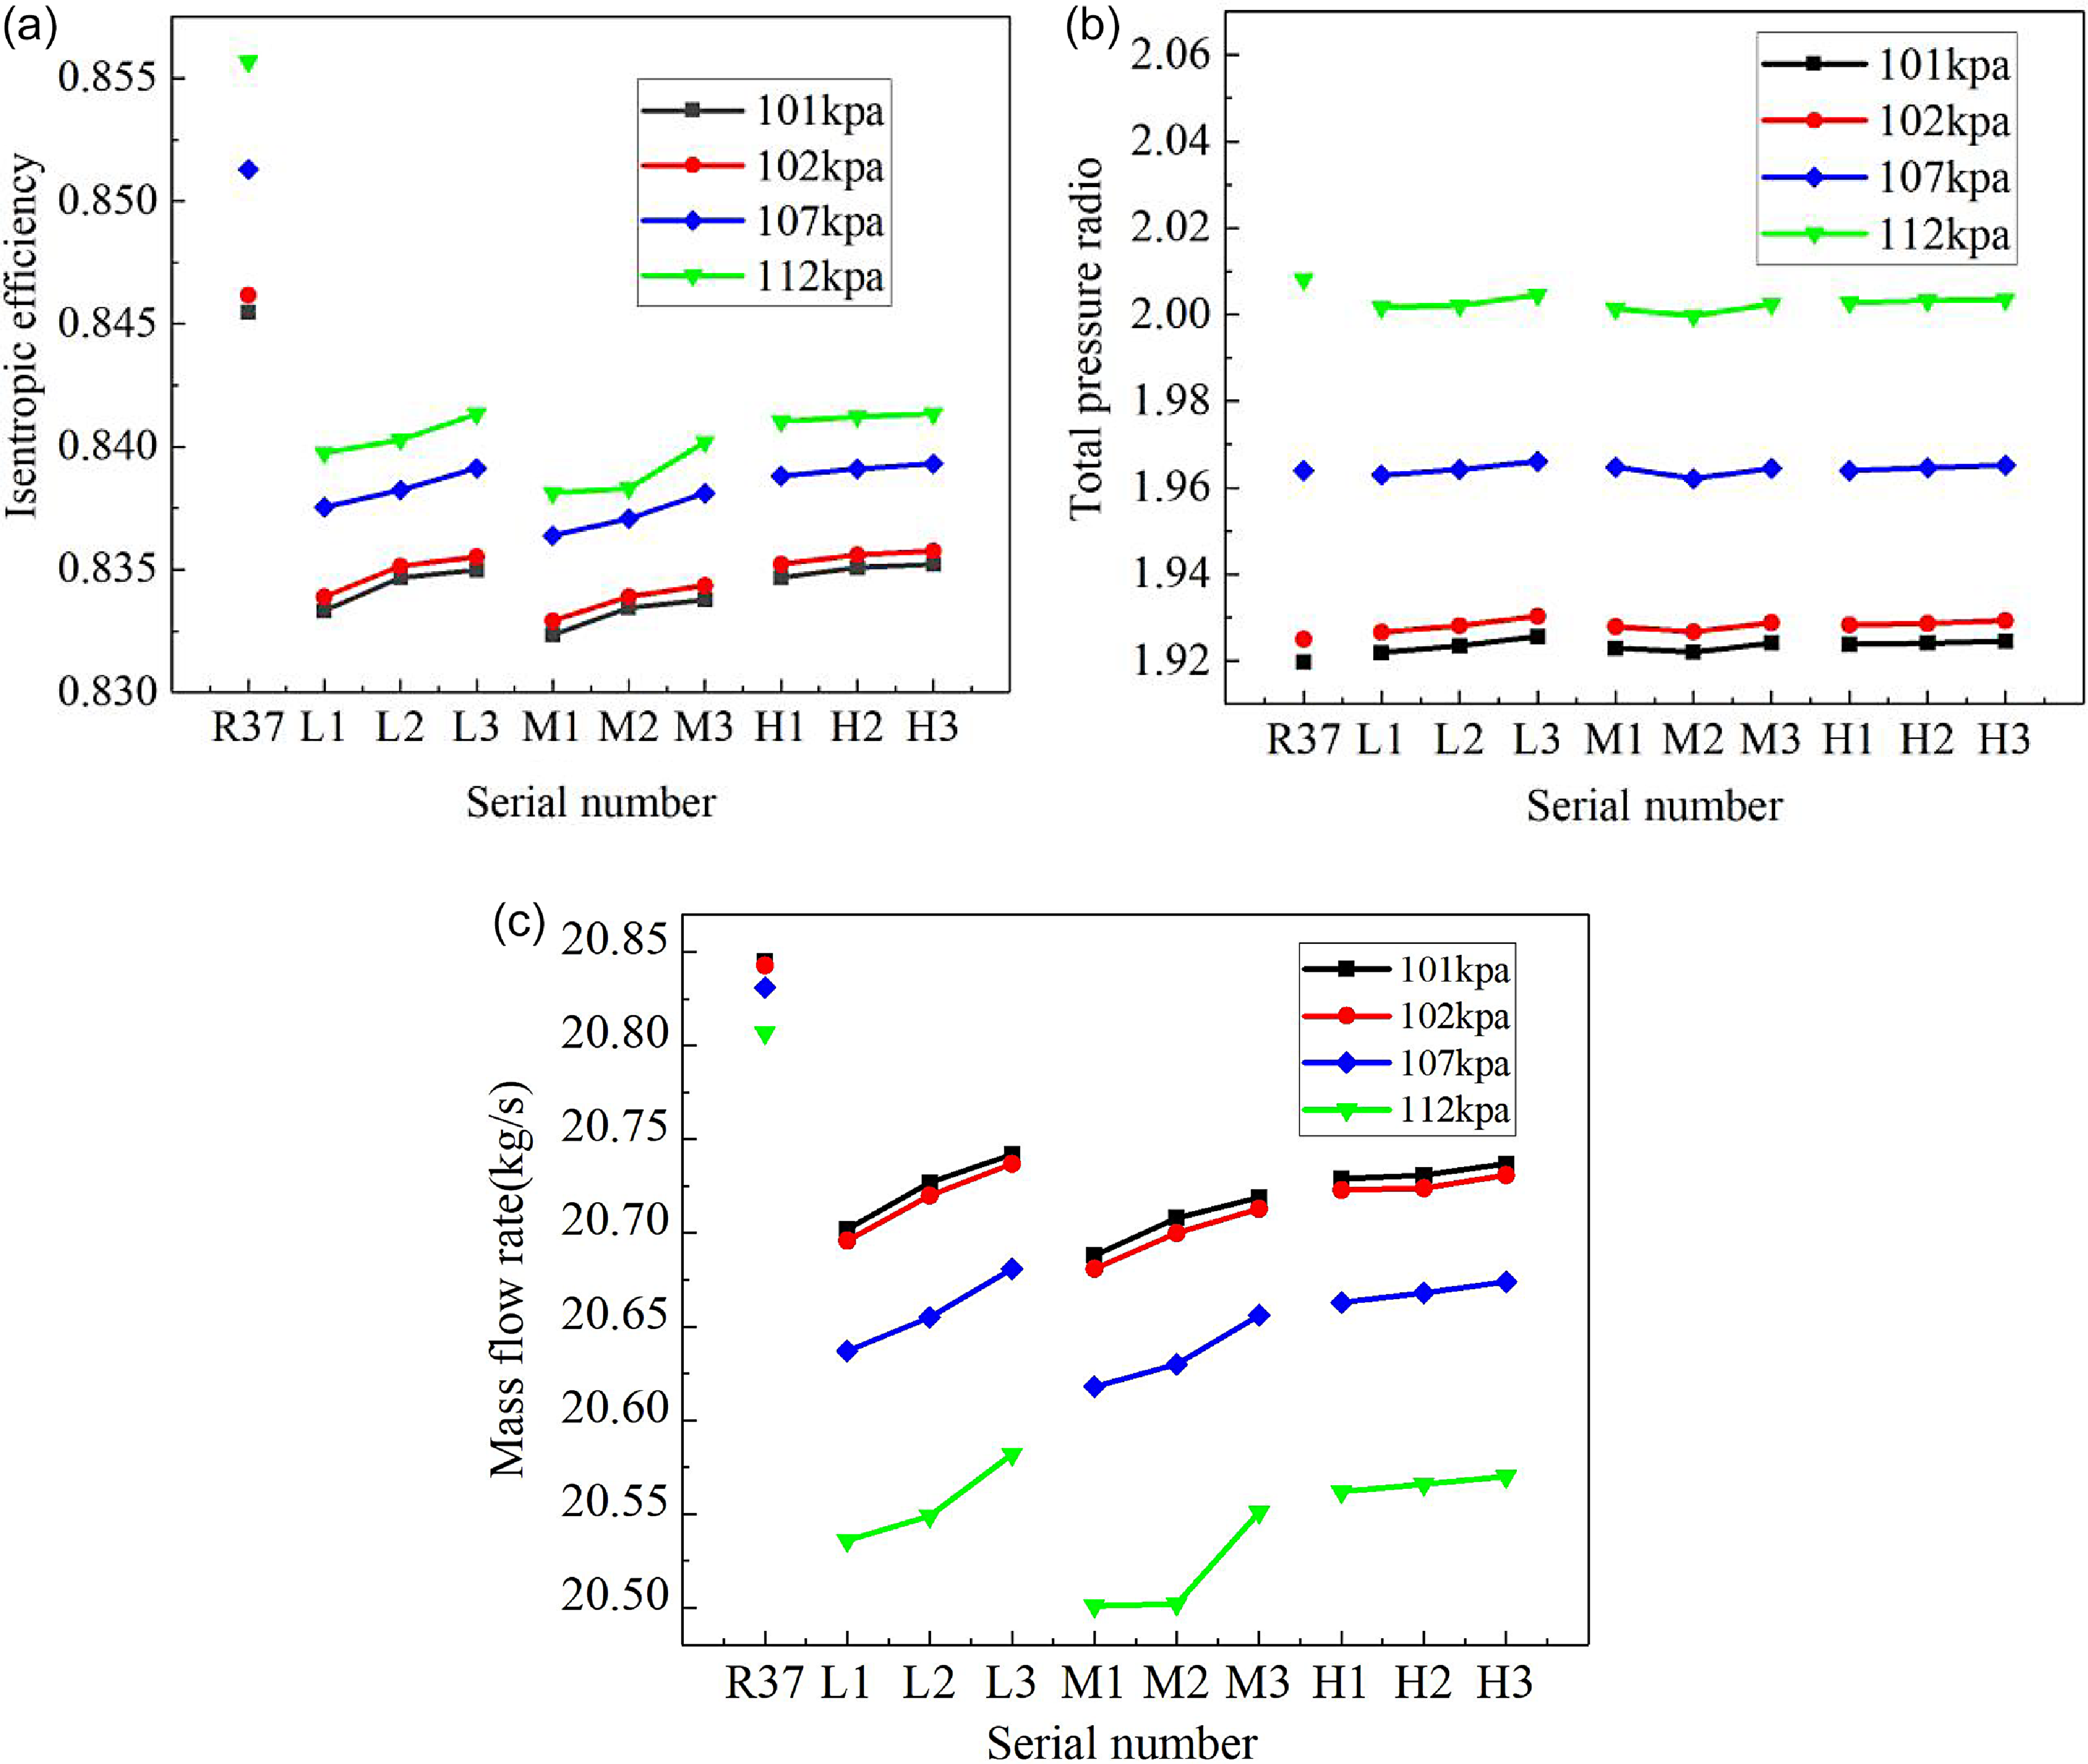
Figure 7 illustrates variations in compressor isentropic efficiency, pressure ratio, and outlet mass flow under different scraping conditions. Key observations include significant reductions in isentropic efficiency and outlet mass flow after coating scraping, with minimal changes in pressure ratio. Medium-hardness coatings exhibit the most severe compressor performance degradation. For coatings of identical hardness, efficiency and mass flow gradually increase as the deepest scraping position shifts rearward along the casing.
Compressor characteristics under different scraping conditions. (a) Efficiency, (b) pressure radio and (c) mass flow rate.

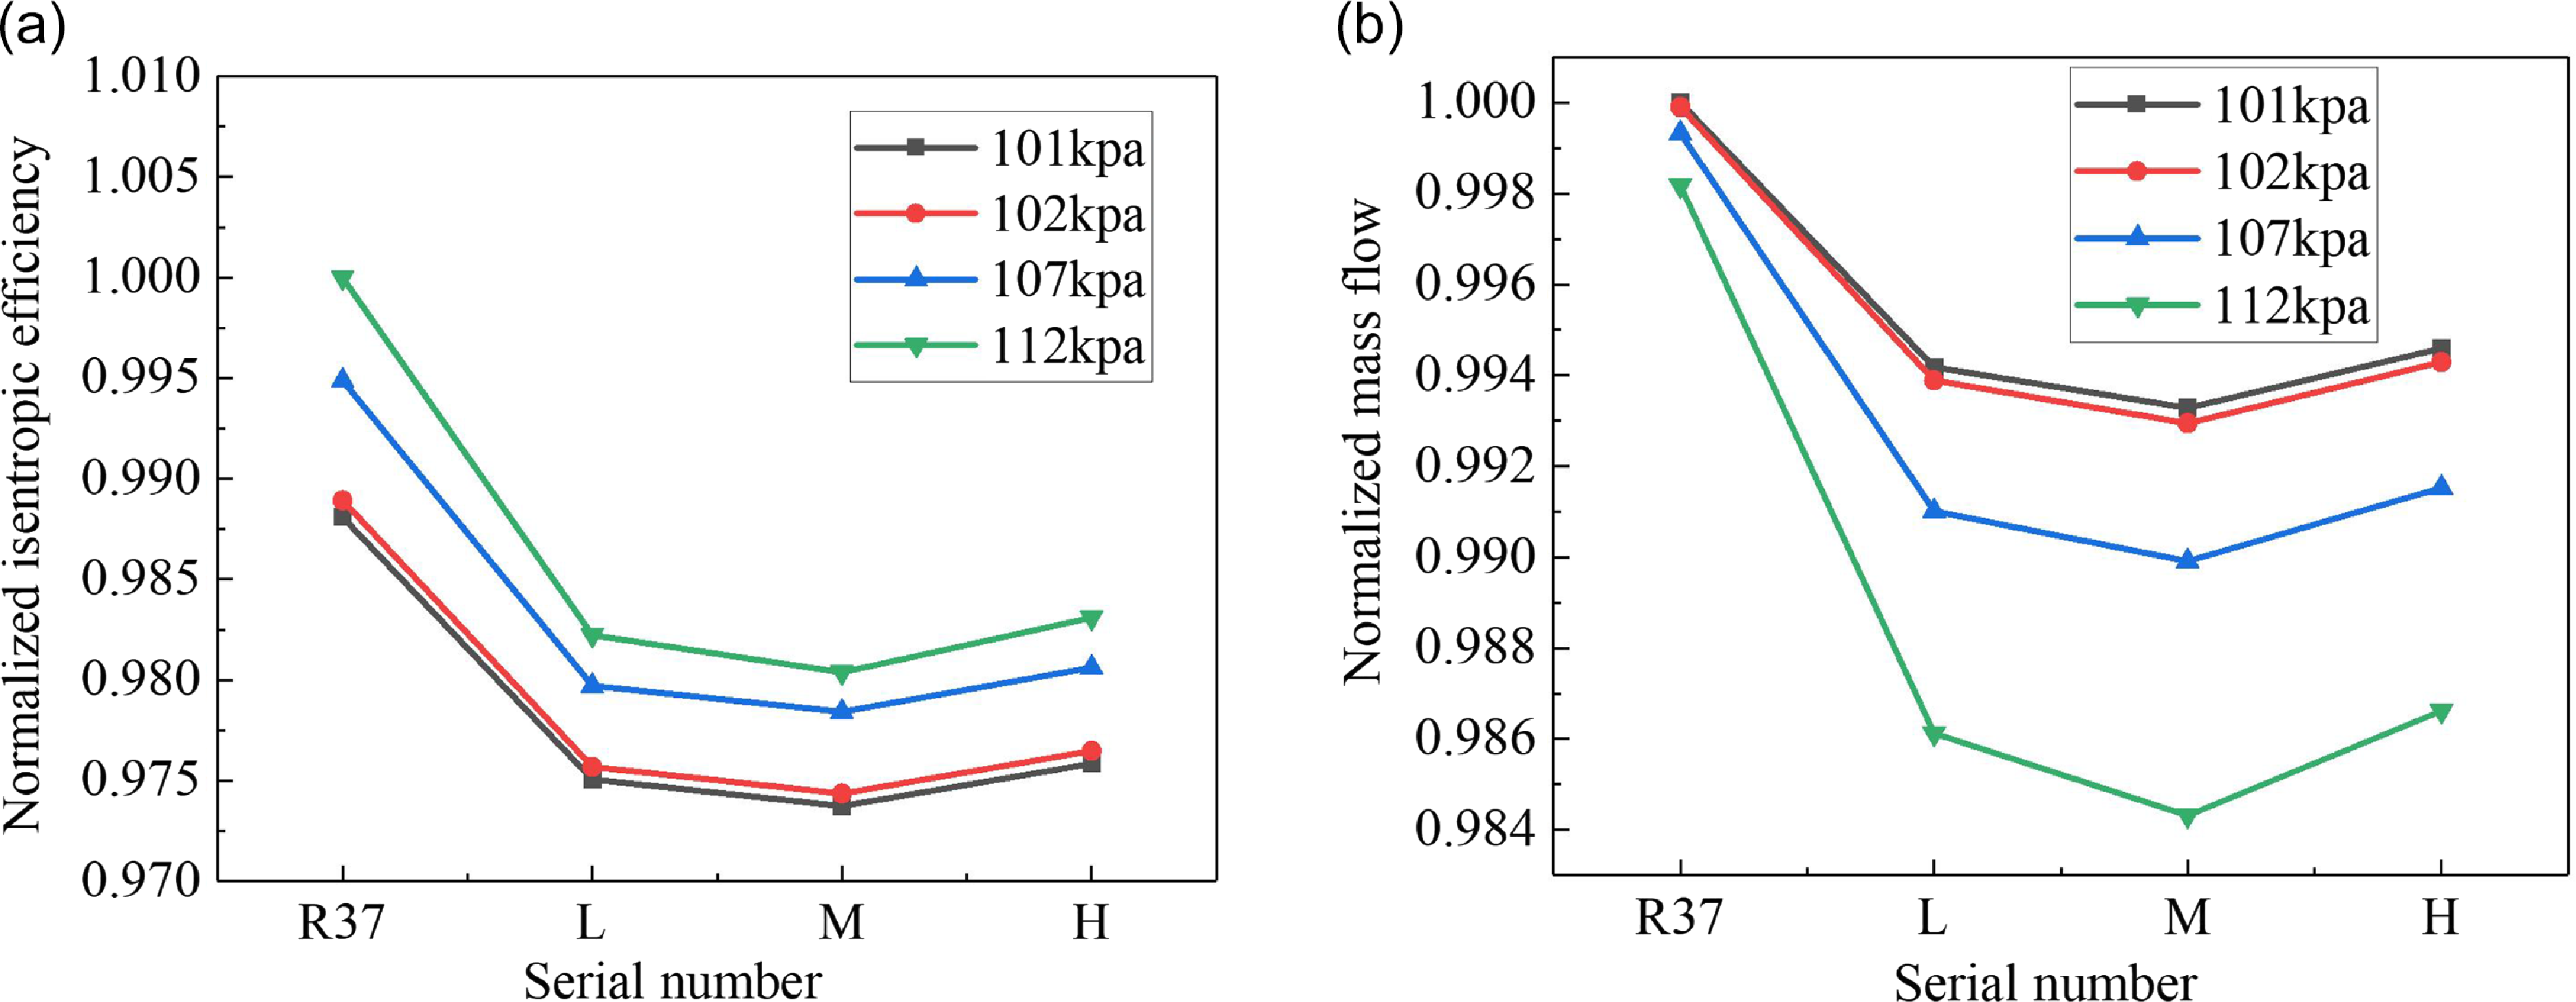
Based on the unscraped conditions of the Rotor 37, the normalised efficiency ‘1’ corresponds to the isentropic efficiency at 112 kPa under unscraped conditions, while the normalised exit flow rate ‘1’ corresponds to the exit flow rate at 101 kPa under unscraped conditions. For operating conditions with the same coating hardness but different maximum scratching depths, the arithmetic means of efficiency and exit flow rate were calculated separately. These values were then scaled proportionally to obtain the normalised results, as shown in Fig. 8. The results demonstrate that medium-hardness coating wear induces more severe compressor performance degradation, while high-hardness coating wear exhibits milder impacts, with low-hardness coating wear effects lying between them. Taking the outlet back pressure of 112 kPa as an example, compared with unscraped rotor efficiency: medium-hardness coating wear reduces rotor efficiency by approximately 1.96% and outlet mass flow by 1.39%; low-hardness coating wear decreases rotor efficiency by about 1.78% and outlet mass flow by 1.21%; high-hardness coating wear results in rotor efficiency reduction of 1.69% and outlet mass flow decrease of 1.16%.
Normalised performance curves. (a) Efficiency and (b) mass flow rate.

3.2 Influence of scraping depth and morphology on rotor performance
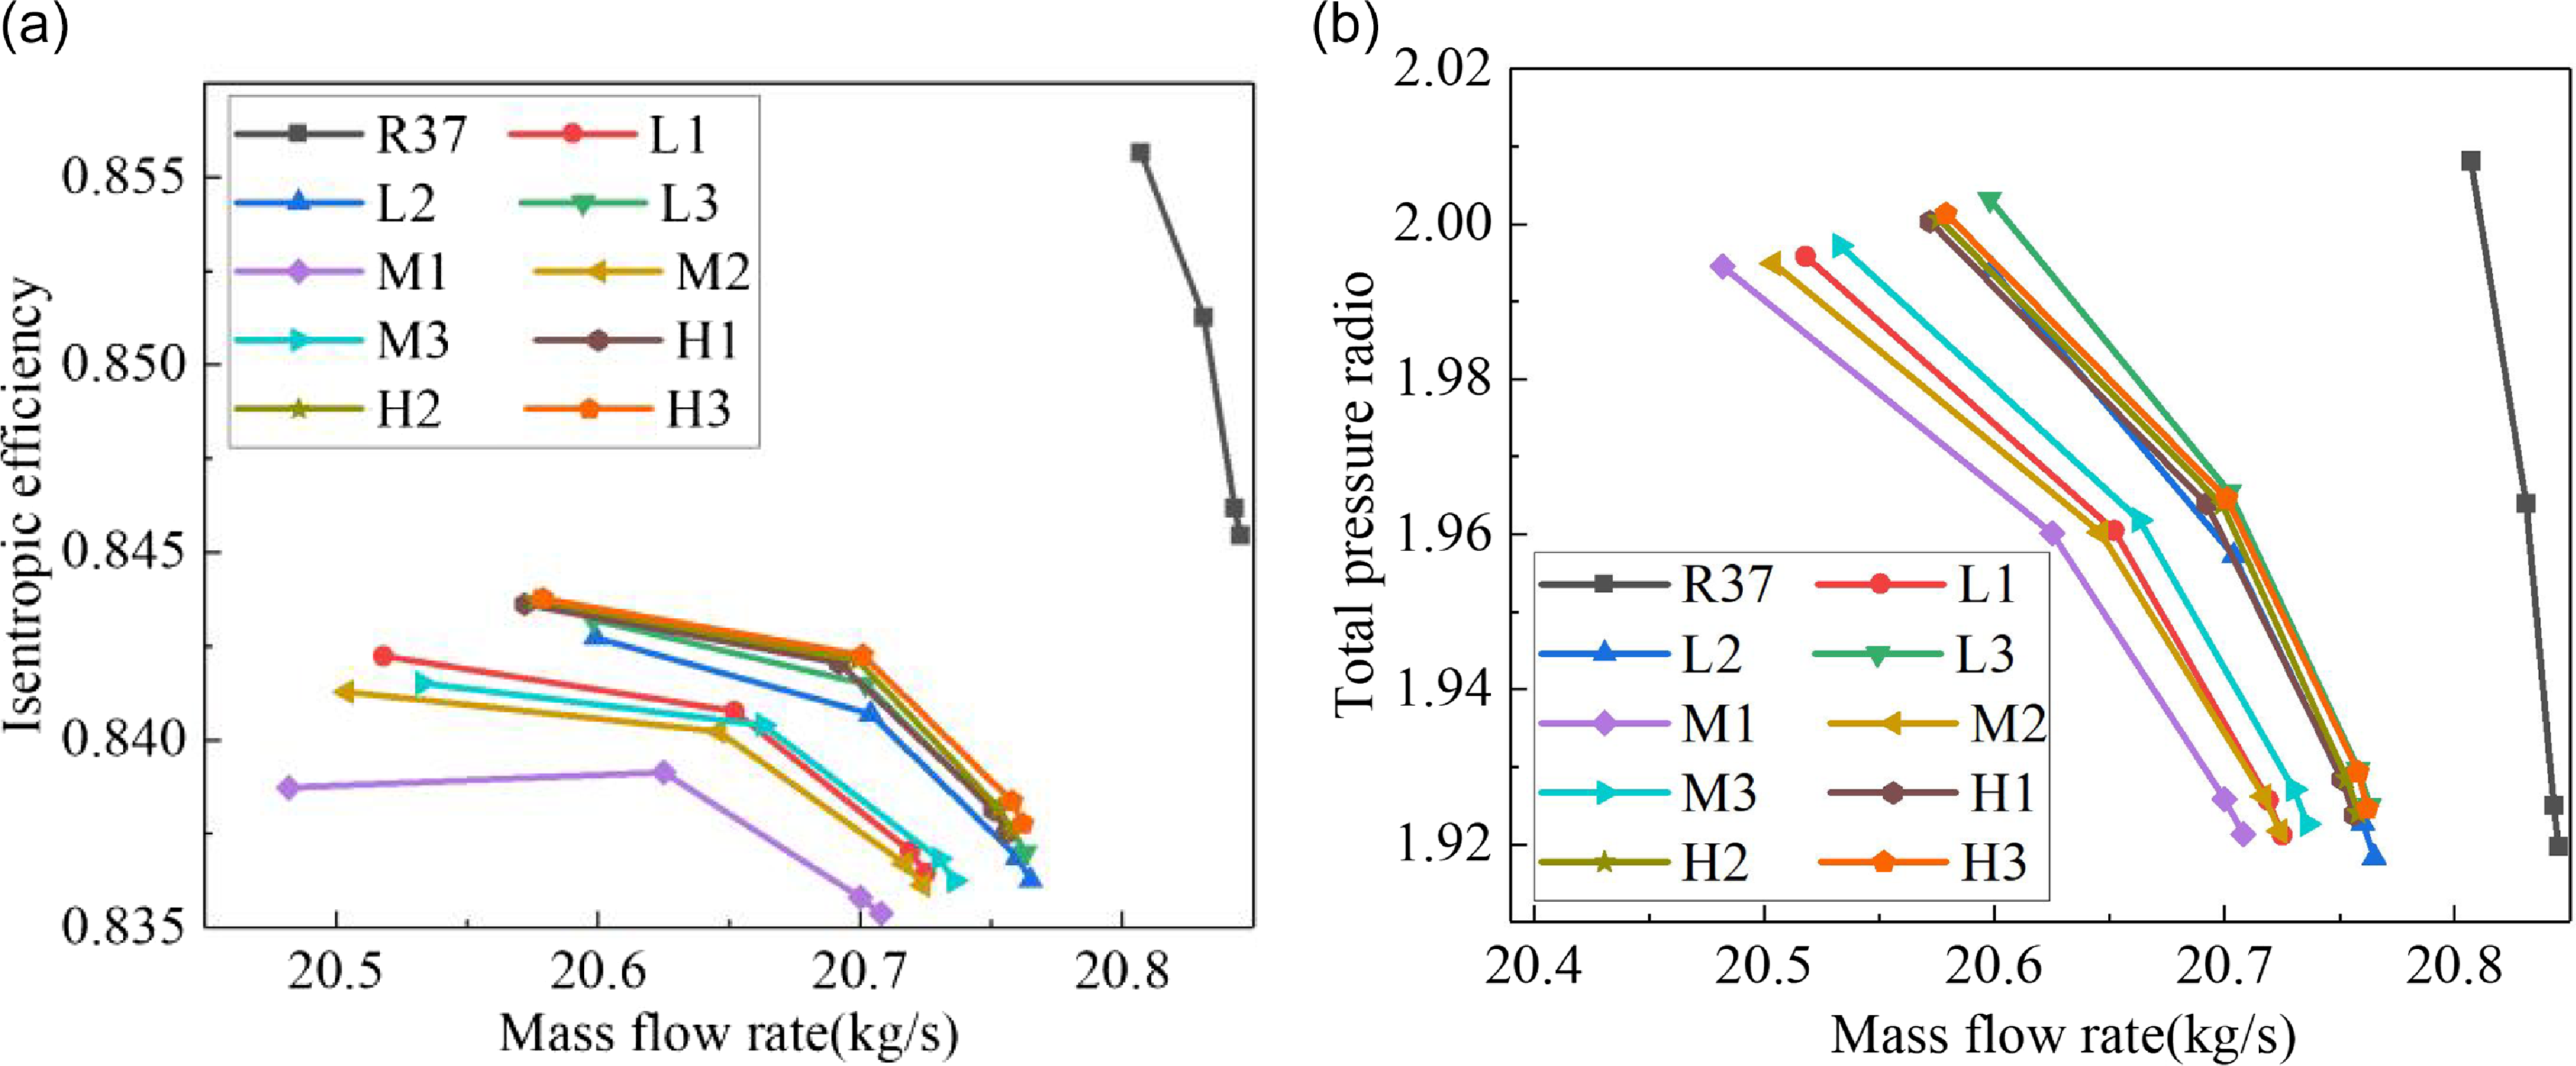
When coatings of different hardness undergo wear, the scraping depth, deepest scraping position and surface roughness are simultaneously altered. To isolate the effects of scraping depth and deepest scraping position on rotor performance, surface roughness in wear zones was set to zero across all scraping conditions. The resulting mass flow-efficiency and mass flow-pressure ratio characteristic curves are shown in Fig. 9.
Performance curves at 0 roughness. (a) Mass flow-efficiency and (b) mass flow-pressure radio.

As observed in Fig. 9, compared to unscraped conditions, the mass flow-efficiency and mass flow-pressure ratio characteristic curves of scraped coatings shift leftward and downward overall. Medium-hardness coatings exhibit the lowest outlet mass flow, efficiency and pressure ratio. At a pressure ratio of 112 kPa, compared to the unscraped rotor: H1 (high-hardness) shows a 1.13% reduction in outlet mass flow, 1.41% decrease in efficiency and 0.39% drop in pressure ratio; L1 (low-hardness) demonstrates a 1.39% reduction in outlet mass flow, 1.57% decrease in efficiency and 0.61% drop in pressure ratio; M1 (medium-hardness) reveals the most severe degradation with 1.56% reduction in outlet mass flow, 1.98% decrease in efficiency and 0.67% drop in pressure ratio.
As the deepest scraping position shifts rearward from the blade leading edge (X1) to mid-chord (X2) and trailing edge (X3) (where X = L, M, H), the mass flow-efficiency and mass flow-pressure ratio characteristic curves shift rightward and upward, indicating slight increases in outlet mass flow, efficiency and pressure ratio, though the magnitude of change remains limited. At a pressure ratio of 112 kPa, compared to the unscraped rotor: L1 (leading-edge scraping) exhibits a 1.39% reduction in outlet mass flow, 1.57% decrease in efficiency and 0.70% drop in pressure ratio; L2 (mid-chord scraping) shows a 1.00% reduction in outlet mass flow, 1.51% decrease in efficiency and 0.61% drop in pressure ratio; L3 (trailing-edge scraping) demonstrates a 0.99% reduction in outlet mass flow, 1.46% decrease in efficiency and 0.24% drop in pressure ratio.
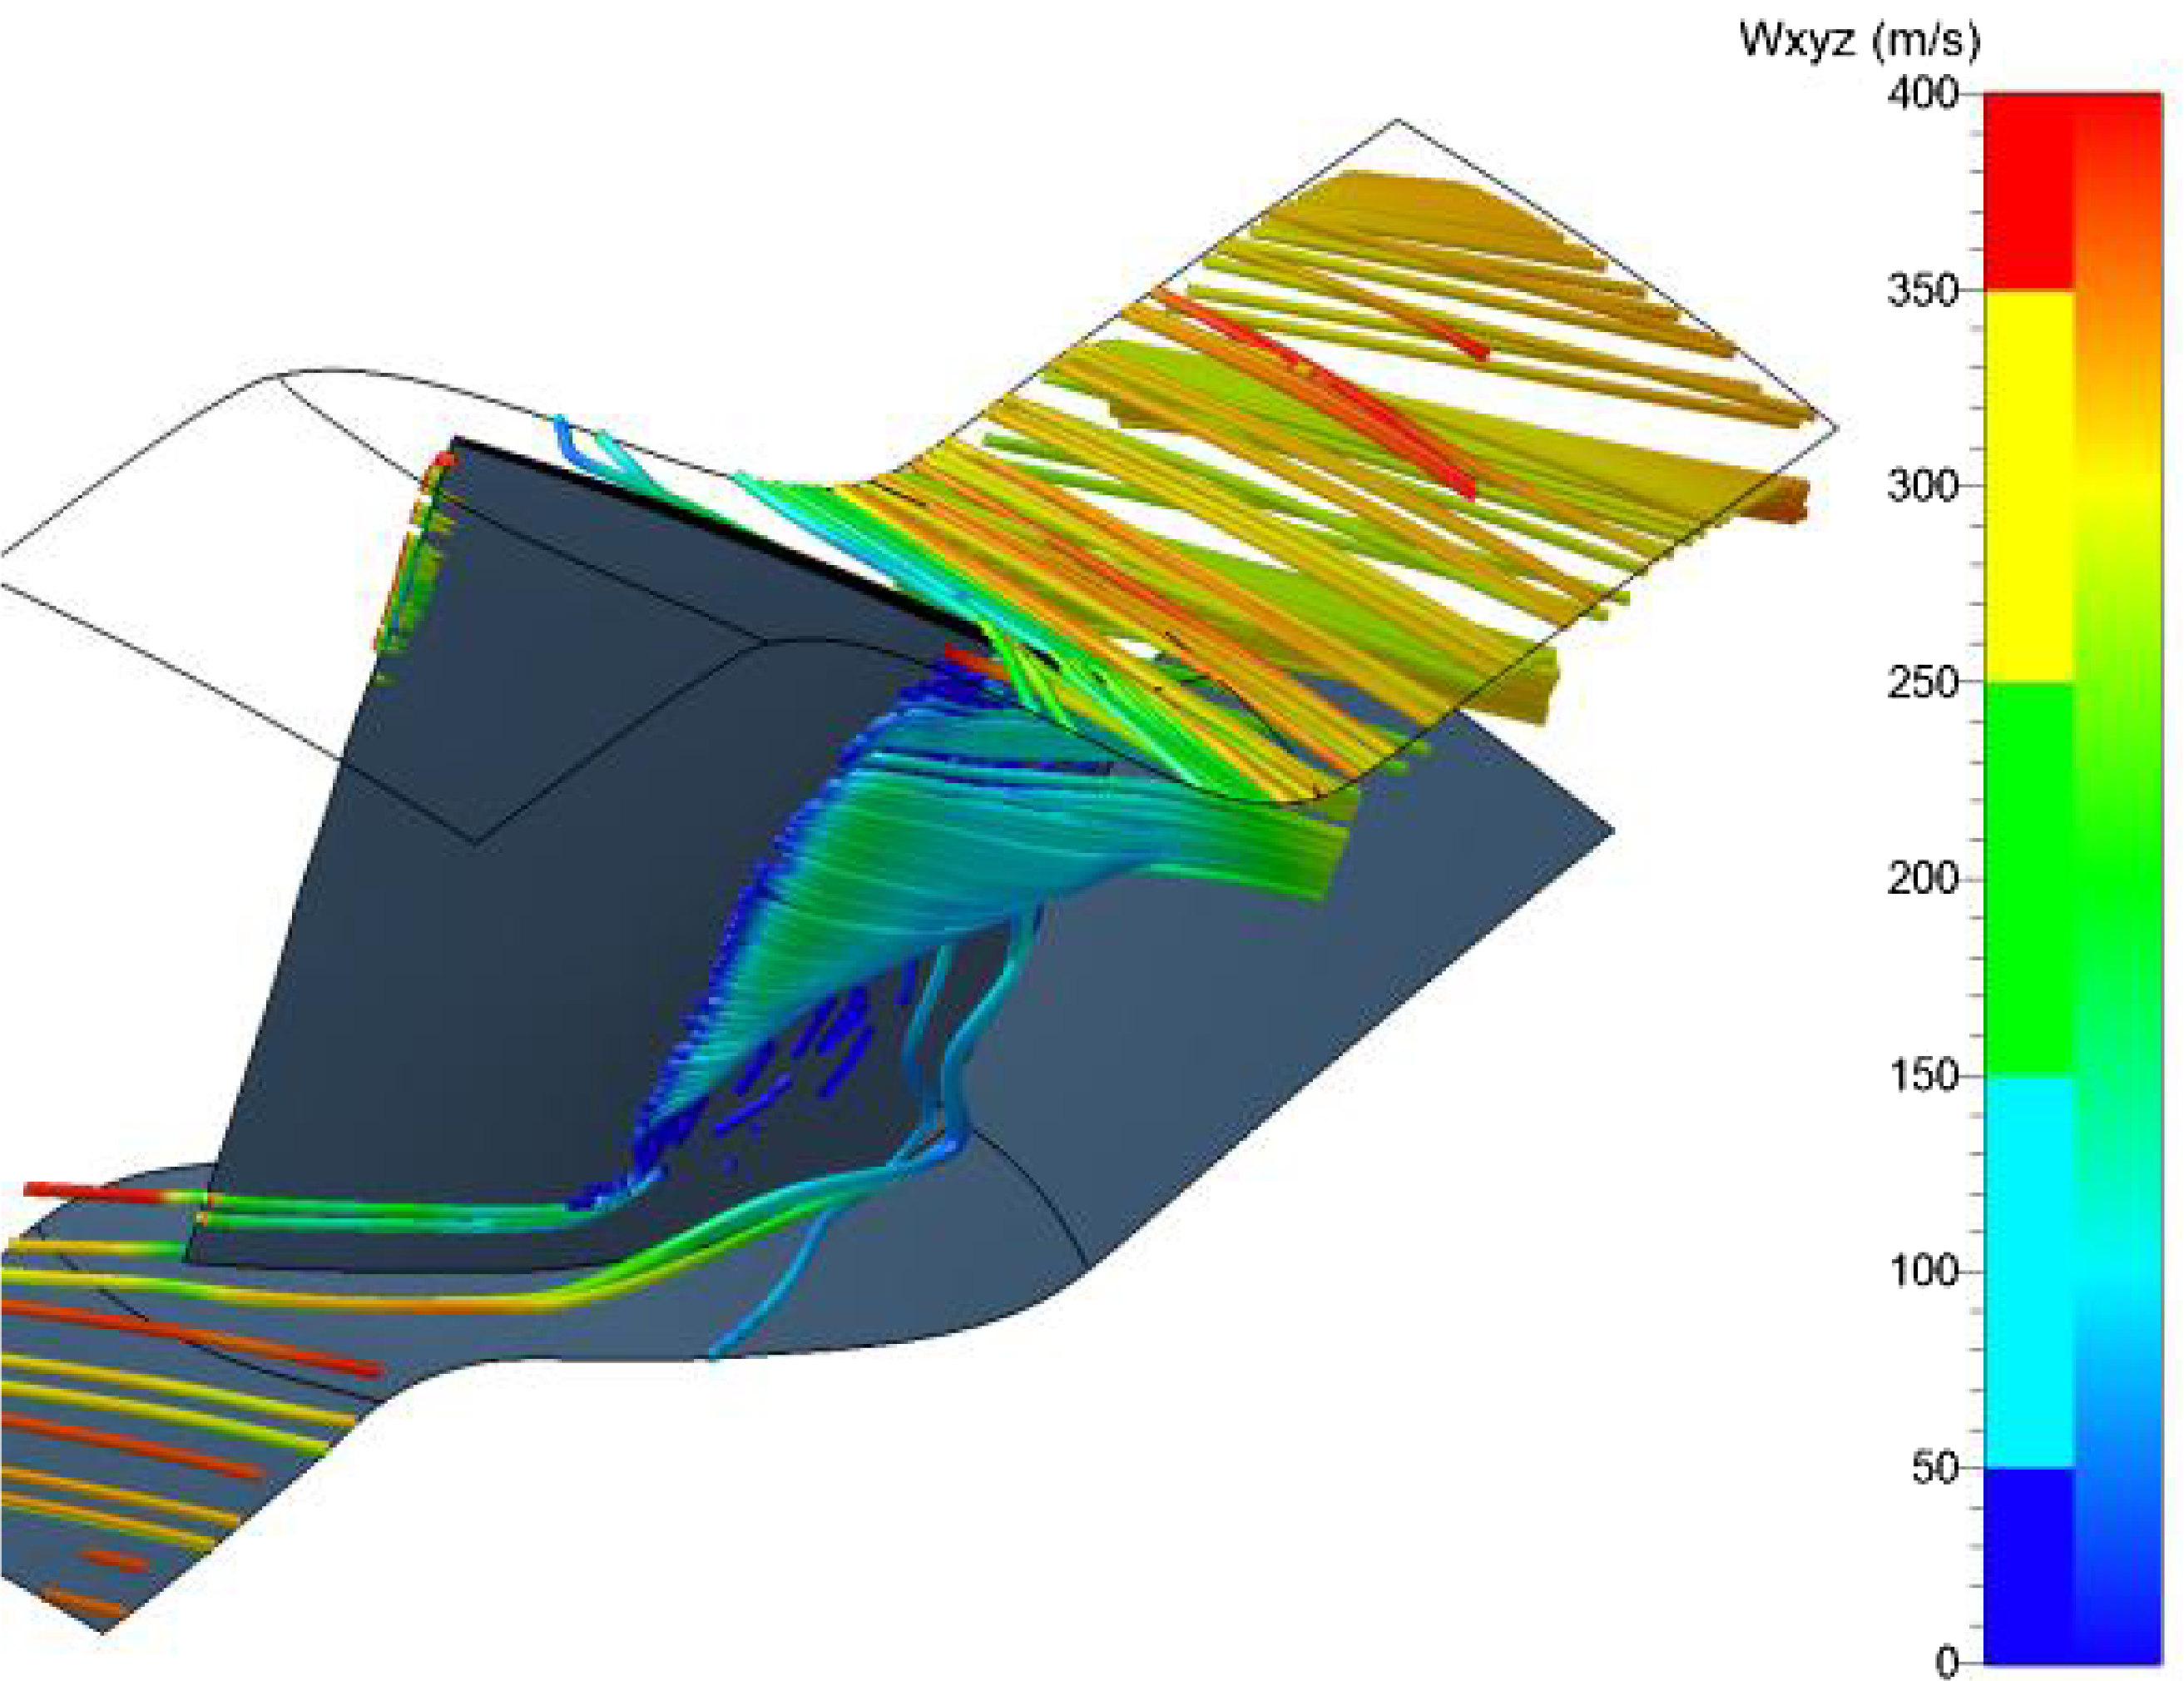
Figure 10 presents a three-dimensional visualisation of tip leakage flow and suction-side separation vortices. The tip leakage flow forms due to pressure differentials between the pressure and suction surfaces of compressor blades, interacting with suction-side separation vortices that migrate radially from the hub to the tip region. This interaction displaces separation vortices toward the main flow path, intensifies flow disorder, increases entropy generation and reduces efficiency.
Three-dimensional diagram of tip leakage flow and suction surface separation flow.

Figure 11 illustrates the variation in rotor tip clearance relative leakage quantity under different scraped conditions, where the relative leakage flow rate is defined as follows:
 \begin{align} \varphi = {\dot m_{leak}}/{\dot m_{in}}\end{align}
where
 $ \varphi$
represents the relative leakage quantity, while
 ${\dot m_{leak}}$
denotes the rotor tip clearance leakage flow rate and
 ${\dot m_{in}}$
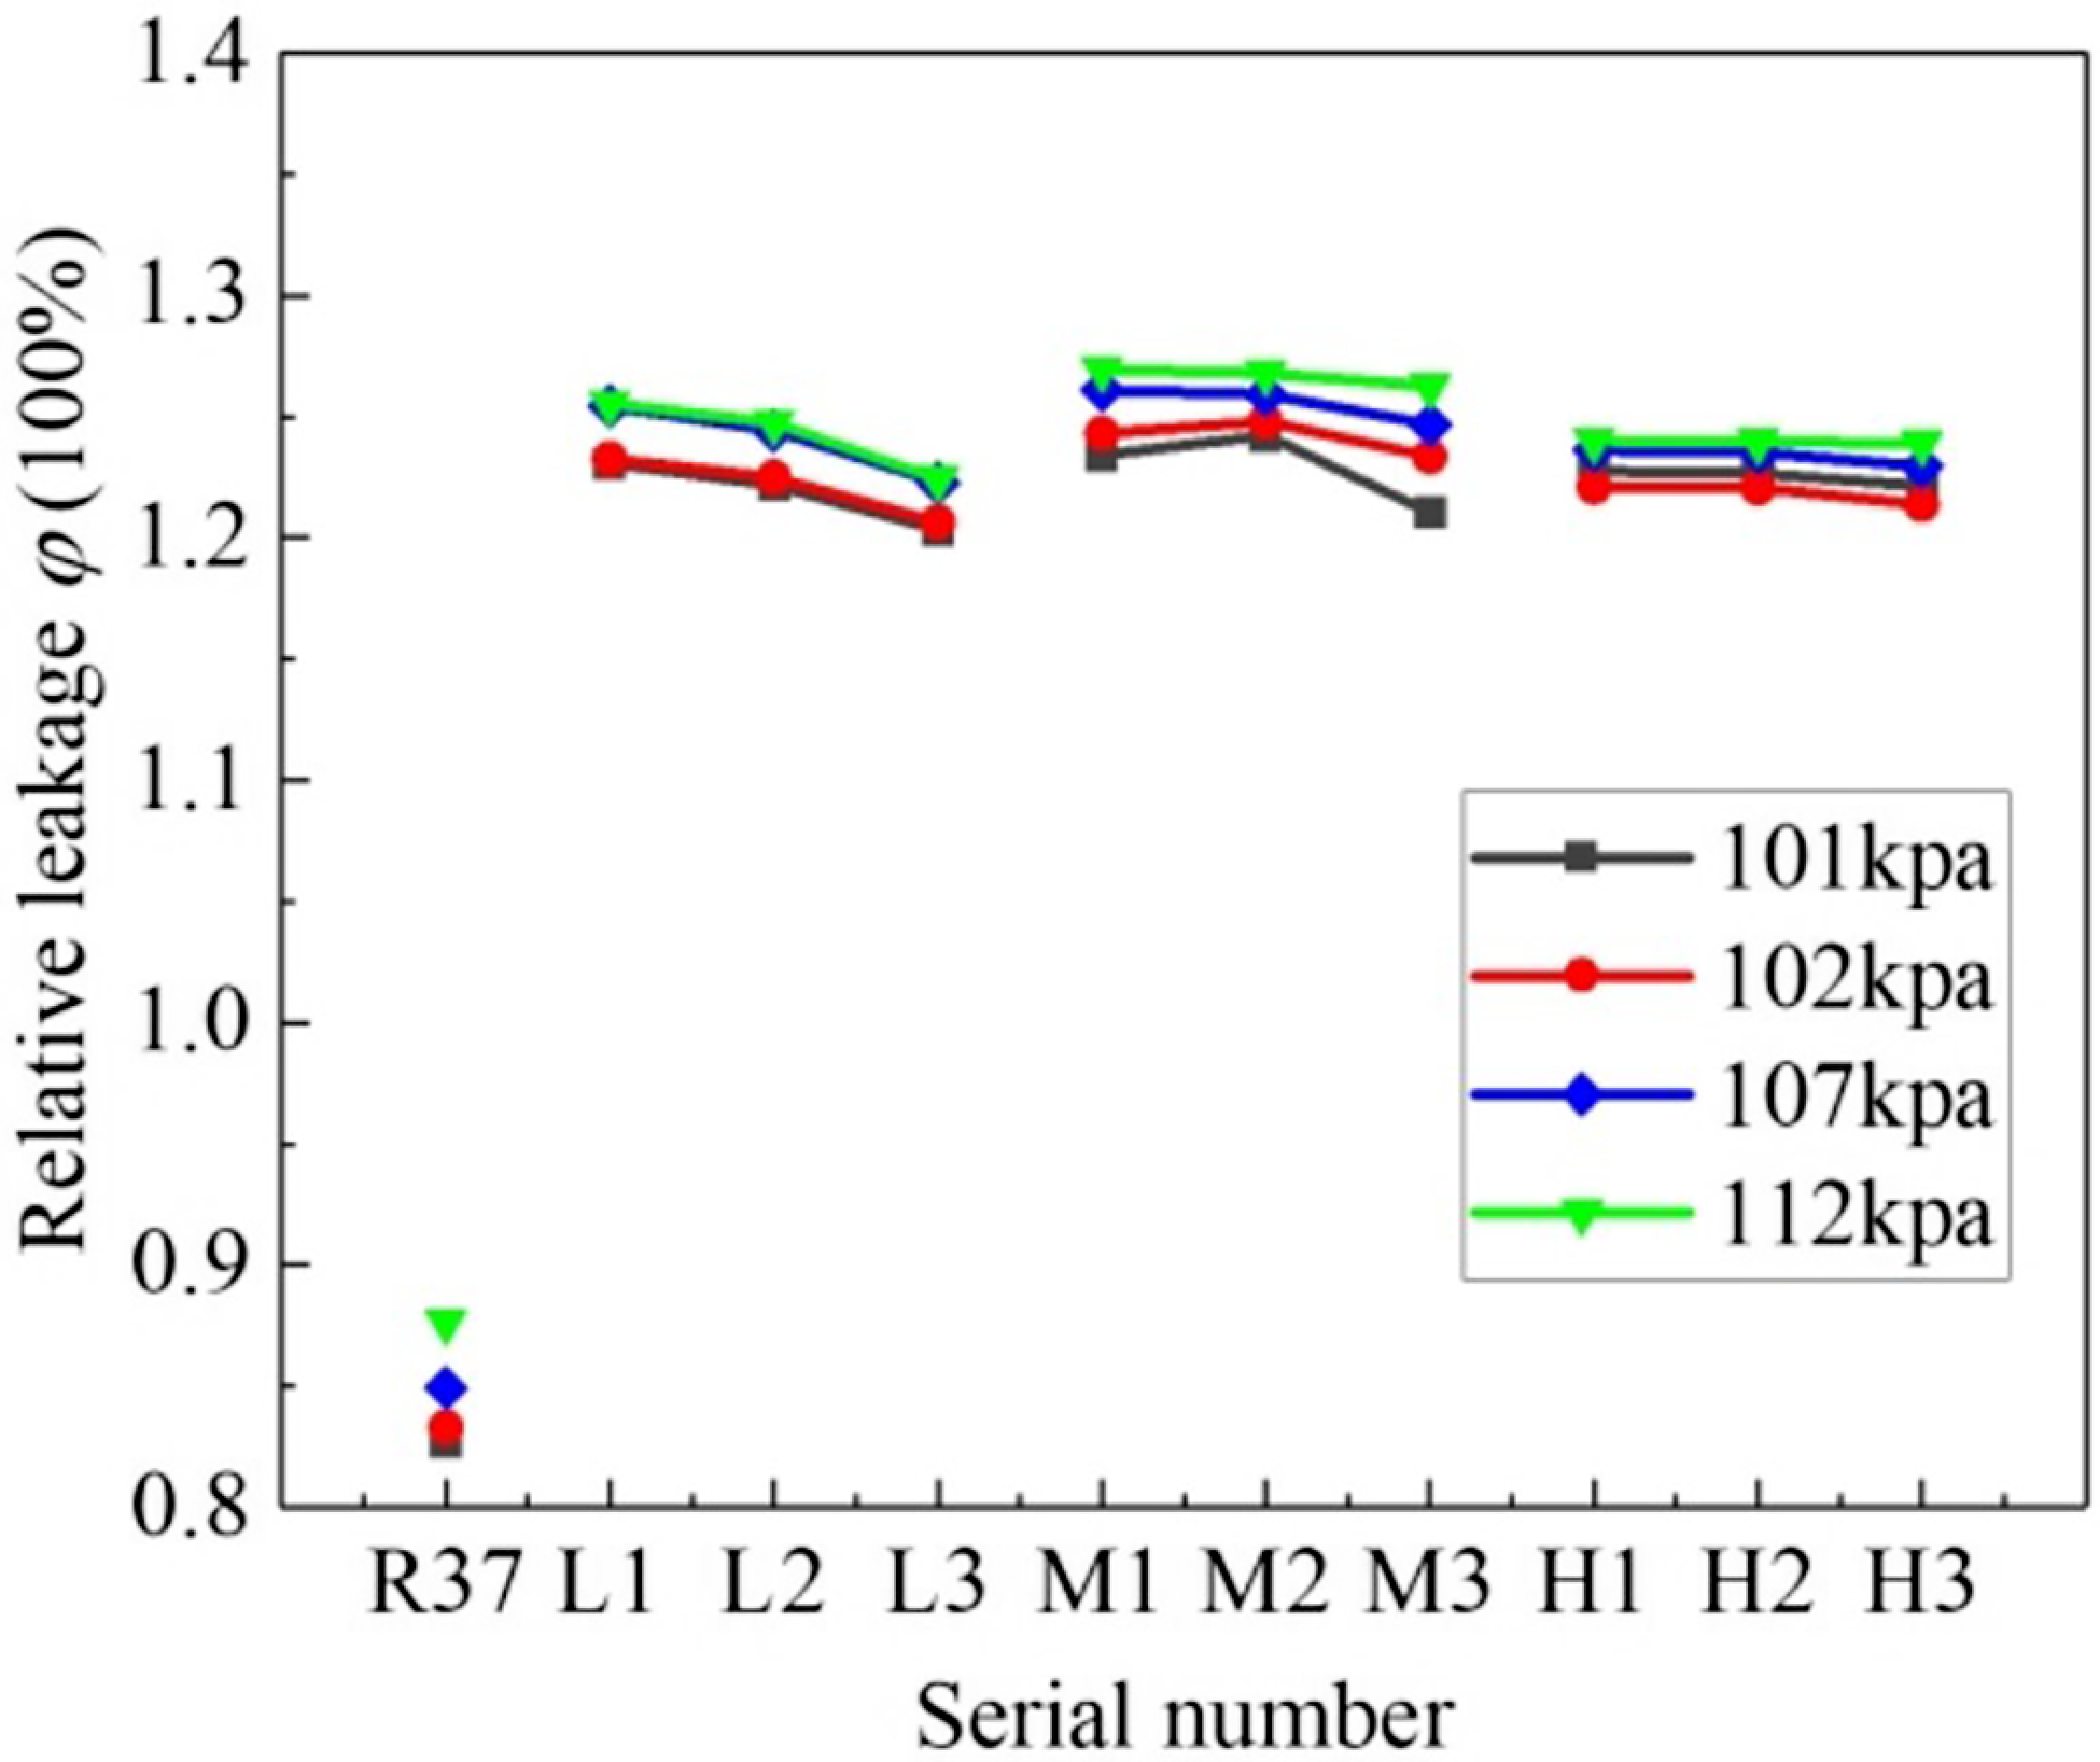
represents the compressor inlet flow rate. As shown in Fig. 11, the rotor tip clearance relative leakage quantity exhibits a significant increase with an enlarged rotor tip clearance due to casing scraping. The maximum relative leakage quantity is observed in the M1 scraped case following coating abrasion, with the L1 case showing intermediate values and the H1 case demonstrating the lowest level. Taking the outlet back pressure of 112 kPa as an example, under un-scraped conditions, the relative leakage quantity is 0.88%. Under L1 scraping conditions, the value is 1.26%, and under M1 scraping conditions, it is 1.27%, and under H1 scraping conditions, it is 1.24%.
Relative leakage quantity at rotor tip clearance under different scraped conditions.

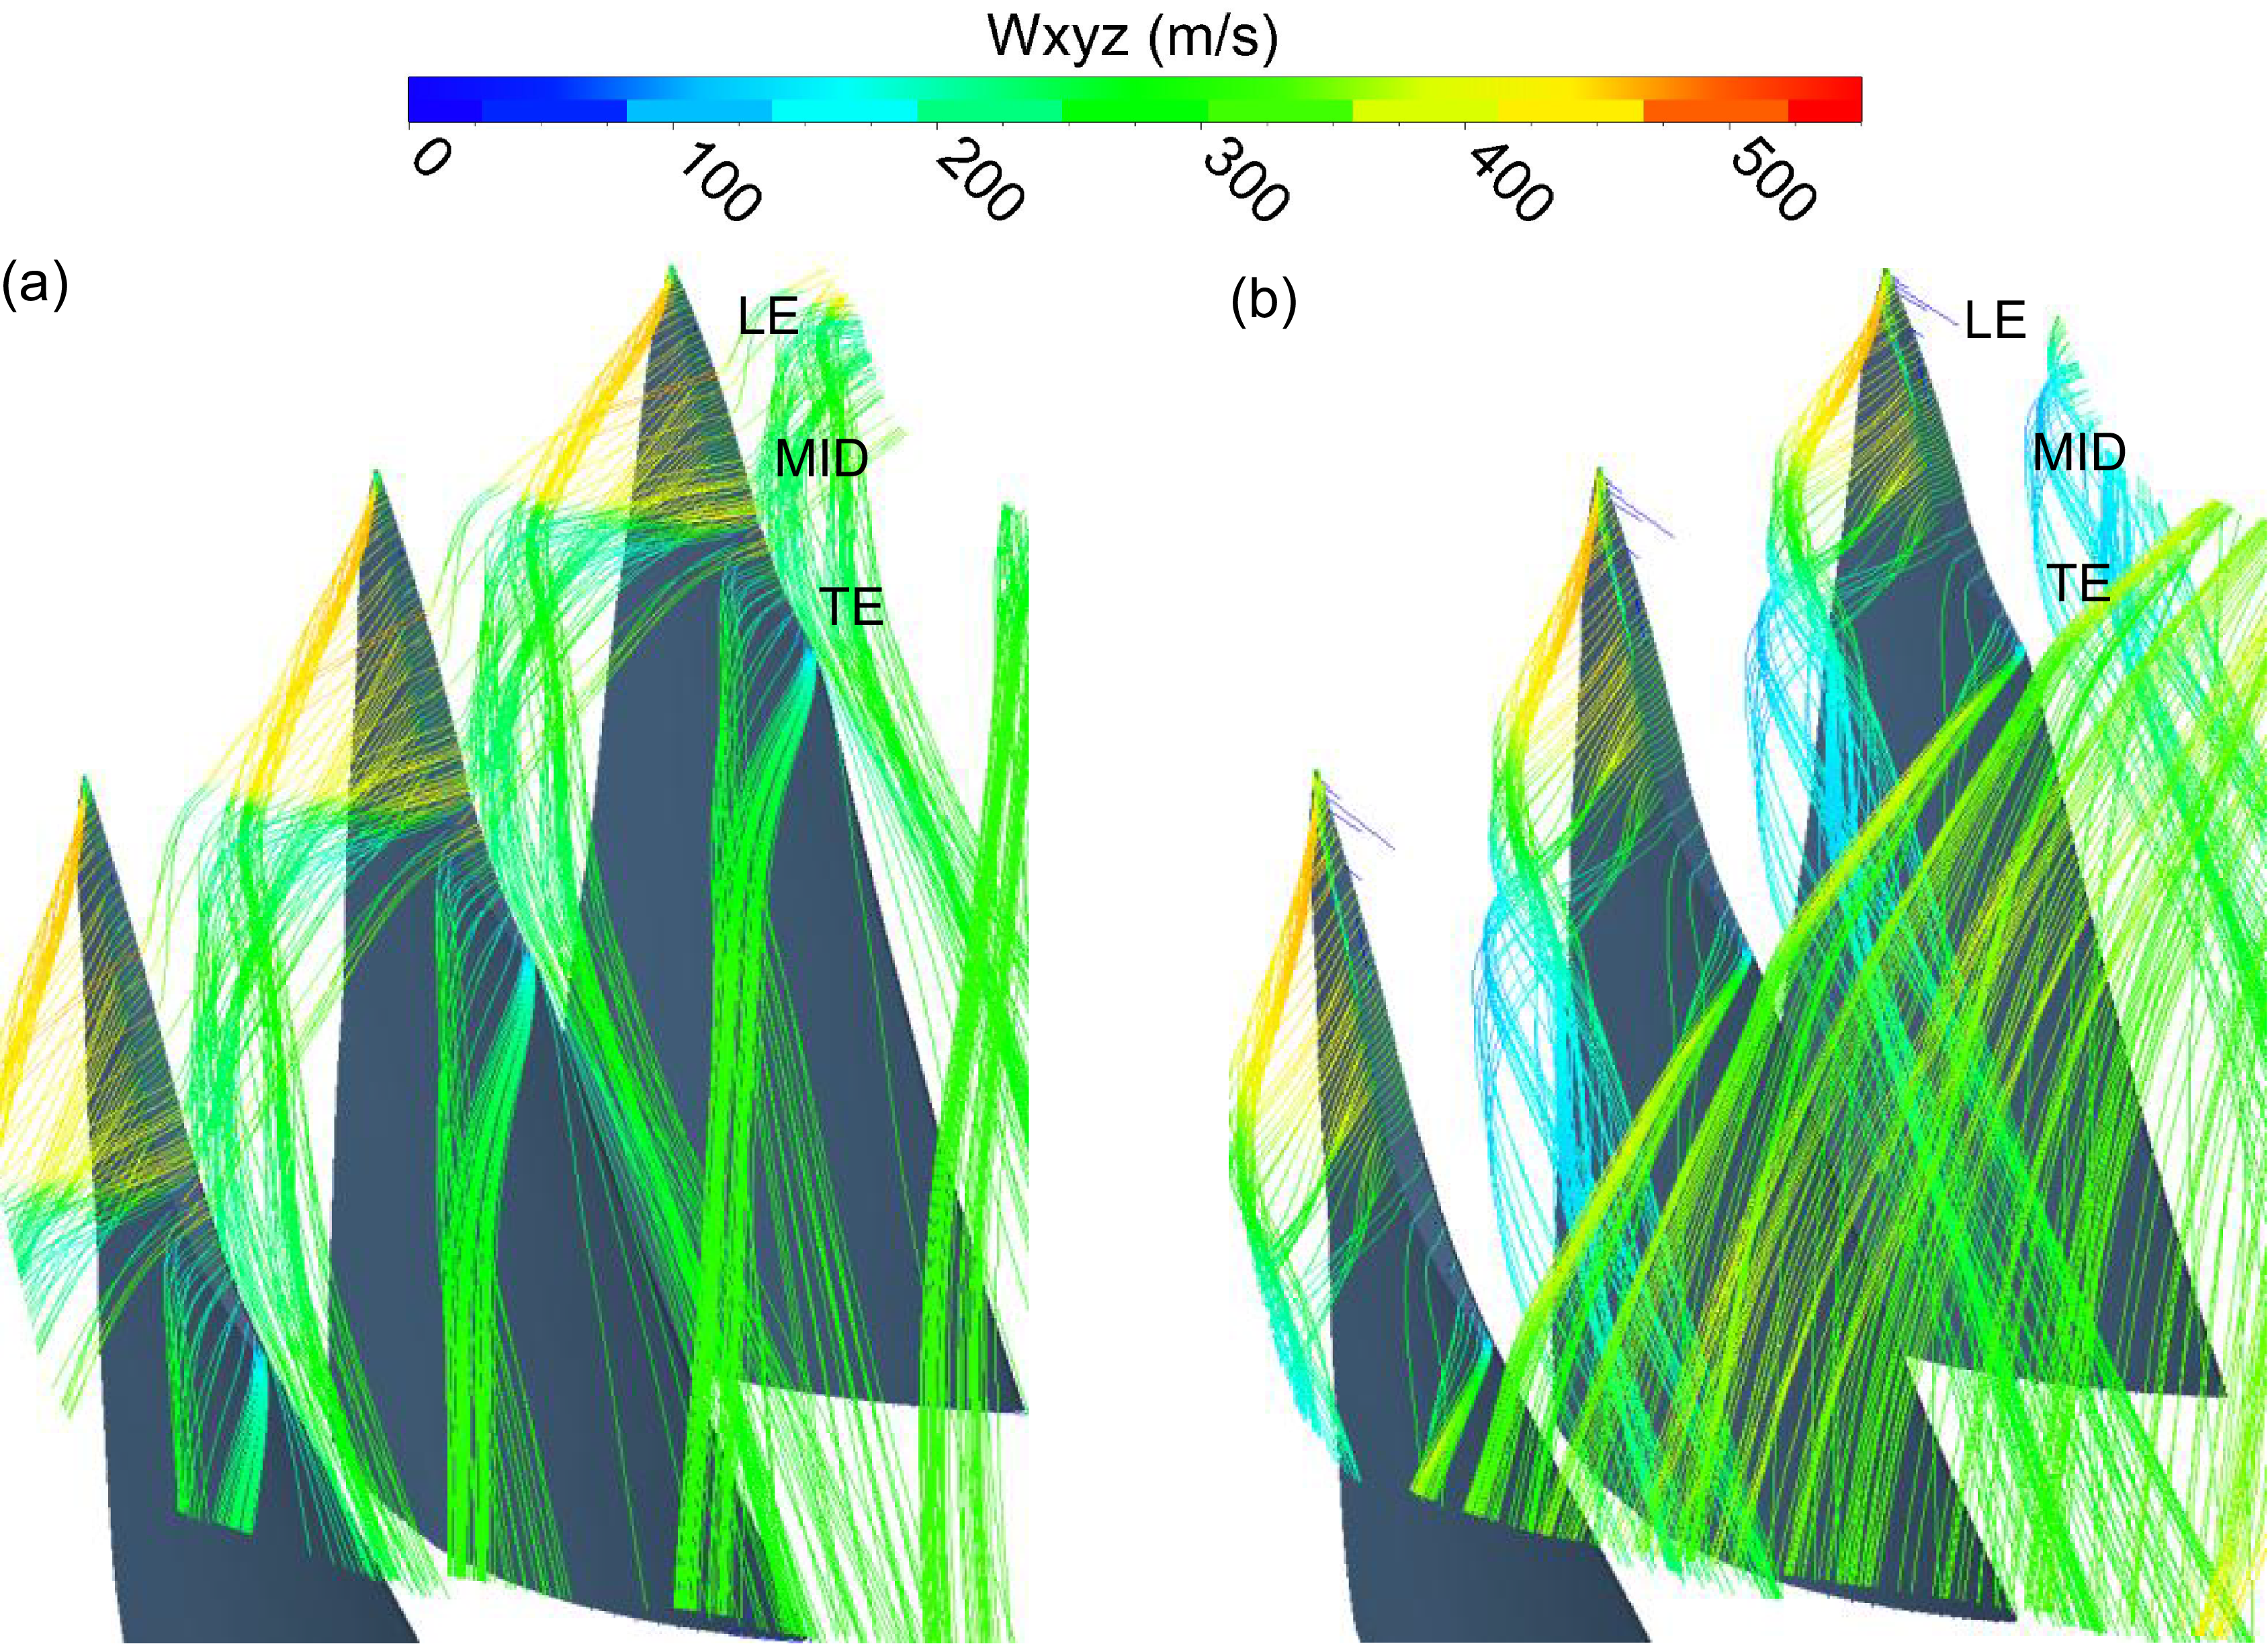
Figure 12 compares tip clearance leakage streamlines under unscraped and L1-scraped conditions at 112 kPa. Streamlines near the leading edge (LE), mid-chord (MID) and trailing edge (TE) are labeled accordingly. The observations showed that under unscraped conditions, LE leakage flow is biased in the axial direction, entraining MID leakage flow at high velocity to form leakage vortices, which subsequently mix with TE leakage flow near the second adjacent blade. MID and TE leakage flows exhibit stronger circumferential components, with partial MID leakage bypassing adjacent blades to generate secondary leakage. Under L1-scraped conditions, enhanced interaction between LE and MID leakage streams results in intensified vortices through mutual entanglement. These vortices exit near the pressure side of adjacent blades, further mixing with mainstream flow and propagating performance degradation throughout the entire machine.
Blade tip leakage flow distribution in the scraping gap. (a) No scraping and (b) scraping gap of L1.

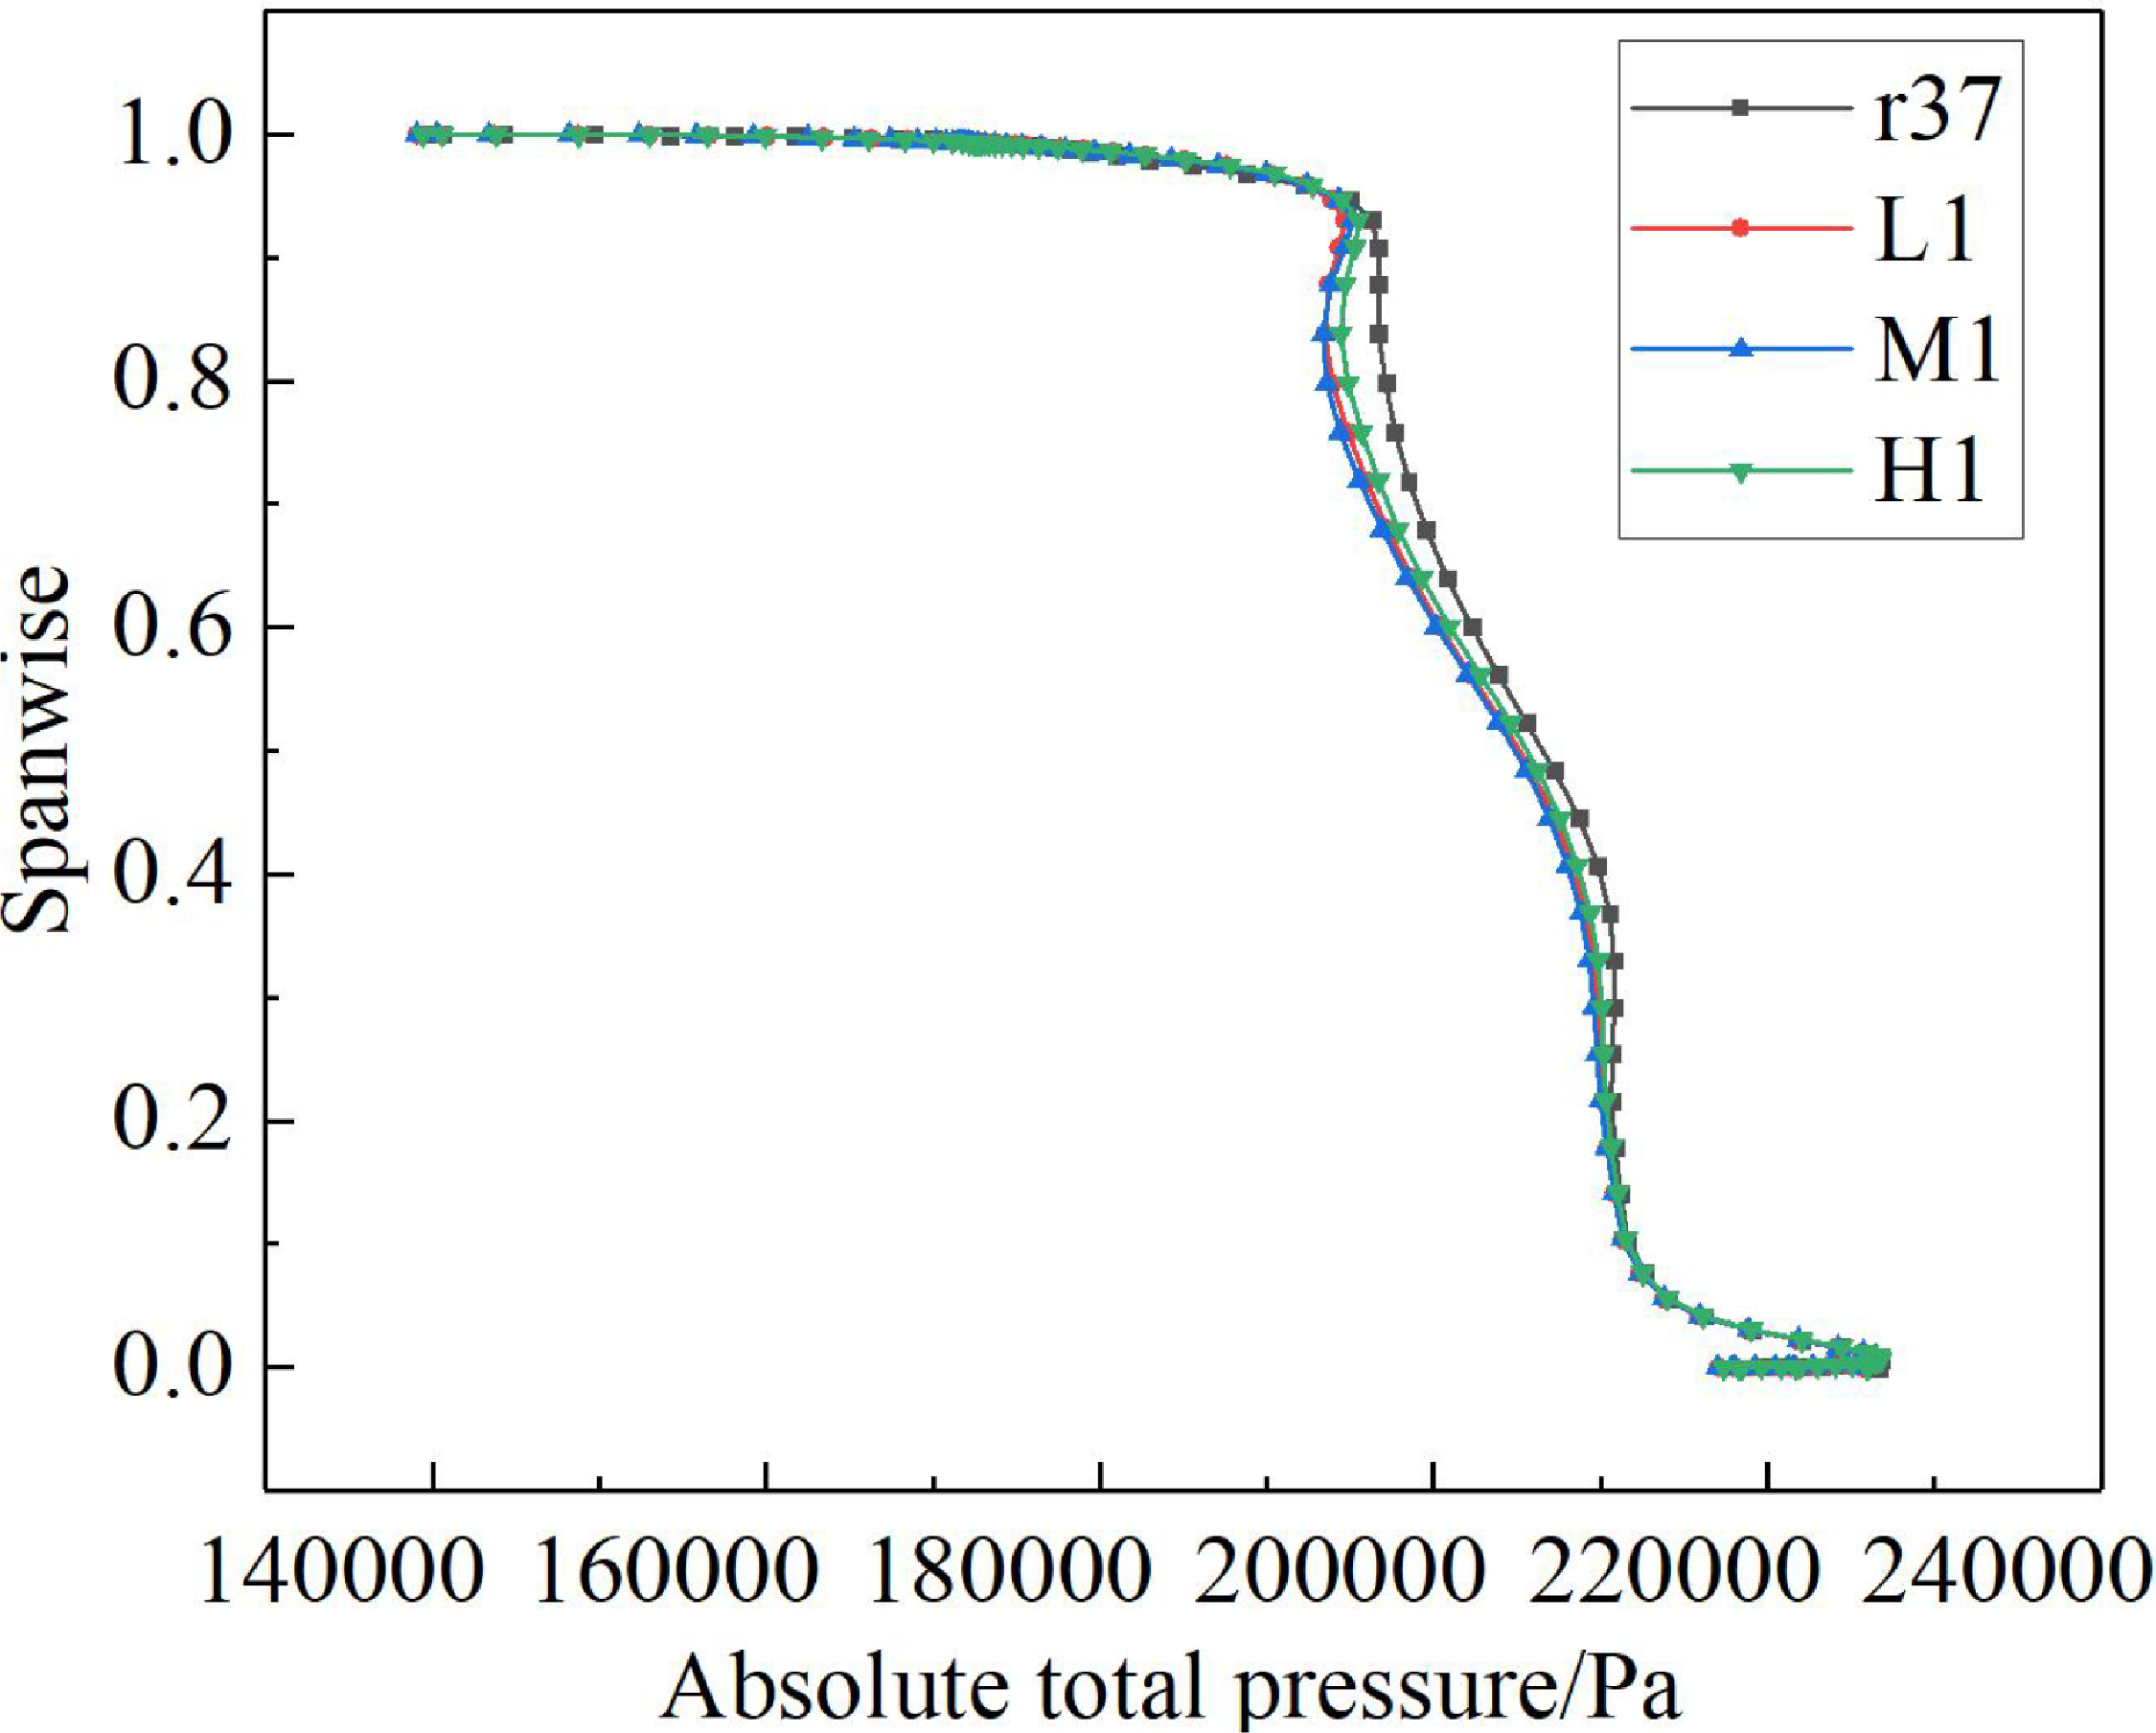
Figure 13 presents the radial distributions of rotor exit total pressure under different scraping morphologies at 112 kPa backpressure. The presence of scraping clearance reduces total pressure in the upper region of the rotor exit, with the peak total pressure loss occurring at approximately 85% blade height. The affected spanwise region extends above 60% blade height, corresponding to the primary action zone of tip leakage flow, while minimal variations in total pressure are observed in the mid-span and near-hub regions.
Distribution of rotor’s outlet total pressure along span at different scraping depths.

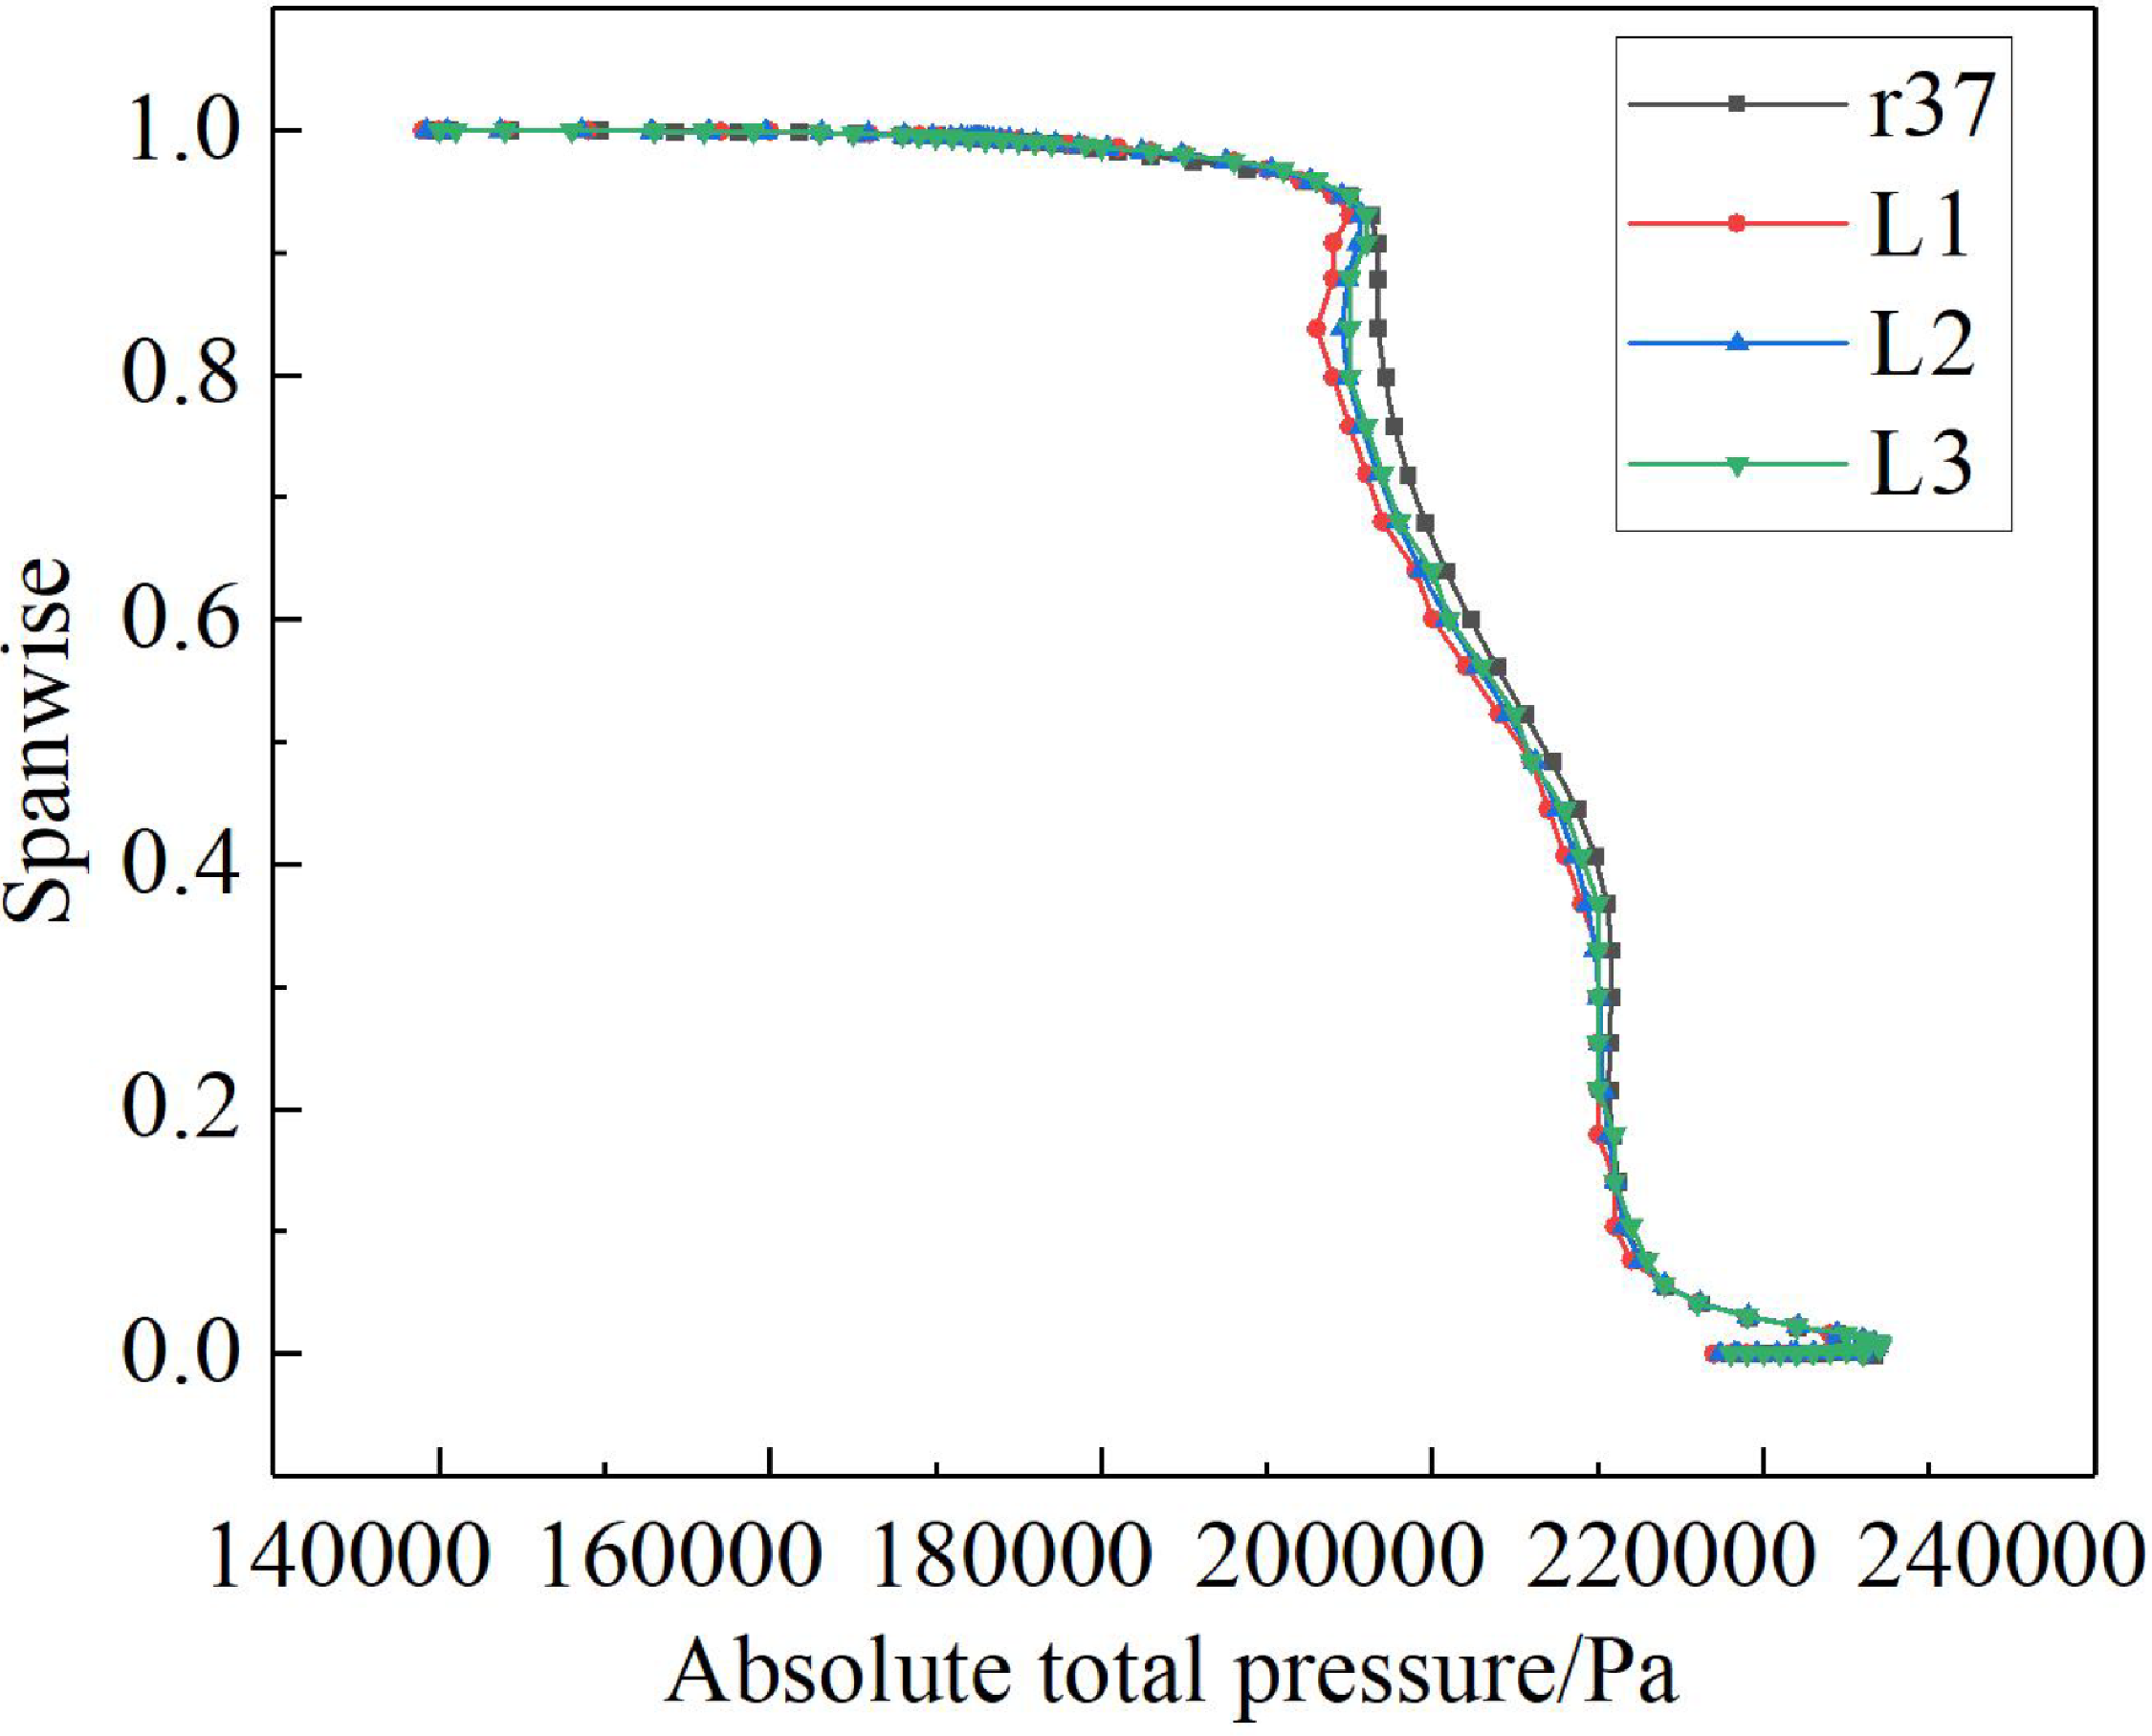
Figure 14 illustrates the radial total pressure profiles at 112 kPa backpressure for low-hardness coatings with varying deepest scraping positions. With the forward shift of the deepest scraping position, total pressure in the upper rotor exit region progressively decreases, whereas mid-span and near-hub regions exhibit minimal variations.
Distribution of rotor’s outlet total pressure along span at different deepest positions.

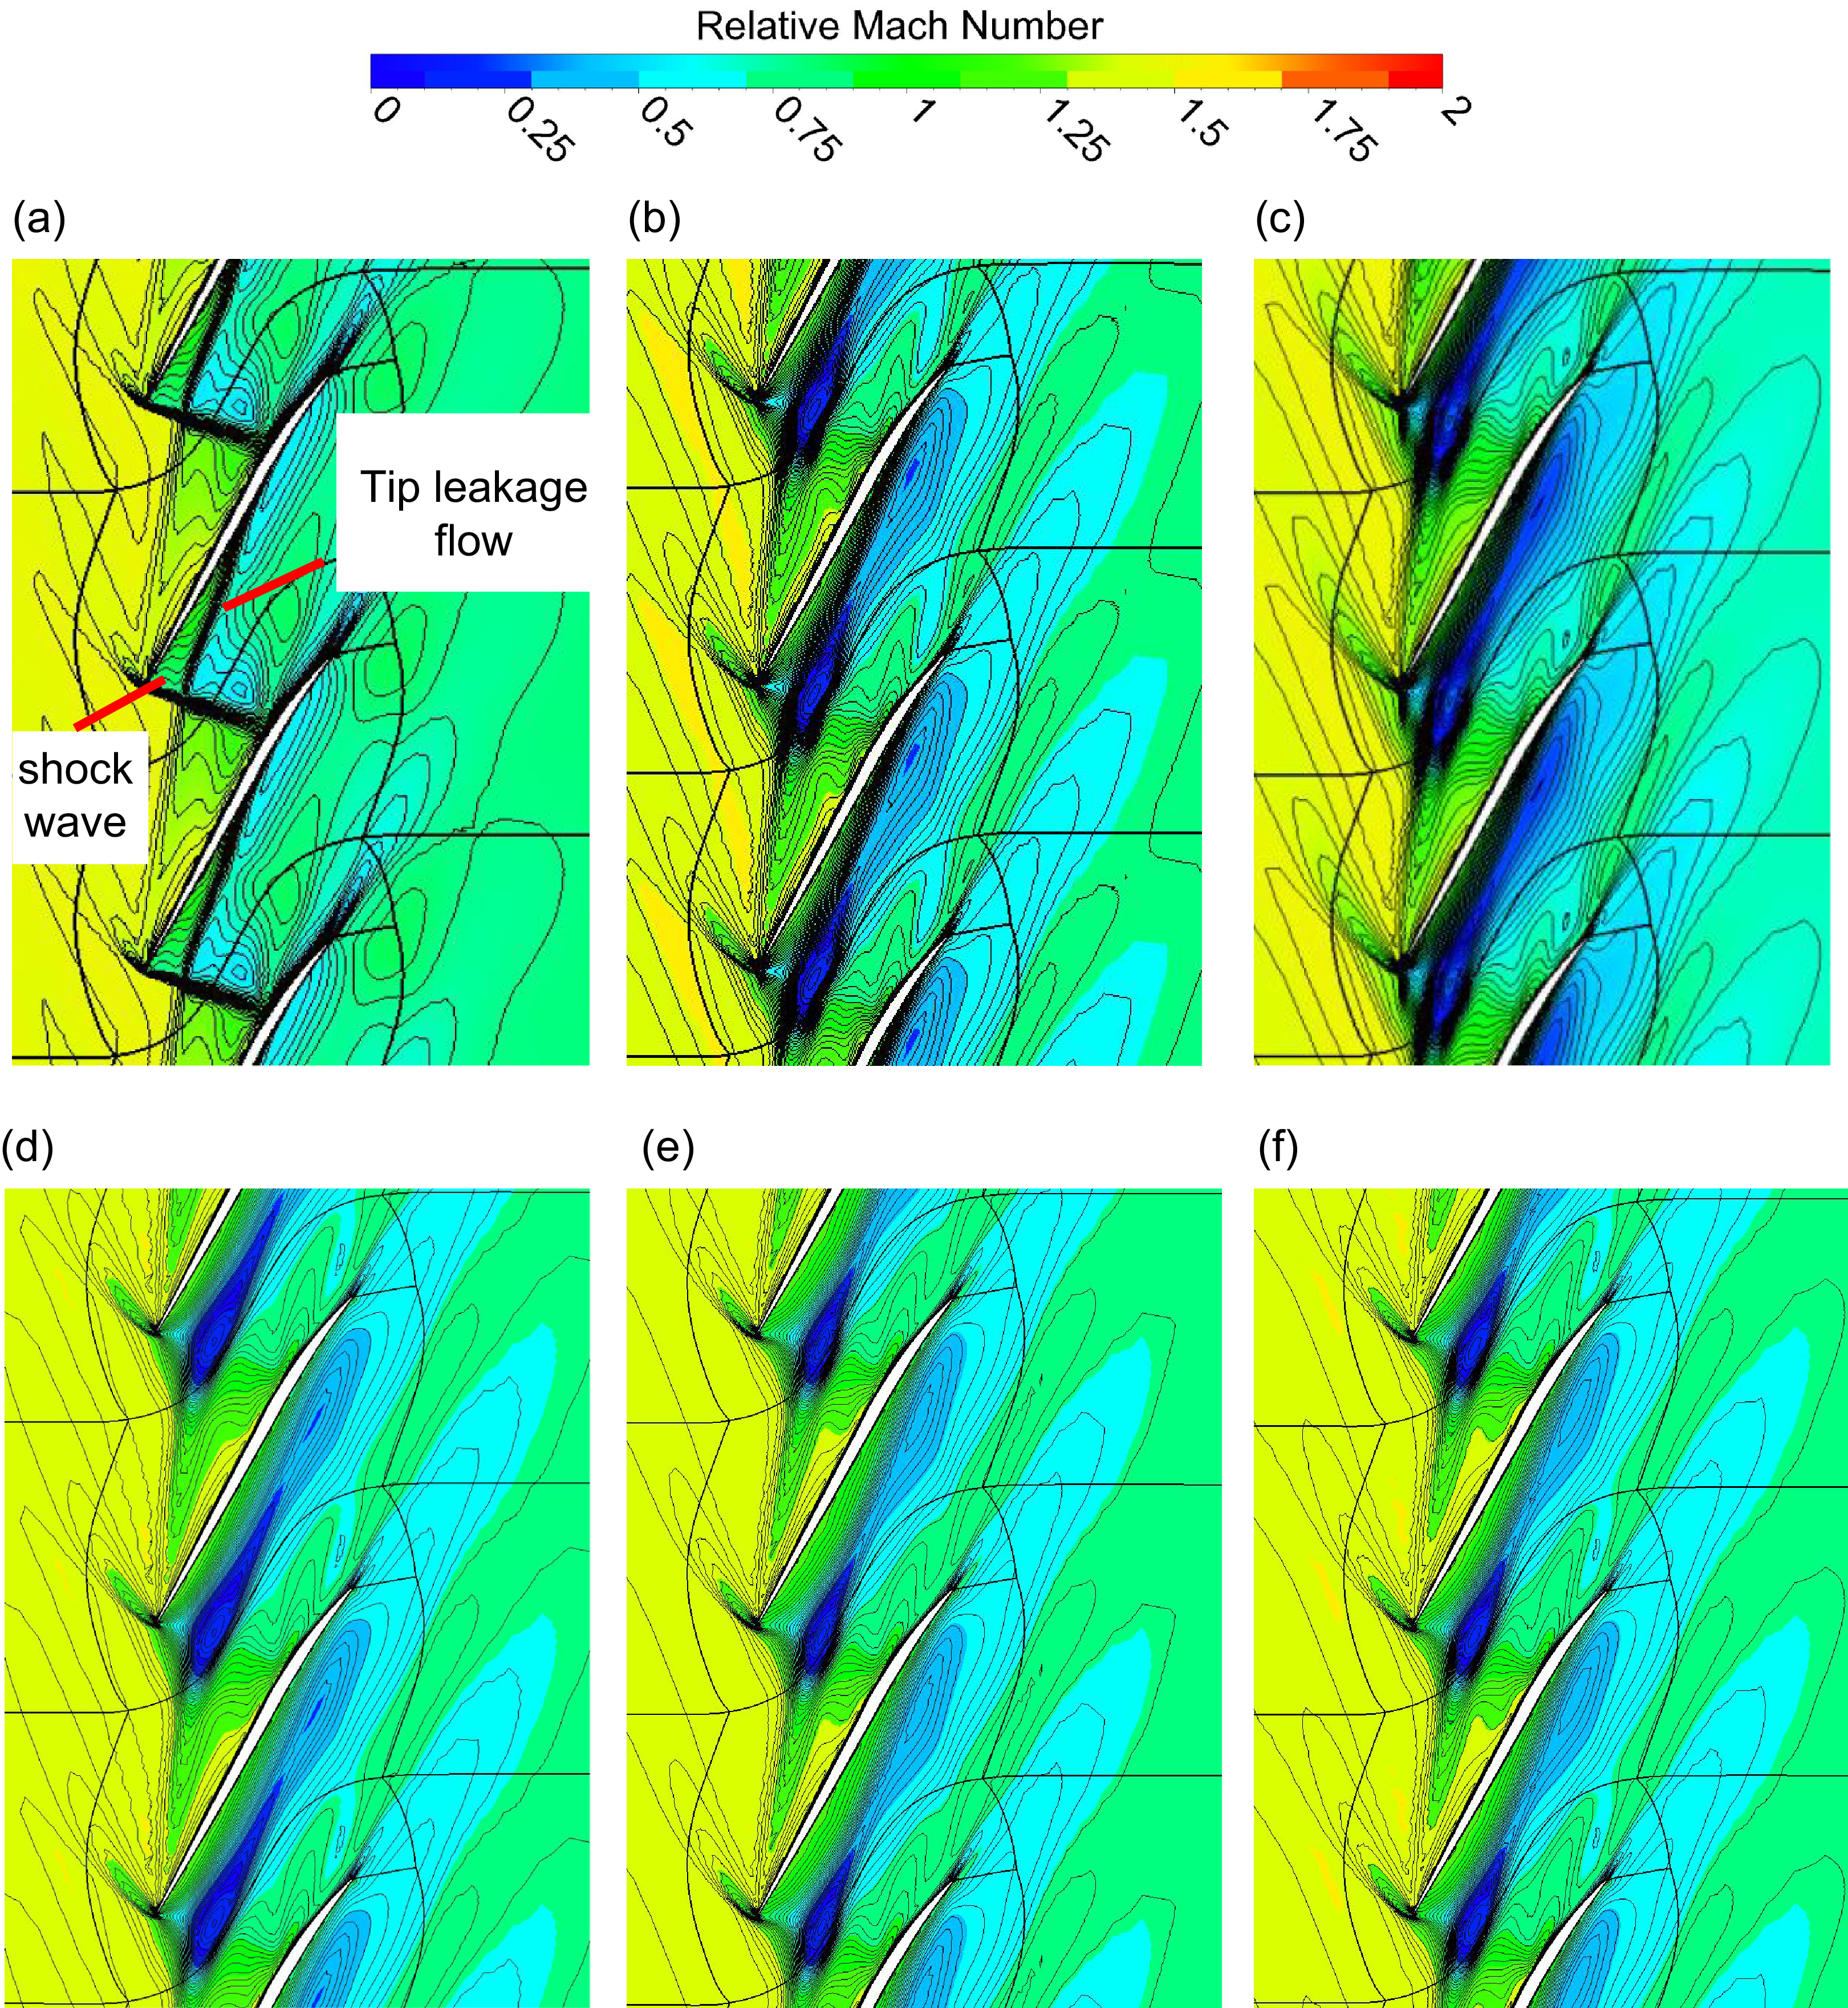
To further analyse the flow structure in the upper gas path, the relative Mach number distributions at 99% blade span under 112 kPa backpressure are examined for different scraping morphologies and deepest scraping positions, as shown in Fig. 15. Analysis of Fig. 15(a) to (d) reveals that in the unscraped case, a shockwave tightly adheres to the blade leading edge and intersects with adjacent blades, with tip leakage flow initiating at 30% chord length from the trailing edge, interacting with the shockwave in the main flow channel to slightly modify the shock shape while gradually weakening in intensity as it traverses the shock and migrates toward the suction side. In the L1-scraped case, tip leakage flow strengthens with its initiation point shifting closer to the trailing edge, where the vortex core aligns near the pressure surface leading edge, flows from the pressure side to the suction side of adjacent blades, drastically distorts the shockwave and creates a high-loss zone. The M1-scraped case exhibits further intensified leakage flow, whereas the H1-scraped case shows weakened leakage flow compared to L1, with the vortex core positioned midway in the flow channel. Observations from Fig. 15(d) to (f) indicate that rearward shifts in the deepest scraping position slightly reduce tip leakage flow intensity, consistent with the conclusions drawn from Fig. 10.
Relative Mach number distribution of 99% span. (a) No scraping, (b) L1, (c) M1, (d) H1, (e) H2 and (f) H3.

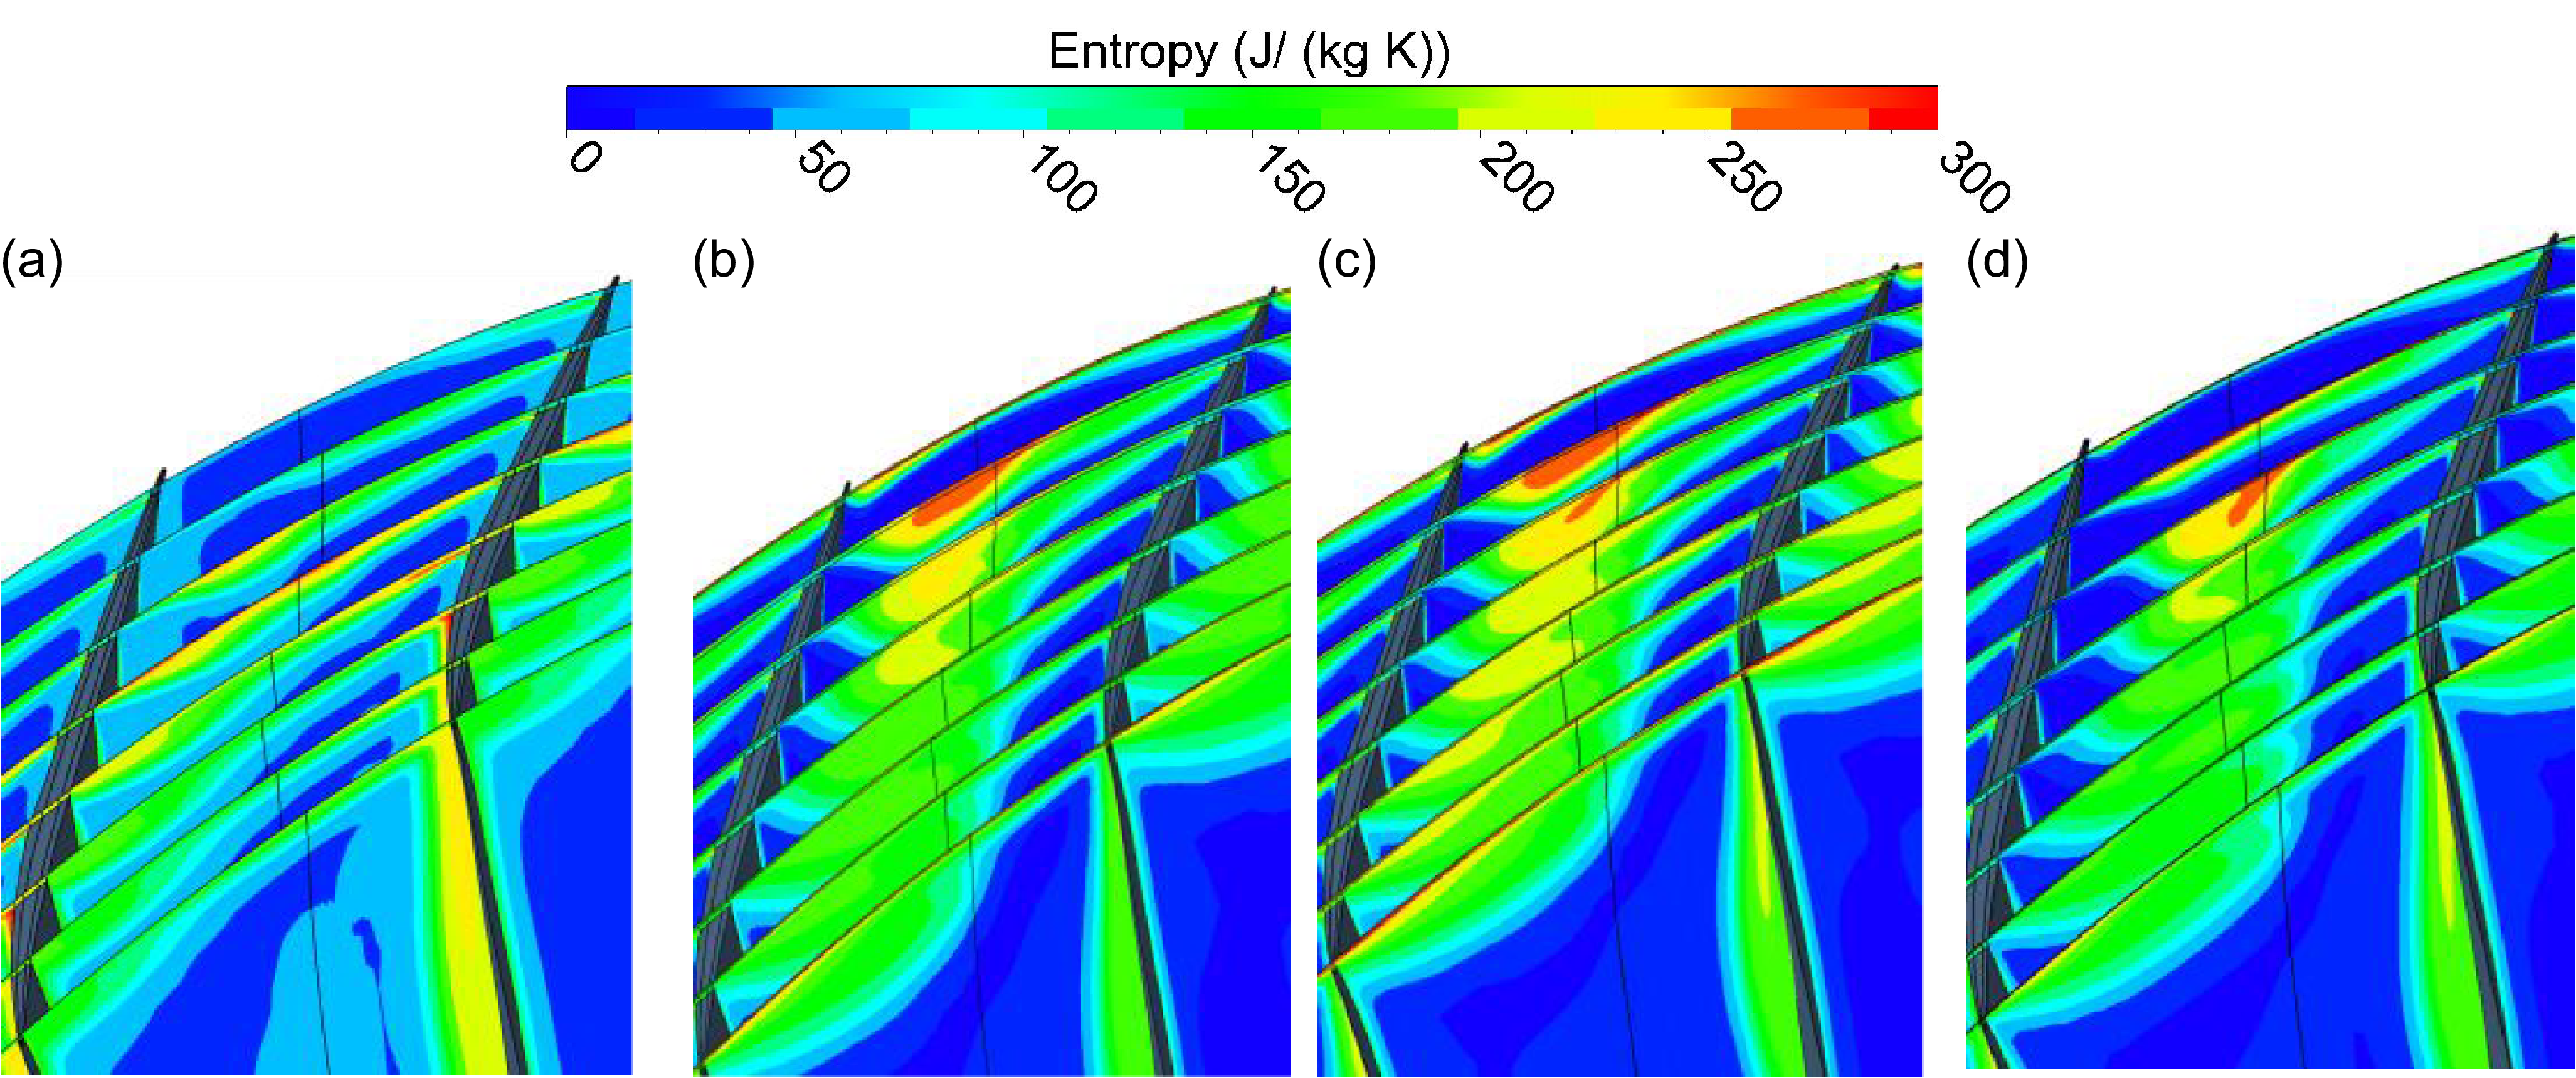
The entropy distributions of flow fields under different scraping depths are shown in Fig. 16. Research results indicate that in the unscraped case, the entropy generation region within the main flow channel is relatively small, primarily concentrated in the upper-central region near the casing with an affected height of approximately 3.9% blade span, where tip leakage flow is weak and flow losses are minimal. Under the L1-scraped condition, the entropy generation region expands circumferentially and radially, reaching a maximum affected height of 8.3% blade span, with a high-entropy zone emerging on the pressure side near the blade leading edge. Combined with Figure 15, this phenomenon is attributed to interactions between tip leakage flow and shockwaves, causing significant energy loss. For the H1-scraped case, entropy levels are lower, with a maximum affected height of 6.8% blade span. In the M1-scraped case, intensified tip leakage flow displaces suction-side separation vortices toward the pressure side of adjacent blades, shifting the high-entropy region closer to the pressure side and resulting in a maximum affected height of 9.1% blade span, accompanied by enlarged low-energy flow zones and increased leakage losses.
Entropy distribution at different scraping depths-112 kPa. (a) R37, (b) L1, (c) M1 and (d) H1.

3.3 Impact of scraping-induced roughness on rotor performance
Based on the scraping roughness range of low-hardness coatings in Table 2, the C1 scraping case is selected as an example, with roughness values set to 0, 15, 27.09, 30.73, 45 and 57.78
 $ \mu$
m to analyse the impact of scraping-induced roughness on compressor performance.
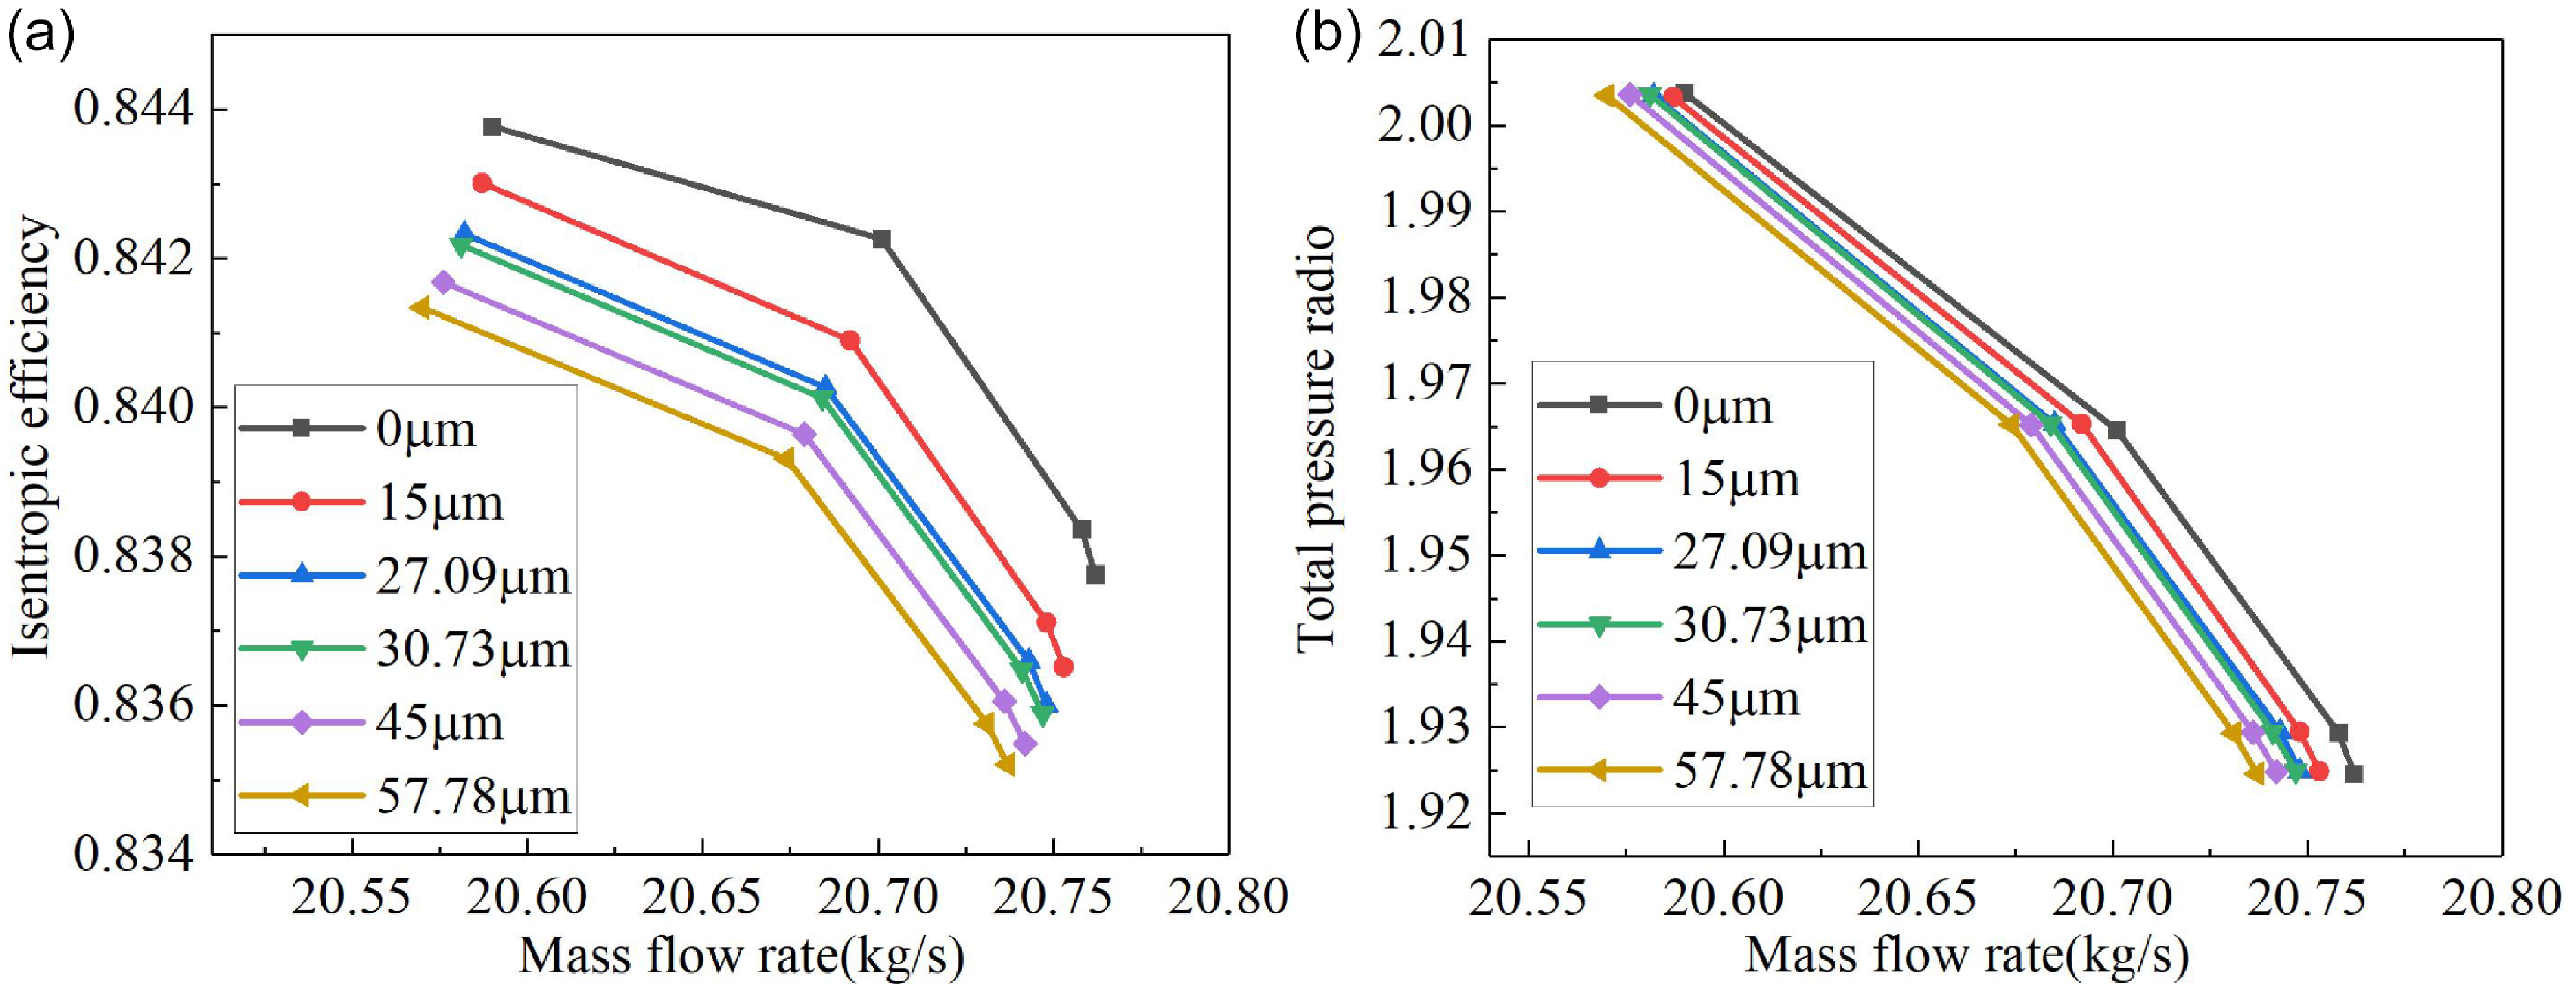
Figure 17 illustrates variations in isentropic efficiency and pressure ratio under different roughness conditions, showing that as roughness increases, the characteristic curves retain their original shape but shift leftward and downward uniformly with gradual reductions in outlet mass flow, isentropic efficiency and total pressure ratio. Compared to the 0
 $ \varphi$
m roughness baseline: 15
 $ \varphi$
m roughness yields an average 0.14% decrease in isentropic efficiency; 27.09
 $ \varphi$
m roughness results in a 0.21% average efficiency reduction; 30.7
 $ \varphi$
m roughness causes a 0.22% average efficiency decline; 45
 $ \varphi$
m roughness leads to a 0.28% average efficiency drop; and 57.78
 $ \varphi$
m roughness exhibits the highest degradation with a 0.31% average efficiency loss.
Performance curve under different scraping roughness. (a) Efficiency and (b) pressure radio.

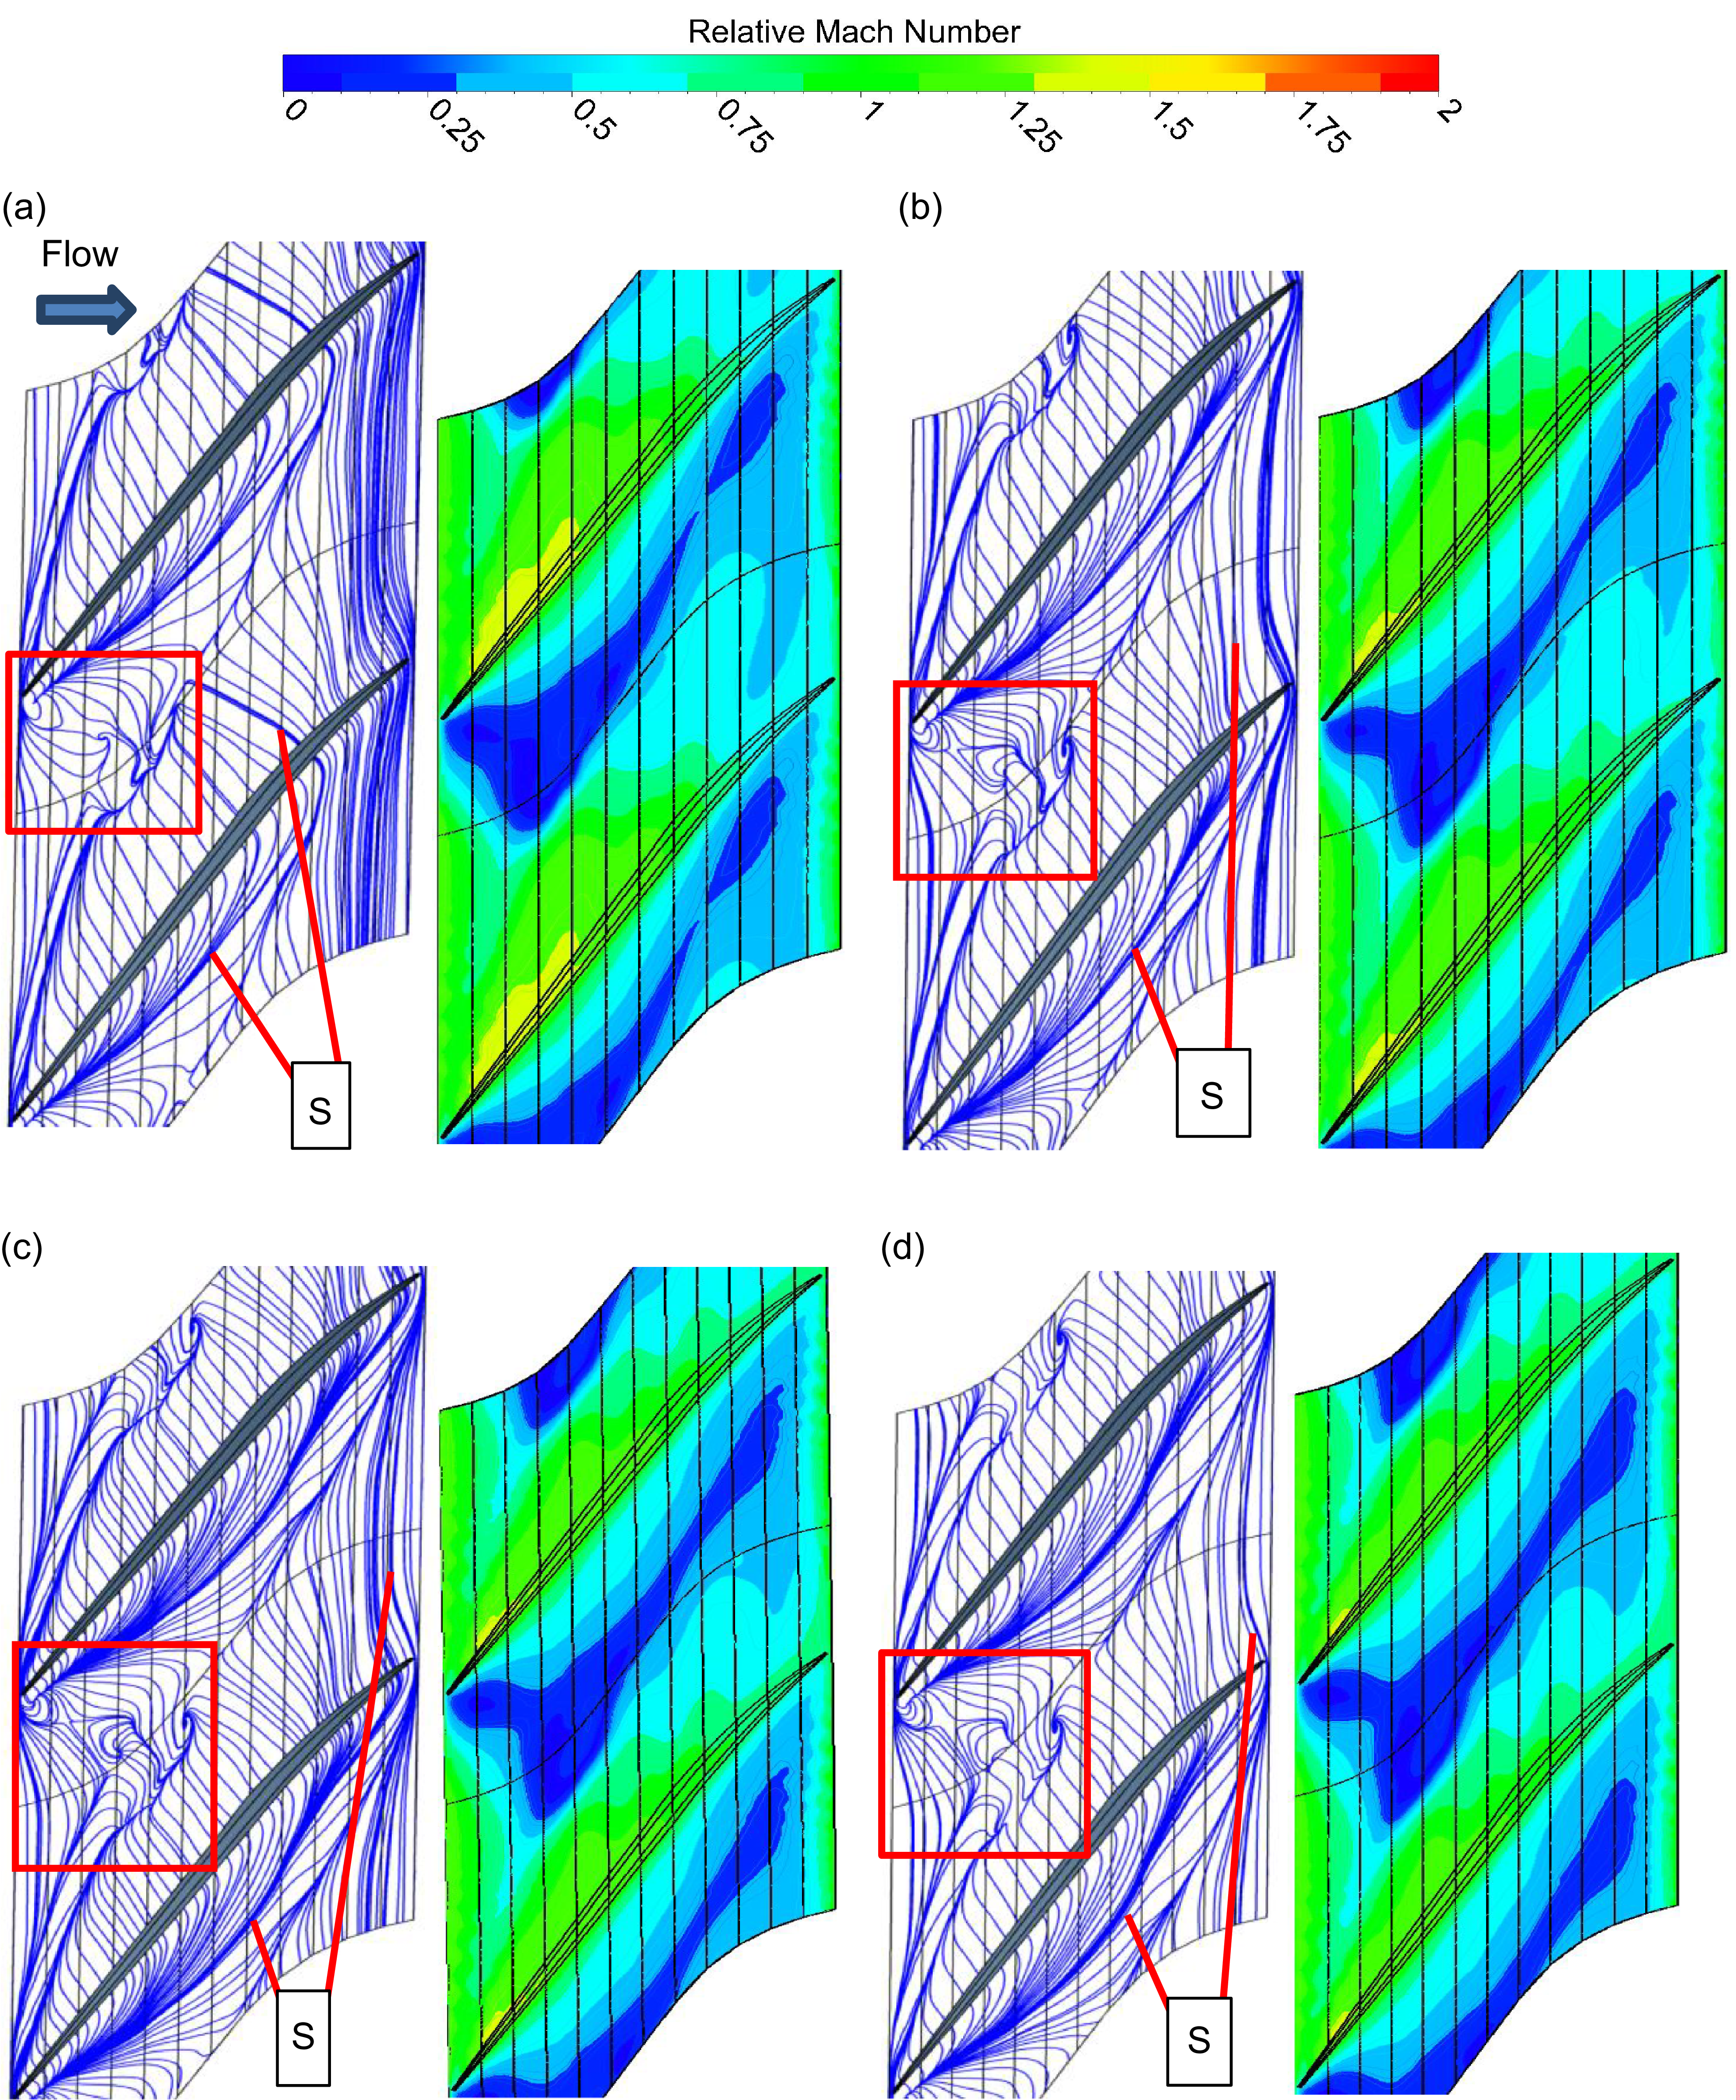
Figure 18 compares the evolution of limiting streamlines and relative Mach number distributions in the casing wear zone with increasing surface roughness. The results demonstrate that flow separation occurs across all roughness levels, with two counter-rotating vortices generated near the blade leading edge. As surface roughness increases, the near-wall boundary layer thickens, flow viscosity intensifies and roughness-induced disturbances enlarge the vortex region near the blade leading edge, promoting flow separation under adverse pressure gradients. This causes the separation line S to shift rearward significantly, accompanied by progressive expansions in separation zone extent and scale. The relative Mach number contours further confirm that low-speed flow regions expand with roughness.
Limited streamline diagram of the casing wear area. (a) k
s = 0, (b) k
s = 15
 $ \mu{\rm {m}}$
, (c) k
s = 30.73
 $ \mu{\rm {m}}$
and (d) k
s = 57.78
 $ \mu{\rm {m}}$
.

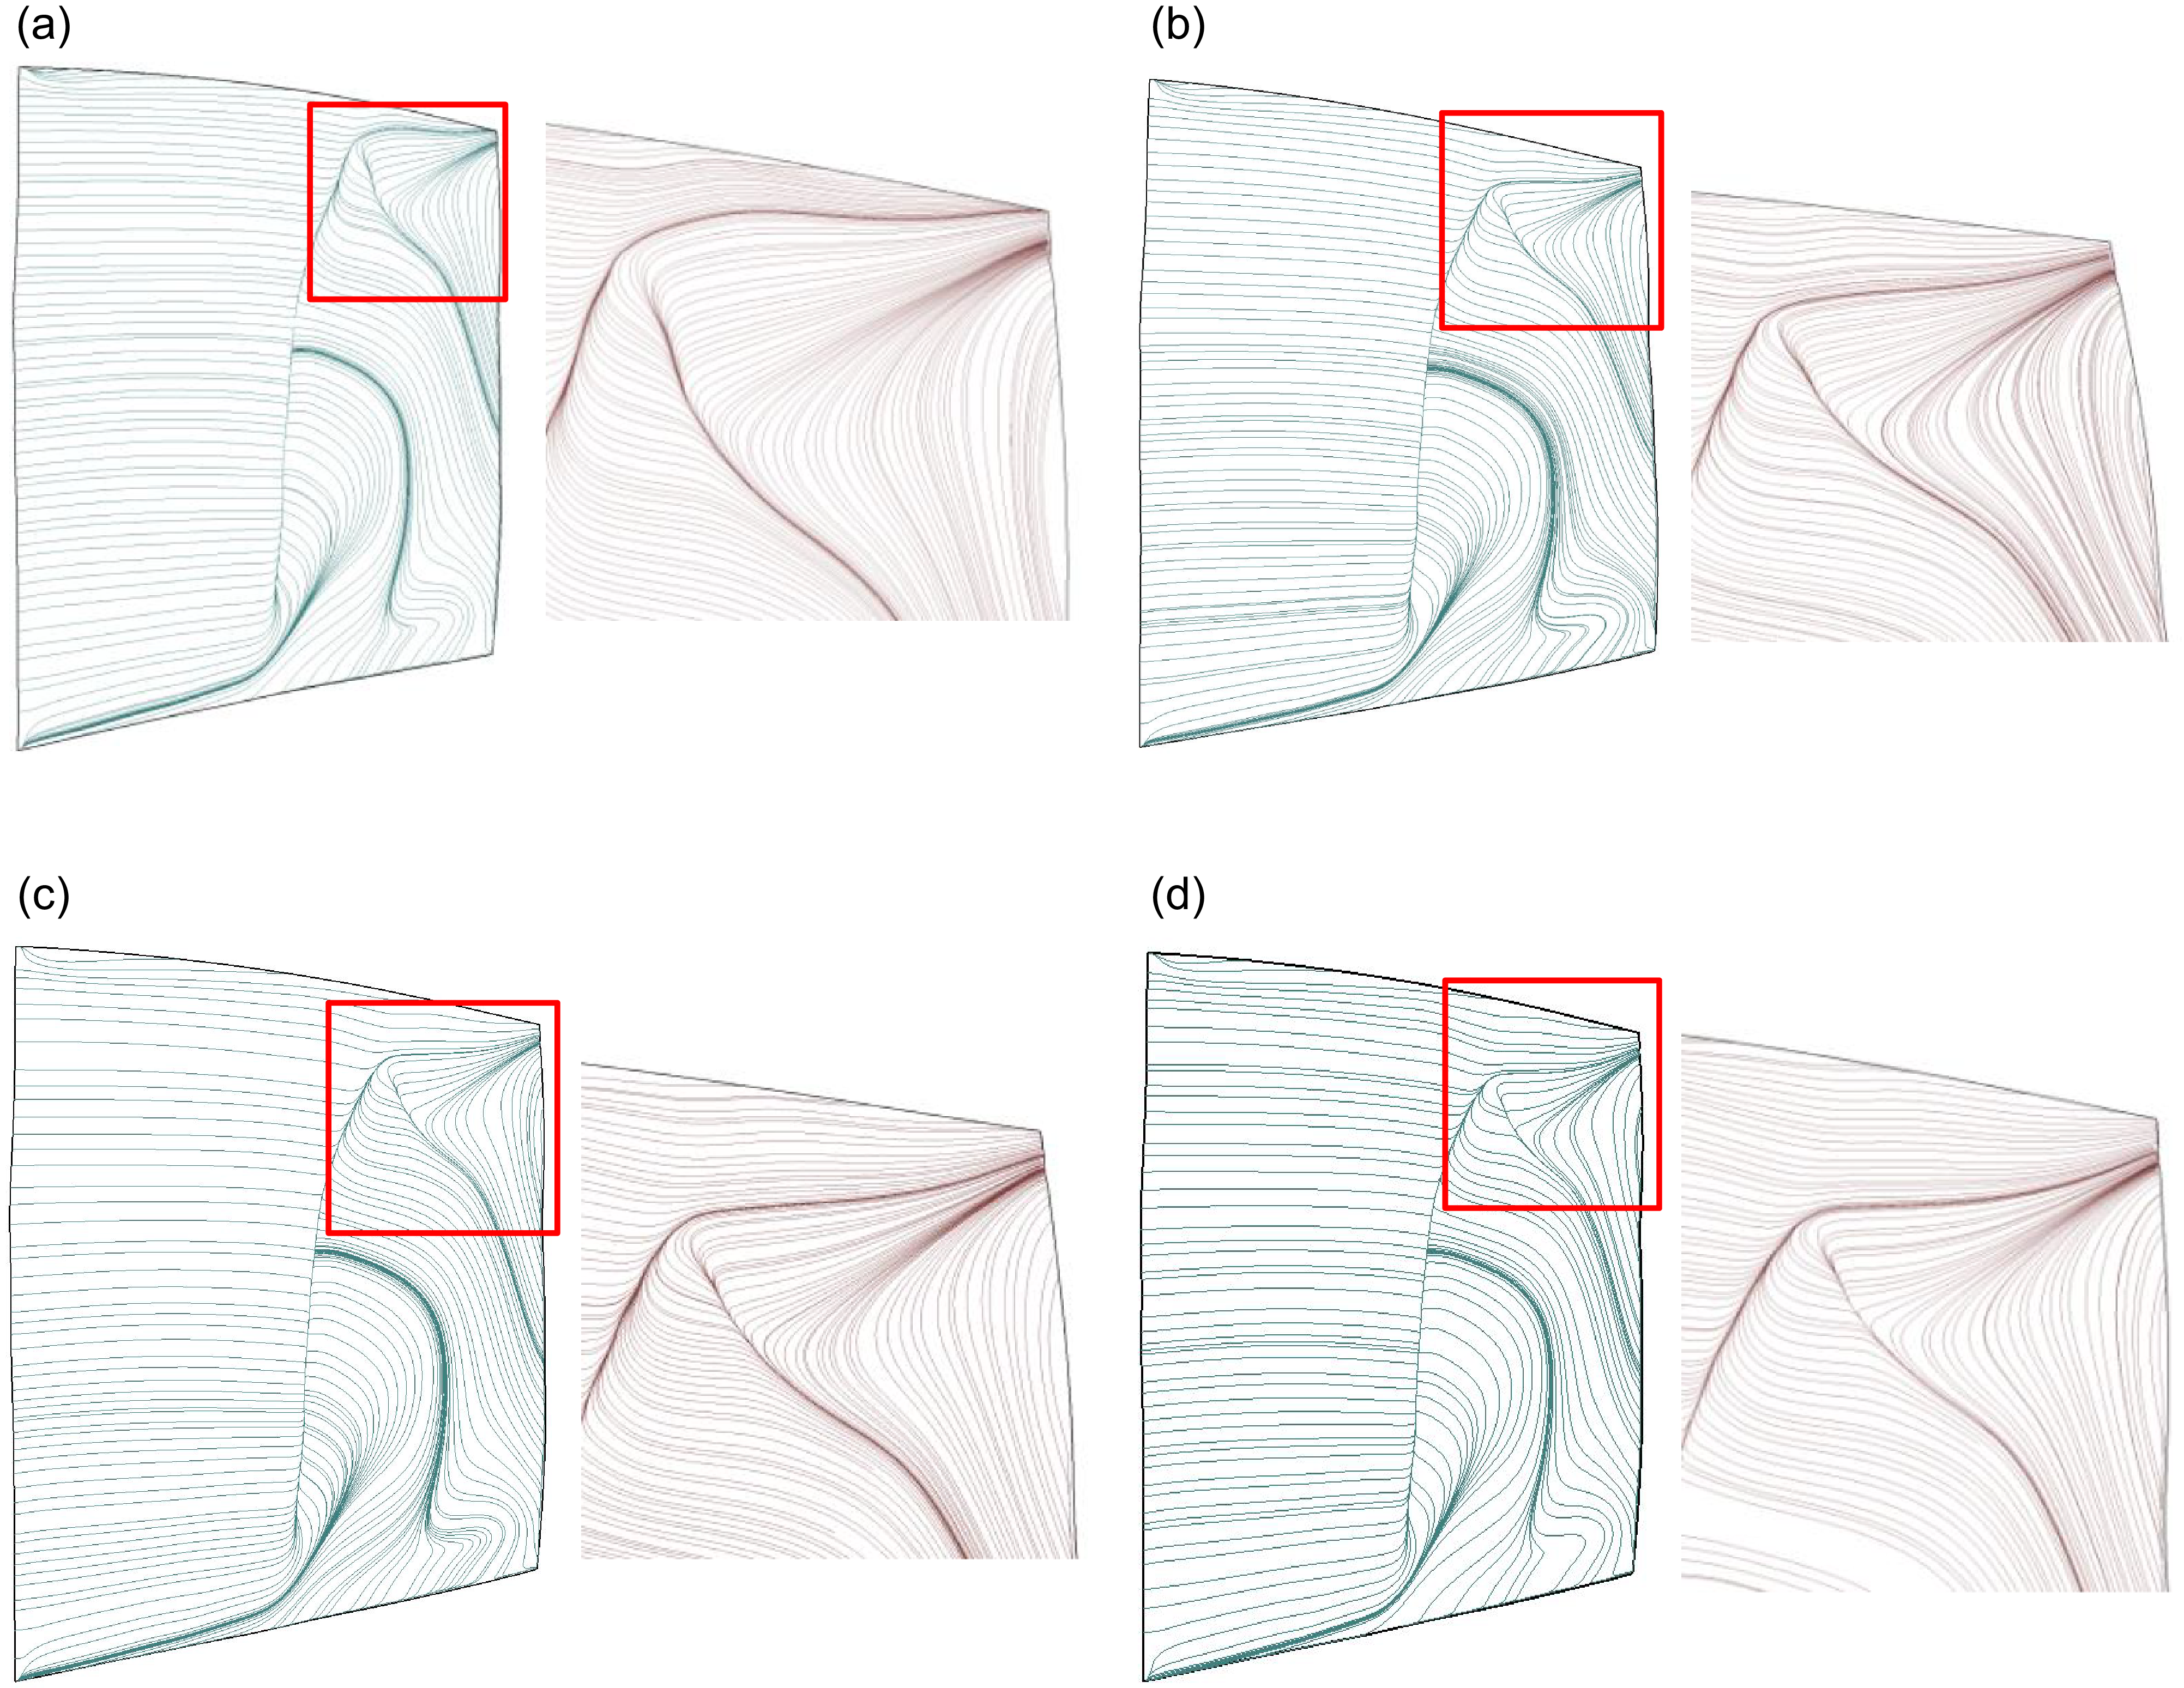
Figure 19 illustrates the extreme streamlines of the rotor suction surface under different scraping roughness conditions. It can be observed that, prior to boundary layer flow separation, the streamlines are relatively uniform and parallel to the endwall, moving from the leading edge to the trailing edge. Once separation occurs, the streamlines twist from the root to the tip of the rotor blade, forming a radial secondary flow structure, with the separation occurring predominantly from the root towards the higher portion of the rotor blade. However, as the roughness increases, the range of the separation zone on the rotor suction surface decreases slightly. This is primarily due to the fact that flow separation near the rotor suction surface, particularly in the vicinity of the tip region, is mainly induced by the strong interference of the tip leakage vortex. The high-momentum leakage vortex interacts with the boundary layer flow on the rotor suction surface, causing significant velocity shear, which entraps and accelerates the low-speed boundary layer near the rotor wall, thereby triggering and intensifying flow separation. Conversely, as the roughness in the casing scraping region increases, the intensity of the tip leakage vortex diminishes, leading to a weakened effect on the suction surface boundary layer. Consequently, the position of the flow separation line shifts downward, and the range of the suction surface flow separation zone reduces accordingly.
Limited streamline of the suction surface under different scraping roughness. (a) k
s = 0, (b) k
s = 15
 $ \mu{\rm {m}}$
, (c) k
s = 30.73
 $ \mu{\rm {m}}$
and (d) k
s = 57.78
 $ \mu{\rm {m}}$
.

In summary, an increase in roughness within the casing wear region results in a thickening of the boundary layer, thereby increasing both frictional losses and mixing losses between the tip leakage flow and the wall boundary layer. Although the tip leakage rate decreases and the range of flow separation on the rotor suction surface diminishes, the overall compressor efficiency still declines due to these effects.
4.0 Conclusions
This study analyses the scraping clearance characteristics of sealing coatings with different hardness under high-speed scraping conditions, simulates the microscopic ‘plough groove’ morphology through surface roughness and establishes a casing scraping model based on these parameters. The mechanisms governing compressor aerodynamic performance variations induced by rotor-stator scraping interactions are quantitatively investigated. The main conclusions are as follows:
-
(1) Casing wear under different coating hardness levels consistently reduces compressor isentropic efficiency and outlet mass flow, but exerts minimal impact on pressure ratio. For medium-hardness coating wear, the degradation magnitudes of isentropic efficiency and outlet mass flow reach 1.96% and 1.39%, respectively. Low-hardness coating wear shows degradation values of 1.78% and 1.21%, while high-hardness coating wear demonstrates reductions of 1.69% and 1.16%.
-
(2) After coating scraping, enhanced mixing between LE leakage flow and MID leakage flow induces higher tip internal clearance flow mixing losses. Concurrently, the tip leakage flow pushes the suction surface separation vortex toward the main flow passage mid-span, generating entropy rise. This flow evolution further develops into intensified tip leakage vortices that interact with shock waves, creating additional tip losses. These mechanisms collectively shift both the mass flow-efficiency and mass flow-pressure ratio characteristic curves toward lower mass flow regions. Under unscraped casing conditions, the maximum affected height of entropy generation regions in the main flow passage reaches approximately 3.9% blade height. For low-hardness coating scraping, this maximum affected height increases to about 8.3% blade height; high-hardness coating scraping shows 6.8% blade height; while medium-hardness coating scraping exhibits the most significant impact with approximately 9.1% blade height.
-
(3) Compressor aerodynamic performance exhibits limited sensitivity to roughness variations in wear regions. Although isentropic efficiency shows relatively higher susceptibility to roughness changes, the maximum reduction reaches only 0.31%. With increased surface roughness, the boundary layer thickness in near-wall regions grows while turbulent fluctuations intensify. Enhanced roughness disturbances promote airflow separation under adverse pressure gradients, leading to continuous expansion of separation zone dimensions and scales. These alterations induce flow structure modifications in both tip leakage flow and blade wake regions.
Acknowledgements
This work supported by the Key Project of Natural Science of Fundamental Research Funds for the Central Universities (3122023045) and the General Program of Natural Fund of Tianjin Science and Technology Plan project (23JCYBJC00110).
Competing interests
The authors declare none.