




%20--%3e%3c!DOCTYPE%20svg%20PUBLIC%20'-//W3C//DTD%20SVG%201.0//EN'%20'http://www.w3.org/TR/2001/REC-SVG-20010904/DTD/svg10.dtd'%3e%3csvg%20version='1.0'%20id='Layer_1'%20xmlns='http://www.w3.org/2000/svg'%20xmlns:xlink='http://www.w3.org/1999/xlink'%20x='0px'%20y='0px'%20width='64px'%20height='64px'%20viewBox='5.5%20-3.5%2064%2064'%20enable-background='new%205.5%20-3.5%2064%2064'%20xml:space='preserve'%3e%3cg%3e%3ccircle%20fill='%23FFFFFF'%20fill-opacity='0'%20cx='37.785'%20cy='28.501'%20r='28.836'/%3e%3cpath%20fill='%23595959'%20d='M37.441-3.5c8.951,0,16.572,3.125,22.857,9.372c3.008,3.009,5.295,6.448,6.857,10.314%20c1.561,3.867,2.344,7.971,2.344,12.314c0,4.381-0.773,8.486-2.314,12.313c-1.543,3.828-3.82,7.21-6.828,10.143%20c-3.123,3.085-6.666,5.448-10.629,7.086c-3.961,1.638-8.057,2.457-12.285,2.457s-8.276-0.808-12.143-2.429%20c-3.866-1.618-7.333-3.961-10.4-7.027c-3.067-3.066-5.4-6.524-7-10.372S5.5,32.767,5.5,28.5c0-4.229,0.809-8.295,2.428-12.2%20c1.619-3.905,3.972-7.4,7.057-10.486C21.08-0.394,28.565-3.5,37.441-3.5z%20M37.557,2.272c-7.314,0-13.467,2.553-18.458,7.657%20c-2.515,2.553-4.448,5.419-5.8,8.6c-1.354,3.181-2.029,6.505-2.029,9.972c0,3.429,0.675,6.734,2.029,9.913%20c1.353,3.183,3.285,6.021,5.8,8.516c2.514,2.496,5.351,4.399,8.515,5.715c3.161,1.314,6.476,1.971,9.943,1.971%20c3.428,0,6.75-0.665,9.973-1.999c3.219-1.335,6.121-3.257,8.713-5.771c4.99-4.876,7.484-10.99,7.484-18.344%20c0-3.543-0.648-6.895-1.943-10.057c-1.293-3.162-3.18-5.98-5.654-8.458C50.984,4.844,44.795,2.272,37.557,2.272z%20M37.156,23.187%20l-4.287,2.229c-0.458-0.951-1.019-1.619-1.685-2c-0.667-0.38-1.286-0.571-1.858-0.571c-2.856,0-4.286,1.885-4.286,5.657%20c0,1.714,0.362,3.084,1.085,4.113c0.724,1.029,1.791,1.544,3.201,1.544c1.867,0,3.181-0.915,3.944-2.743l3.942,2%20c-0.838,1.563-2,2.791-3.486,3.686c-1.484,0.896-3.123,1.343-4.914,1.343c-2.857,0-5.163-0.875-6.915-2.629%20c-1.752-1.752-2.628-4.19-2.628-7.313c0-3.048,0.886-5.466,2.657-7.257c1.771-1.79,4.009-2.686,6.715-2.686%20C32.604,18.558,35.441,20.101,37.156,23.187z%20M55.613,23.187l-4.229,2.229c-0.457-0.951-1.02-1.619-1.686-2%20c-0.668-0.38-1.307-0.571-1.914-0.571c-2.857,0-4.287,1.885-4.287,5.657c0,1.714,0.363,3.084,1.086,4.113%20c0.723,1.029,1.789,1.544,3.201,1.544c1.865,0,3.18-0.915,3.941-2.743l4,2c-0.875,1.563-2.057,2.791-3.541,3.686%20c-1.486,0.896-3.105,1.343-4.857,1.343c-2.896,0-5.209-0.875-6.941-2.629c-1.736-1.752-2.602-4.19-2.602-7.313%20c0-3.048,0.885-5.466,2.658-7.257c1.77-1.79,4.008-2.686,6.713-2.686C51.117,18.558,53.938,20.101,55.613,23.187z'/%3e%3c/g%3e%3c/svg%3e)
%20--%3e%3c!DOCTYPE%20svg%20PUBLIC%20'-//W3C//DTD%20SVG%201.0//EN'%20'http://www.w3.org/TR/2001/REC-SVG-20010904/DTD/svg10.dtd'%3e%3csvg%20version='1.0'%20id='Layer_1'%20xmlns='http://www.w3.org/2000/svg'%20xmlns:xlink='http://www.w3.org/1999/xlink'%20x='0px'%20y='0px'%20width='64px'%20height='64px'%20viewBox='5.5%20-3.5%2064%2064'%20enable-background='new%205.5%20-3.5%2064%2064'%20xml:space='preserve'%3e%3cg%3e%3ccircle%20fill='%23FFFFFF'%20fill-opacity='0'%20cx='37.637'%20cy='28.806'%20r='28.276'/%3e%3cg%3e%3cpath%20fill='%23595959'%20d='M37.443-3.5c8.988,0,16.57,3.085,22.742,9.257C66.393,11.967,69.5,19.548,69.5,28.5c0,8.991-3.049,16.476-9.145,22.456%20C53.879,57.319,46.242,60.5,37.443,60.5c-8.649,0-16.153-3.144-22.514-9.43C8.644,44.784,5.5,37.262,5.5,28.5%20c0-8.761,3.144-16.342,9.429-22.742C21.101-0.415,28.604-3.5,37.443-3.5z%20M37.557,2.272c-7.276,0-13.428,2.553-18.457,7.657%20c-5.22,5.334-7.829,11.525-7.829,18.572c0,7.086,2.59,13.22,7.77,18.398c5.181,5.182,11.352,7.771,18.514,7.771%20c7.123,0,13.334-2.607,18.629-7.828c5.029-4.838,7.543-10.952,7.543-18.343c0-7.276-2.553-13.465-7.656-18.571%20C50.967,4.824,44.795,2.272,37.557,2.272z%20M46.129,20.557v13.085h-3.656v15.542h-9.944V33.643h-3.656V20.557%20c0-0.572,0.2-1.057,0.599-1.457c0.401-0.399,0.887-0.6,1.457-0.6h13.144c0.533,0,1.01,0.2,1.428,0.6%20C45.918,19.5,46.129,19.986,46.129,20.557z%20M33.042,12.329c0-3.008,1.485-4.514,4.458-4.514s4.457,1.504,4.457,4.514%20c0,2.971-1.486,4.457-4.457,4.457S33.042,15.3,33.042,12.329z'/%3e%3c/g%3e%3c/g%3e%3c/svg%3e)
1. Introduction
The Gaia–Enceladus (also known as Gaia–Sausage) merger event represents one of the most significant accretion episodes in the Milky Way’s history (Helmi et al. Reference Helmi, Babusiaux, Koppelman, Massari, Veljanoski and Brown2018, Belokurov et al. Reference Belokurov, Erkal, Evans, Koposov and Deason2018). It is believed to have occurred approximately 8–11 Gyr ago and contributed a substantial number of metal-poor, high-eccentricity stars to the Galactic halo. The identification and characterization of stars originating from this ancient dwarf galaxy is therefore crucial for reconstructing the early mass assembly and chemical enrichment of the Milky Way.
Various methods have been proposed in the literature to identify Gaia–Enceladus stars, ranging from kinematic cuts in orbital energy and angular momentum (Belokurov et al. Reference Belokurov, Erkal, Evans, Koposov and Deason2018), to clustering in action space (Myeong et al. Reference Myeong, Vasiliev, Iorio, Evans and Belokurov2019), to purely chemical abundance planes such as [Mg/Mn] vs [Al/Fe] (Das et al. Reference Das, Hawkins and Jofré2020; Horta et al. Reference Horta, Schiavon, Mackereth, Weinberg, Hasselquist, Feuillet, O’Connell, Anguiano, Allende-Prieto, Beaton, Bizyaev, Cunha, Geisler, García-Hernández, Holtzman, Jönsson, Lane, Majewski, Mészáros, Minniti, Nitschelm, Shetrone, Smith and Zasowski2023; Fernandes et al. Reference Fernandes, Mason, Horta, Schiavon, Hayes, Hasselquist, Feuillet, Beaton, Jönsson, Kisku, Lacerna, Lian, Minniti and Villanova2023). However, these approaches often differ in their selection criteria, resulting in partially overlapping but non-identical stellar samples. This lack of consensus calls for a more systematic and data-driven approach.
In this work, we apply unsupervised machine learning techniques to a high-quality APOGEE-Gaia sample to explore the stability and consistency of Gaia–Enceladus identification across different pipelines. Specifically, we investigate multiple combinations of dimensionality reduction (PCA, t-SNE) and clustering (K-means, GMM, HDBSCAN) algorithms, and optimize each pipeline using internal validation metrics such as the Calinski–Harabasz index. We then assess the consistency of the resulting selections using similarity metrics, both among the pipelines and against key literature-based Gaia–Enceladus definitions.
By isolating the most chemically and dynamically coherent cluster, we use its abundance patterns to constrain a one-zone chemical evolution model via MCMC fitting. This allows us to estimate the initial gas mass of Gaia–Enceladus and its star formation history, offering a self-consistent picture that links observational selection to physical modeling.
This combined chemo-dynamical approach not only provides an independent confirmation of the distinct nature of Gaia–Enceladus stars, but also highlights the importance of methodological transparency and robustness when analyzing ancient merger debris in the Milky Way halo.
2. Data and Methodology
We used the APOGEE DR17 spectroscopic data matched with Gaia DR3 astrometry, forming a dataset of 733,901 stars. Quality cuts included: S/N
 $\geq 70$
,
 $\sigma_\varpi / \varpi \leq 0.2$
, and flags (ASPCAPFLAG, STARFLAG, and elemental flags for Fe, Mg, Mn, Al) set to zero. We restricted to giants with
 $0.5 \leq \log g \leq 3.6$
and
 $3500\,\mathrm{K} \leq T_\mathrm{eff} \leq 5500\,\mathrm{K}$
, yielding 137,046 stars. We computed full space motions and orbital parameters using Astropy and galpy, assuming
 $R_\odot = 8.2$
kpc,
 $V_\mathrm{LSR} = 232.8$
km/s, and solar motion
 $(U, V, W) = (11.10, 12.24, 7.25)$
km/s. We integrated the orbits under the McMillan potential (McMillan Reference McMillan2017) to derive
 $R_\mathrm{apo}$
,
 $R_\mathrm{peri}$
,
 $Z_{max}$
,
 $L_z$
, E, and e. To reduce disk contamination, we exclude stars with
 $L_z \geq 0$
and
 $e \leq 0.6$
, identified as primarily in-situ disk stars based on their location in the Lindblad diagram. The final sample contains 16,400 stars.
The final sample stars were projected into a 2D space using t-SNE or PCA with input features:
 $[Fe/H]$
,
 $[Mg/Fe]$
,
 $[Mn/Fe]$
,
 $[Al/Fe]$
,
 $L_z$
, and E. Clustering was performed using K-means, GMM, or HDBSCAN. To evaluate clustering performance, we calculated the Calinski-Harabasz (CH) index across a grid of hyperparameters for each dimensionality reduction and clustering combination. The best-performing configurations, determined by the highest CH score, were then used to identify candidate Gaia-Enceladus clusters.
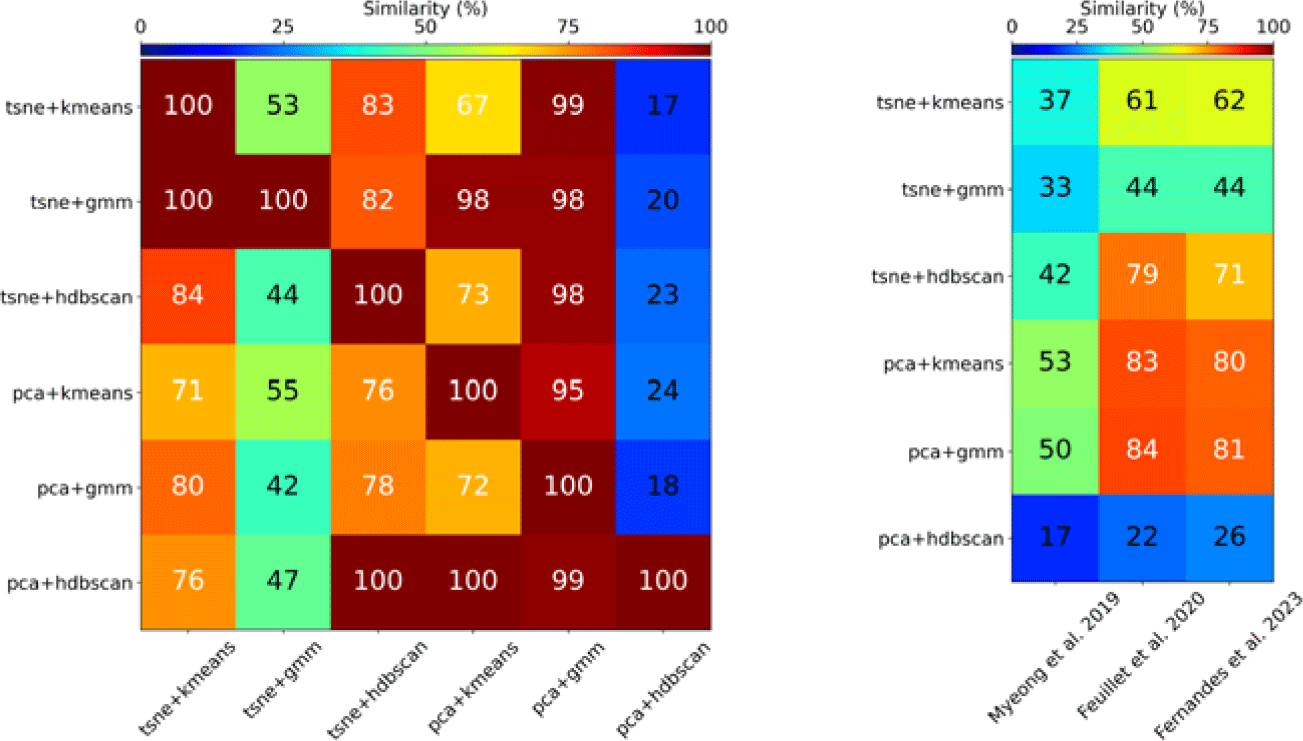
We compared the resulting clusters using a similarity metric applied both internally (i.e., between different machine learning pipelines) and externally (i.e., with selections from previous literature). The left panel of Figure 1 displays pairwise similarity scores among the machine learning pipelines, indicating the percentage of overlap in the identified Gaia-Enceladus stars. The right panel compares the clusters obtained from the best-performing pipelines with those identified by Myeong et al. (Reference Myeong, Vasiliev, Iorio, Evans and Belokurov2019), Feuillet et al. (Reference Feuillet, Feltzing, Sahlholdt and Casagrande2020), and Fernandes et al. (Reference Fernandes, Mason, Horta, Schiavon, Hayes, Hasselquist, Feuillet, Beaton, Jönsson, Kisku, Lacerna, Lian, Minniti and Villanova2023).
Left: Similarity matrix showing the percentage overlap of Gaia–Enceladus candidates across different machine learning pipelines. Right: Similarity matrix comparing Gaia–Enceladus stars identified by the best-performing pipelines to those selected in previous literature studies.

Figure 1 Long description
Panel A: A similarity matrix with six rows and six columns showing the percentage overlap of GaiaEnceladus candidates across different machine learning pipelines. The rows and columns are labeled with combinations of t-SNE or PCA with K-means, GMM, or HDBSCAN. The diagonal elements are all 100 percent, indicating perfect overlap within the same pipeline. Notable overlaps include 99 percent between t-SNE+K-means and t-SNE+GMM, and 98 percent between t-SNE+GMM and PCA+GMM. The lowest overlap is 17 percent between t-SNE+K-means and PCA+HDBSCAN. Panel B: A similarity matrix with six rows and three columns comparing the overlap of GaiaEnceladus stars identified by the best-performing pipelines to those selected in previous literature studies. The rows are labeled with the same pipeline combinations as Panel A, and the columns are labeled with studies by Myeong et al. 2019, Feuillet et al. 2020, and Fernandes et al. 2023. The highest overlap is 79 percent between t-SNE+HDBSCAN and Feuillet et al. 2020, while the lowest is 17 percent between PCA+HDBSCAN and Myeong et al. 2019.
3. Gaia-Enceladus Stars Selection Results
We observe that the selection of Gaia-Enceladus stars is not entirely consistent either between different machine learning pipelines or when compared to literature-based selections (see Figure 1). Each method highlights somewhat different stellar populations, suggesting methodological dependencies and selection biases. This is further corroborated by a similar level of inconsistency observed when literature-based selections are compared among themselves.
Nevertheless, these comparisons reveal that, while complete agreement is lacking, there exists a broad consensus on the characteristic location of Gaia-Enceladus stars in chemo-dynamical spaces. This convergence indicates that, despite methodological differences, the overall properties of the Gaia-Enceladus population can be robustly inferred.
Among all tested combinations, the t-SNE + HDBSCAN pipeline with optimized hyperparameters emerged as the most effective in identifying a chemically and kinematically coherent Gaia-Enceladus group. This combination produced three distinct clusters, one of which was identified as the Gaia-Enceladus candidate. The spatial and dynamical distributions of this selected cluster are illustrated in Figure 2, where the consistency with previously proposed selection boundaries is also evident.
Diagnostic projections of the Gaia-Enceladus cluster identified via the t-SNE + HDBSCAN pipeline. Orange points represent the selected stars, while grey background points show the full sample. Overplotted boundaries and regions from Horta et al. (Reference Horta, Schiavon, Mackereth, Weinberg, Hasselquist, Feuillet, O’Connell, Anguiano, Allende-Prieto, Beaton, Bizyaev, Cunha, Geisler, García-Hernández, Holtzman, Jönsson, Lane, Majewski, Mészáros, Minniti, Nitschelm, Shetrone, Smith and Zasowski2023), Belokurov and Kravtsov (Reference Belokurov and Kravtsov2024), Feuillet et al. (Reference Feuillet, Feltzing, Sahlholdt and Casagrande2020), Myeong et al. (Reference Myeong, Vasiliev, Iorio, Evans and Belokurov2019), and [Fernandes et al. (Reference Fernandes, Mason, Horta, Schiavon, Hayes, Hasselquist, Feuillet, Beaton, Jönsson, Kisku, Lacerna, Lian, Minniti and Villanova2023) illustrate how the selected population aligns with multiple criteria proposed in the literature.

4. Chemical Evolution Modeling
To reconstruct the chemical enrichment history of Gaia–Enceladus, we employed the OMEGA+ one-zone chemical evolution code (Côté et al. Reference Côté, O’Shea, Ritter, Herwig and Venn2017). The model includes gas inflow and outflow prescriptions, star formation following a Schmidt–Kennicutt relation (Schmidt Reference Schmidt1963; Kennicutt Reference Kennicutt1989), and nucleosynthetic yields from both core-collapse (CCSNe) and Type Ia supernovae (SNe Ia). The star formation efficiency, inflow timescale, outflow mass-loading factor, and delay-time distribution of SNe Ia are treated as free parameters.
Using the chemically selected Gaia–Enceladus stars, we fit the observed
 $[Fe/H] \times[Mg/Fe]$
abundance trend via a Markov Chain Monte Carlo approach, allowing us to statistically constrain the posterior distributions of model parameters. We assumed a Kroupa initial mass function (Kroupa et al. Reference Kroupa, Tout and Gilmore1993), exponential inflow profile, and time-delayed SNe Ia enrichment following a power-law delay-time distribution (Maoz and Mannucci Reference Maoz and Mannucci2012).
Our best-fit model yields an initial gas mass of
 $4.93^{+0.32}_{-0.72} \times 10^9~M_\odot$
and indicates an early peak in star formation within the first
 $\sim$
0.5 Gyr, followed by a rapid decline. The inferred star formation history suggests that Gaia–Enceladus underwent fast early chemical evolution with modest iron enrichment from SNe Ia due to early quenching or merger-induced suppression.
Additional details, including model assumptions, yield set comparisons, and sensitivity to different star formation histories, are presented in a forthcoming study (Plevne and Akbaba, 2025, in prep.).
5. Conclusion
Our analysis reveals that different unsupervised clustering pipelines do not converge on an identical selection of Gaia–Enceladus stars. Despite applying optimized hyperparameters and consistent feature spaces, the resulting clusters exhibit only partial overlap both among themselves and with literature-based definitions. This discrepancy underscores the methodological sensitivity of merger debris identification, particularly in the inner halo where orbital properties of accreted stars can overlap significantly with those of heated in-situ populations.
Nevertheless, our results also suggest that, although the precise boundaries vary, a broad consensus exists in the chemo-dynamical parameter space regarding where Gaia–Enceladus stars predominantly lie. This convergence highlights that a general understanding of the population has emerged, even if exact membership remains method-dependent. In particular, chemical abundance ratios-such as
 $[Mg/Mn] \times [Al/Fe]$
-continue to offer robust discriminatory power, especially when kinematic features become ambiguous due to phase-space mixing.
Our t-SNE + HDBSCAN pipeline, selected via internal validation metrics, successfully isolated a chemically and dynamically coherent candidate population. The diagnostic diagrams show that, while a subset of these stars blend with the Galactic disk in kinematic planes, their chemical signatures remain distinctive. This reinforces the importance of using chemistry as a guiding criterion when identifying ancient merger debris.
Furthermore, when these chemically selected stars are modeled using one-zone chemical evolution frameworks, the results provide strong physical support for their accreted origin. Our best-fit model reproduces their abundance trends and constrains key properties of the progenitor galaxy, including its gas mass and star formation history. These findings confirm that data-driven clustering, when coupled with physical modeling, can yield reliable insights into the hierarchical formation history of the Milky Way.
Ultimately, this study emphasizes the necessity of combining unsupervised classification techniques with chemical diagnostics and theoretical modeling to extract meaningful signals of past accretion events from the complex structure of the Galactic halo.
Acknowledgements
This research was supported by the Scientific and Technological Research Council of Turkey (TÜBİTAK) under project number 123F227 and the 2224-A International Research Fellowship Program.


 Open access

