I. INTRODUCTION
Gold nanostructures have attracted considerable attention due to the unique structure-dependent optical and electronic properties.Reference Murphy, Sau, Gole, Orendorff, Gao, Gou, Hunyadi and Li1–Reference Zhao, Li and Astruc4 Simultaneously, the intrinsic properties of noble nanomaterials have resulted in various derivative applications including photoelectronic devices, chemical catalysis, and biomedical sensing.Reference Liu and Tang5–Reference Cui, Yang, Wang, Mei, Wang and Hou8 Many kinds of noble metal nanostructures such as nanospheres, nanorods, nanocubes, nanoshells, and nanoprisms have been synthesized by photochemical, electrochemical, chemical reduction, solvothermal, template-directed, and vacuum thermal evaporation methods.Reference Vigderman, Khanal and Zubarev9–Reference Shankar, Rai, Ankamwar, Singh, Ahmad and Sastry12
Among the various nanostructure shapes, gold nanoplates are one of the promising anisotropic nanostructures owing to the unique optical properties and anisotropic surface energy upon the edge and thickness of the gold nanoplates.Reference Huang, Ferhan, Gao, Dandapat and Kim13,Reference Ah, Yun, Park, Kim, Ha and Yun14 Great progress has been devoted to the synthesis of gold nanoplates and their applied research. There arises a variety of synthetic routes to fabricate different types of gold nanoplates controllably. For example, Cai et al. reported the mass synthesis of gold nanosheets via ethylene glycol reduction.Reference Li, Cai, Cao, Sun, Li, Kan and Zhang15 Kuo and co-workers proposed the formation of gold nanoplates using alkylated polyethyleneimines as reducing agents.Reference Chen, Hsu and Kuo16 Stellacci’s group synthesized micrometer-sized gold plates by a slow reduction method using solvent dodecylamine.Reference Liu, Wu, Wunsch, Barsotti and Stellacci17 These synthetic methods usually require the use of organic solvents, which is not environmentally friendly and time-consuming.
Generally, triangular gold nanoplates with single crystal structure can be easily synthesized by the wet chemical synthesis method in aqueous solution.Reference Huang, Chen and Huang18,Reference Chu, Kuo and Huang19 The triangular gold nanoplates are face-centered cubic crystal structures; the triangular plane represents the {111} facet, the three sides of the triangular plate are exposed to {100} or {110} crystal facets.Reference Grzelczak, Perez-Juste, Mulvaney and Liz-Marzan20 For these triangular gold nanoplates, their side lengths are between 70 nm and 5 µm and the thicknesses are around 5–50 nm. The aspect ratio is important for assessing the anisotropy degree of the nanostructures.Reference Sau and Rogach21 Unlike isotropic nanostructures, two-dimension triangular gold nanoplates have three sharp corners and edges, and large surface areas which could significantly affect their optical and electrical properties.Reference Yang, Li, Lu, He, Zhu, Ma, He, Gao, Ni and Yi22,Reference Cui, Zhang, Wang, Barayavuga, He, Mei, Wang, Jiang and Wang23
By controlling the length, thickness, and sharpness of the triangular nanostructure, the localized surface plasmon resonance (LSPR) of the triangular gold nanoplates can be tuned in a wide range from the visible to near-infrared region. Accordingly, the surface-enhanced Raman scattering (SERS) effect, which originates from the LSPR properties of the noble metal nanostructure, can be applied in the related field like ultrasensitive molecule detection.Reference Chen, Xu, Li, Xue, Han, Ou, Li and Ni24 Therefore, reliable synthetic methods and rational reaction parameters for controlling the structure during the growth process is important to acquire the anisotropic gold nanoplates.Reference Ruditskiy and Xia3–Reference Liu and Tang5 Consequently, the anisotropic gold nanoplates can serve as highly active SERS probes to be applied in the analytical technique.
Here, we present a gentle hydrothermal method for the fabrication of gold nanoplates in the presence of a structure-directing agent cetyltrimethylammonium chloride (CTAC). The morphologies and sizes of gold nanoplates can be regulated by adjusting the molar ratio of the surfactant (CTAC) to the gold precursor (HAuCl4). The LSPR peaks of various categories of gold nanoplates can be continually tuned from 561 to 664 nm along with the increase of the size from nanometer to micrometer scales. Moreover, the formation mechanism of nanoplates and the vital role of surfactant CTAC in the gold nanoplates growth process have been analyzed and investigated in detail. Based on the LSPR properties of gold nanoplates and their derivatives, the electronic enhancement and SERS performance of gold nanoplates are explained based on the finite element method (FEM) calculation and confirmed by 4-mercaptobenzoic acid (4-MBA) molecules adsorption.
II. EXPERIMENTAL METHODS
A. Materials
Hydrogen tetrachloroaurate(III) trihydrate (HAuCl4·3H2O) and CTAC were purchased from Sigma Aldrich, St. Louis, Missouri. Trisodium citrate (Na3C6H5O7·2H2O) was obtained from Aladdin Chemistry Co. Ltd., Shanghai, China. 4-mercaptobenzoic acid (4-MBA) was acquired from J&K Chemical Corporation, Beijing, China. All chemical agents were of analytical grade and used as received. Milli-Q water with a resistivity of 18.2 MΩ cm was used for all solution preparations. All glassware were cleaned by using aqua regia (volume ratio of HCl and HNO3 is 3:1) and then washed with abundant deionized (DI) water for several times before the experiments.
B. Synthesis of gold nanoplates
Gold nanoplates were synthesized by a modified hydrothermal method.Reference Liu, Zhou, Yuan, Jiang, Petti, Zhou and Mormile25 Different categories of gold nanoplates were prepared by varying the molar ratios of [CTAC]/[HAuCl4] in the reaction solutions. The effective concentrations of CTAC in the aqueous solutions were in the range of 4.0–0.5 mM while the amount of the chloroauric acid remained unchanged. Thus, the molar ratios of [CTAC]/[HAuCl4] ranged from 20 to 2.5.
Briefly, 20 mL aqueous solutions of different concentrations of CTAC, namely 4.0, 3.5, 3.0, 2.5, 2.0, 1.5, 1.0, and 0.5 mM, were mixed with 400 μL of HAuCl4 (10 mM) and 100 μL of aqueous solution of trisodium citrate (100 mM), and then added into 30 mL Teflon lined stainless steel autoclaves. The autoclave was sealed after the oven reached 110 °C and the solution was reacted for 12 h at 110 °C. After that, the autoclave was naturally cooled down to ambient temperature. The obtained gold colloidal dispersions were centrifuged at 11,000 rpm for 20 min and then washed and redispersed with DI water for three times to remove excess CTAC molecules. The gold nanoplate colloids were redispersed in 5 mL DI water.
C. Synthesis of 4-MBA tagged gold nanoplates
The SERS performance of the gold nanoplates was evaluated by the Raman molecule 4-MBA. First, 20 μL aqueous solutions of 4-MBA (1 mM) were added to the as-prepared 5 mL colloidal gold sample solutions and then mixed and stirred for 5 h. Next, the mixture solutions were centrifuged at 8000 rpm for 10 min to remove the untagged 4-MBA molecules. The 4-MBA tagged gold nanoplates were obtained at the bottom of the centrifuge tube. Finally, 4-MBA tagged gold nanoplates were redispersed in 5 mL DI water for subsequent measurement of the Raman spectrum.
D. Characterization
The optical absorption spectra were collected with a Perkin-Elmer Lambda 35 UV-vis-NIR spectrometer (Perkin Elmer, Waltham, Massachusetts). The scanning electron microscopy (SEM) images were recorded by using an FEI Quanta 450 FESEM instrument (FEI, Hillsboro, Oregon) at 5 kV accelerating voltage. The SERS characteristics of the gold nanoplate samples were examined using a Perkin-Elmer Raman 400F spectrometer (Perkin Elmer, Waltham, Massachusetts) with a 785-nm semiconductor incident laser. All the analyses were performed at room temperature.
III. RESULTS AND DISCUSSION
A. Characterization of the gold nanoplates
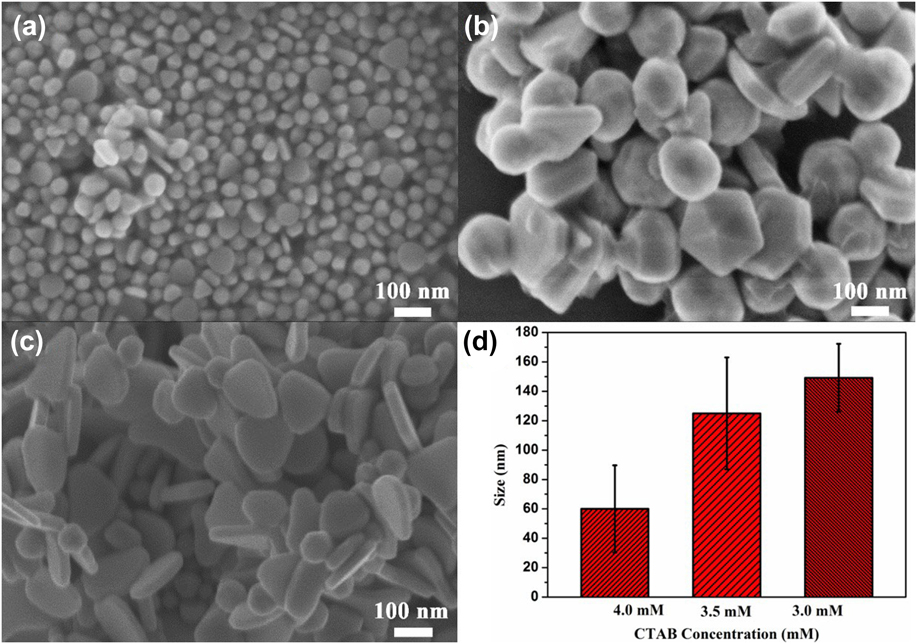
The SEM images in Fig. 1 show that the gold nanostructures were mainly triangular, truncated triangular and hexagonal structures with different edge widths and thicknesses. When decreasing the concentration of CTAC from 4.0 mM to 3.0 mM ([CTAC]/[HAuCl4] = 20–15), small nanoplates can be obtained with the average edge length from 60 nm, 125 nm, and 149 nm, respectively. The SEM image in Fig. 1(a) indicates that the synthesized products with 4.0 mM CTAC were mainly composed of nanoplates with a mean edge length of 60 ± 5 nm, which accompanied with a few pseudo-spherical and higher order polyhedron nanoparticles byproducts. The SEM images in Figs. 1(b) and 1(c) clearly show that the nanoplate edge lengths increased to a hundred nanometer when the CTAC concentration decreased to 3.0 mM. Figure 1(d) gives the edge length distribution histograms of small gold nanoplates obtained at higher molar ratios of [CTAC]/[HAuCl4]. When decreasing the molar ratio of [CTAC]/[HAuCl4] (12.5–7.5) and the CTAC concentration from 2.5 to 1.5 mM, the edge width of the obtained gold nanoplates can increase to hundreds of nanometers as shown in Fig. 2. The average edge lengths of the nanoplates are 261 nm, 500 nm, and 590 nm, respectively. The morphology of the gold nanoplates is truncated triangular nanoplates as shown in Figs. 2(a)–2(c). The triangular and truncated triangular nanoparticles both have triangle vertex angles of 60°. And a broader size distribution of these larger nanoplates is displayed in Fig. 2(d). The as-synthesized gold nanoplates have a higher percentage, but there is still a small number of decahedron and tetrahedral nanoparticles.
SEM images of gold nanoplates synthesized with different CTAC concentrations (a) 4.0 mM, (b) 3.5 mM, and (c) 3.0 mM; (d) edge size distribution histogram.

SEM images of gold nanoplates synthesized with different CTAC concentrations (a) 2.5 mM, (b) 2.0 mM, and (c) 1.5 mM; (d) edge size distribution histogram.
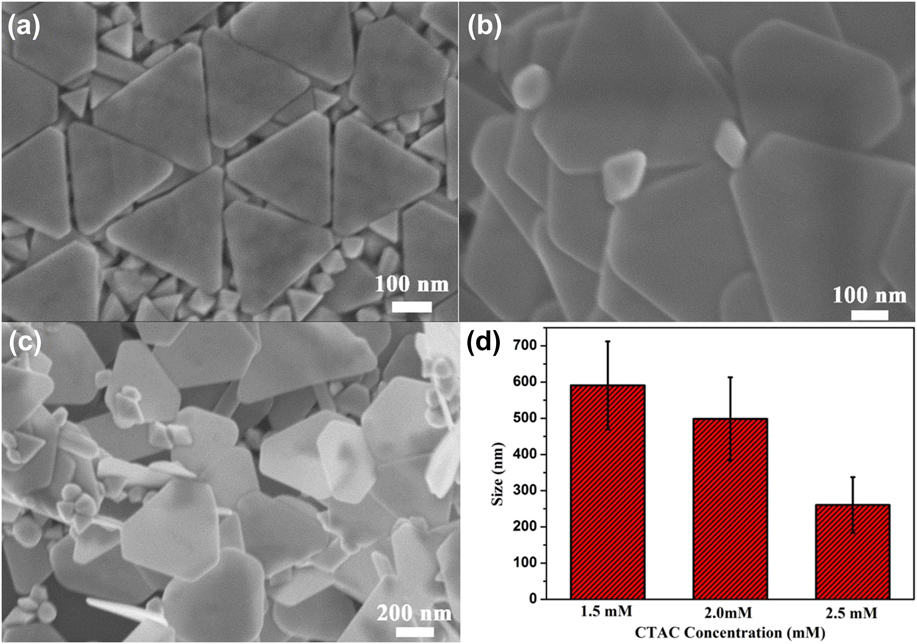
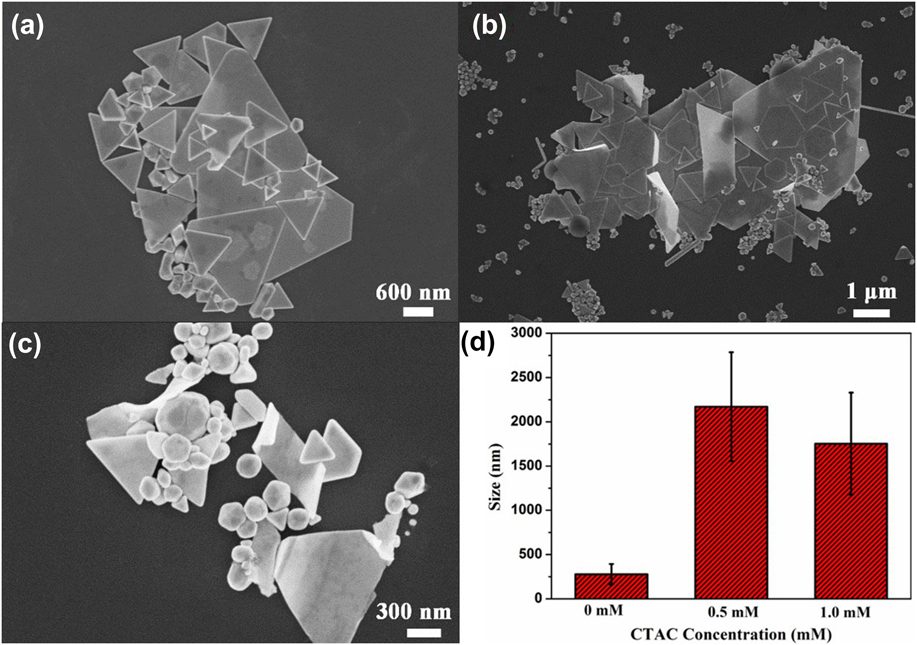
When the concentration of CTAC was further reduced from 1.0 to 0.5 mM ([CTAC]/[HAuCl4] = 5–2.5), the edge width of the gold nanoplate increased to a few microns which can be seen in Figs. 3(a) and 3(b). The edge widths of these large nanoplates are 1.7 μm and 2.1 μm, respectively. It can be observed that the obtained micron triangular plates and their derivatives have sharper edges than the smaller nanoplates. Without the presence of the surfactant CTAC, there exist few micron size triangle plates (∼2.3 μm) with some isotropic spherical nanoparticles and multiply twinned decahedron particlesReference Liu, Wu, Wunsch, Barsotti and Stellacci17 (∼280 nm) as shown in Fig. 3(c). The relative distributions of the three types of gold nanoplates have a correspondingly wider size range as shown in Fig. 3(d). It should be noticed that the thickness of these nanoplates are thinner when the edge length of these triangular or hexagonal gold nanoplates increases. The thickness of the nanoplate is decreased from tens of nanometers to several nanometers at the nanoscale. The gold nanoplates became more tabular two-dimension structures with decreasing the CTAC concentration. Furthermore, the SEM images show that the small degree gold nanoplates with obtuse and truncated corner and edges while the large degree nanoplates exhibited sharp corner and edges during the synthesis process. Besides, it is a bit difficult to obtain 100% triangle-shaped gold nanoplates.Reference Ha, Kim and Park26,Reference James, O’Toole, Patel, Zhang, Gobin and Keynton27 The gold nanoplates are triangular nanoplates co-mixed with truncated triangular and hexagonal nanoplates.
SEM images of gold nanoplates synthesized with different CTAC concentrations (a) 1.0 mM, (b) 0.5 mM, and (c) without CTAC; (d) edge size distribution histogram.

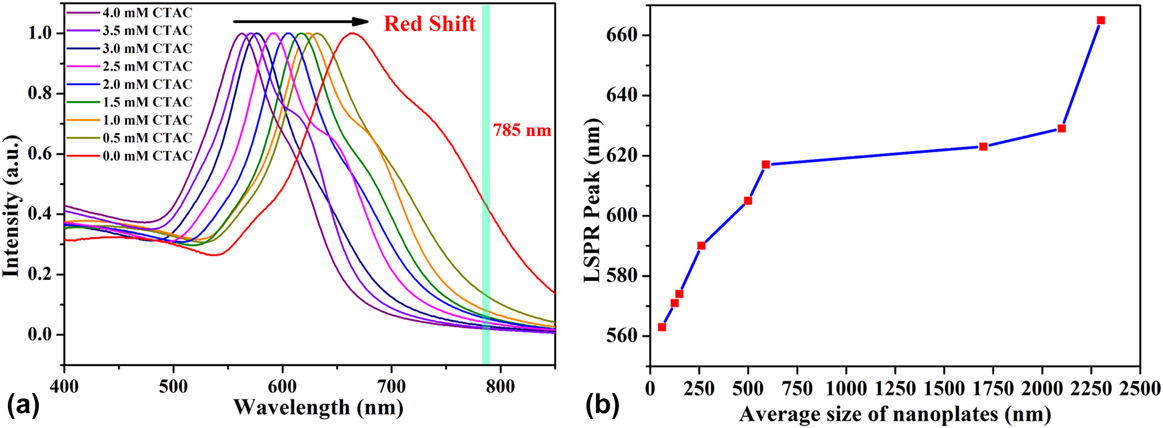
The gold nanoplates have strong size and shape-dependent plasmonic properties. The optical absorption spectrum of different categories of gold nanoplates with decreasing the CTAC concentration is illustrated in Fig. 4(a). It can be observed from the UV-Vis spectrum that the LSPR peaks of the gold nanoplates red-shift from 561 to 664 nm with decreasing surfactant CTAC. That is, the LSPR bands move closer to the near-infrared region when the edge widths of gold nanoplates increase from nanometer to micrometer scales. It can be seen in Fig. 4(a) that some absorption curves display weak shoulders along with their main LSPR bands, such as the curves at the concentration of CTAC with 3.5, 2.5, and 1.0 mM because of the co-existence of the polyhedron nanoparticles. Besides, the wider size distribution of nanoplates can cause the main LSPR peak to broaden while the narrower size distribution of nanoplates can still exhibit a relatively sharper main LSPR peak. However, the LSPR band further red-shifts to 664 nm with broadened peak and the obvious shoulder around 750 nm when there is no CTAC during the growth. This change could be attributed to several large microsize nanoplates and the small disorder irregular nanoparticles shown in Fig. 3(c). The relationship between the average size of gold nanoplates and LSPR peak can be seen in Fig. 4(b), which has proved the structure-dependent LSPR properties of gold nanoplates.
UV-vis absorption spectra of gold nanoplate colloidal dispersions with different CTAC concentrations (a) and the positions of LSPR peaks to the average size of gold nanoplates (b).

B. Crystal growth mechanism of the gold nanoplates
Hydrothermal treatment at 110 °C provides a favorable environment for trisodium citrate to promote the reduction of the gold precursor (Au III) to a gold atom (Au0) during the growth process of the gold nanoplates. Then the gold atoms can form small gold nuclei for the anisotropic growth at different crystallographic facets. The final triangular shape of the nanocrystals is determined by the relative growth rates of specific facets by the structure-directing agents such as a surfactant.Reference Personick and Mirkin28 Therefore, the surfactant CTAC is important to control the formation of the triangular nanoplates during the synthesis process. Usually, the CTAC molecule was electrostatically adsorbed on the surface of the initial gold cluster and formed a bilayer structure micelle. The chlorine anions (Cl−) can influence the morphology control of the anisotropic nanostructure.Reference Rai, Singh, Ahmad and Sastry29 First, the chloride anion (Cl−) of CTAC adsorbed on the surface of the gold nuclei to preserve electroneutrality condition and further provides an anchoring point for the positive charge trimethylammonium head group (CTA+) by attractive interaction force. Then another layer of CTAC molecules confronts the solvent medium to keep the water solubility.Reference James, O’Toole, Patel, Zhang, Gobin and Keynton27 Consequently, the resulting CTAC micelle bilayer can be capped the gold nuclei and then preferentially adsorbs on a specific crystallographic facet.Reference Wuithschick, Birnbaum, Witte, Sztucki, Vainio, Pinna, Rademann, Emmerling, Kraehnert and Polte30 Furthermore, the number of the formed nuclei in solution will depend on the CTAC concentration during the nucleation process. The high CTAC concentration results in the formation of many small gold nuclei. Considering that the remaining gold ions are limited for many small gold nuclei to reduce to gold nanocrystals. Naturally, the initial nuclei could be grown into small size gold nanoplates, while the low CTAC concentration leads to not so many nuclei can be formed at a time. It enhances the possibility for the nanoplates to grow slowly to micrometer size.Reference Chu, Kuo and Huang19,Reference Grzelczak, Perez-Juste, Mulvaney and Liz-Marzan20,Reference Personick and Mirkin28 As is shown in Fig. 3(c), when the CTAC molecules were not in the reaction solution, there would be no chloride ion adsorbed on the surface of gold nuclei to help form the double layer of CTAC micelles. Thus, only a tiny amount of large triangular nanoplates and irregularly shaped nanoparticles produced. When CTAC was added to the reaction system, the yield of triangular nanoplates would be increased.
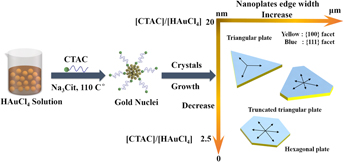
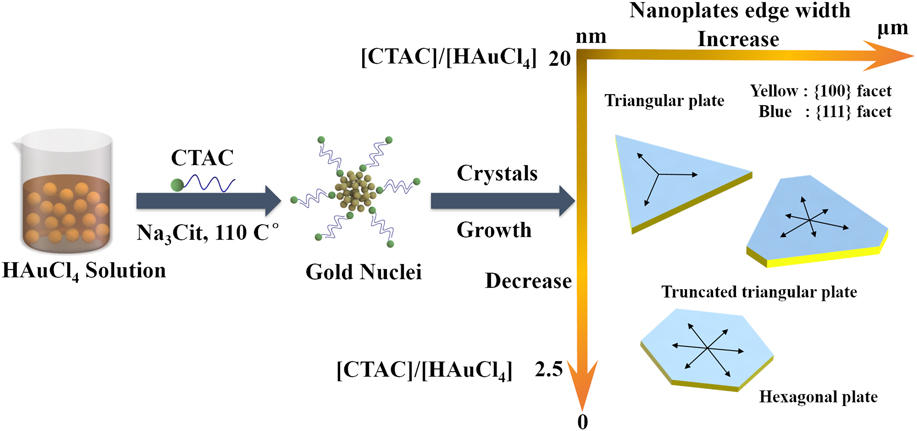
Based on the electron microscopic and optical spectroscopic analysis, the different structure of gold nanoplates is strongly dependent on the molar ratio of surfactant (CTAC) to the gold precursor. The CTAC adsorbed on the specific crystal facet of the gold nuclei leads to preferential growth, which promotes the formation of the flaky triangular plate structure.Reference Chu, Kuo and Huang19 The schematic of the crystal growth mechanism for the gold nanoplates is illustrated in Fig. 5. The edge of the gold nanoplate is exposed to {110} facets and triangular planes of {111} facets. The blue color represents the planar surfaces of these gold nanoplates and corresponds to {111} facets, and the yellow color represents the lateral surfaces which correspond to {110} facets. As for the face-centred cubic (fcc) gold crystals, the surface energies of the low-index crystallographic facets are in the order of γ {111} < γ {100} < γ {110}.Reference Grzelczak, Perez-Juste, Mulvaney and Liz-Marzan20 The relative growth rates of nanocrystals are often kinetically controlled by different growth rates of the crystallographic facets.Reference Personick and Mirkin28 The selective adsorption of CTAC molecules on the {111} facets was responsible for the formation of hexagonal and triangular plates with {111} tabular planes. The {111} facets of gold nuclei have the lowest surface energy to inhibit the energies of {111} facets so that the addition of gold atoms to this surface is blocked and slows {111} plane growth and exposed the {111} facets and the growth is restricted on a planar direction.Reference Sau and Rogach21 With a different molar ratio of [CTAC]/[HAuCl4], the growth will take place on the basal plane {111} facets and the side {110} facets roughly at different rates.Reference Liu and Yang31 Thus, small gold nuclei eventually exposed the {111} facets as the surface face and evolve into nanoplate structures during the hydrothermal growth process.Reference Liu, Shen and Li32
Crystal growth mechanisms and formation schematic of gold nanoplate synthesis via a hydrothermal process.
In addition, the reducing agent trisodium citrate exhibits structure-guiding effect during structure evolution. Trisodium citrate can promote nanocrystal growth along the [111] direction which is also in favor of the formation of nanoplates.Reference Ji, Song, Li, Bai, Yang and Peng33 The initial amount of HAuCl4 is constant. The relative molar ratio of [CTAC]/[HAuCl4] can be modulated through adjusting the CTAC concentration and control the relative growth rates of different crystallographic facets and facilitate the gold atom to grow on the specific crystal surface. Subsequently, the triangular plane structure with edge width varying from the nanoscale to micron can be formed by controlling the relative growth rates along [111] directions.Reference Chen, Xu, Li, Xue, Han, Ou, Li and Ni24 Furthermore, the selective adsorption of CTAC molecules also induces the minimization of the energy of the lateral surface {100} facets of the nanoplates. Consequently, the change of CTAC concentration would let the side of the nanoplate growth with different thicknesses. The as-synthesized gold nanoplates are usually triangular or hexagonal shape with different sharpness and truncations which can be observed in the SEM images. As for the shape involution of different category nanoplates during the synthesis process is because the local reaction fluctuations of the hydrothermal growth environment, which the nanocrystal will not proceed uniform growth along 〈110〉 directions and will have some degree deviations. As a result, the triangular and truncated triangular and hexagonal shaped gold nanoplate mixtures can be obtained due to the nonuniform growth of gold atoms on the nuclei along 〈110〉 directions.Reference Kaur and Chudasama34 The above-detailed growth mechanism revealed that the relative molar ratio of reaction reagents is essential to control and optimize the crystal growth of various gold nanostructures.
C. SERS performance of the gold nanoplates
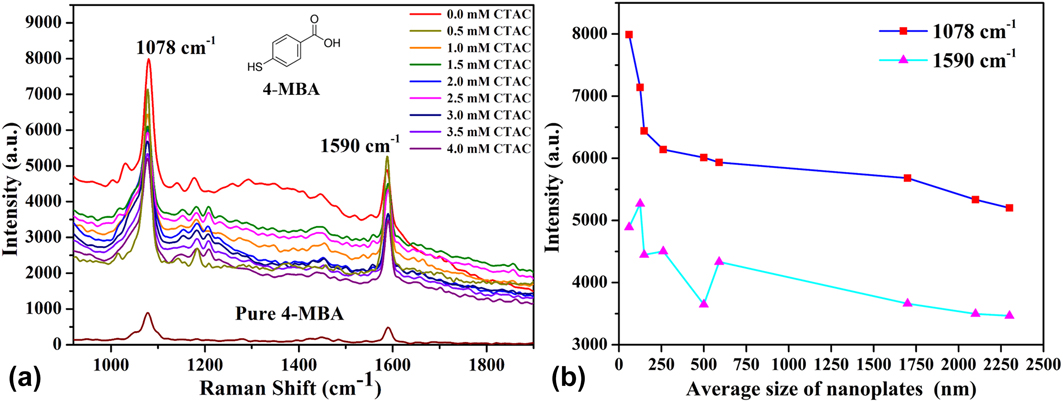
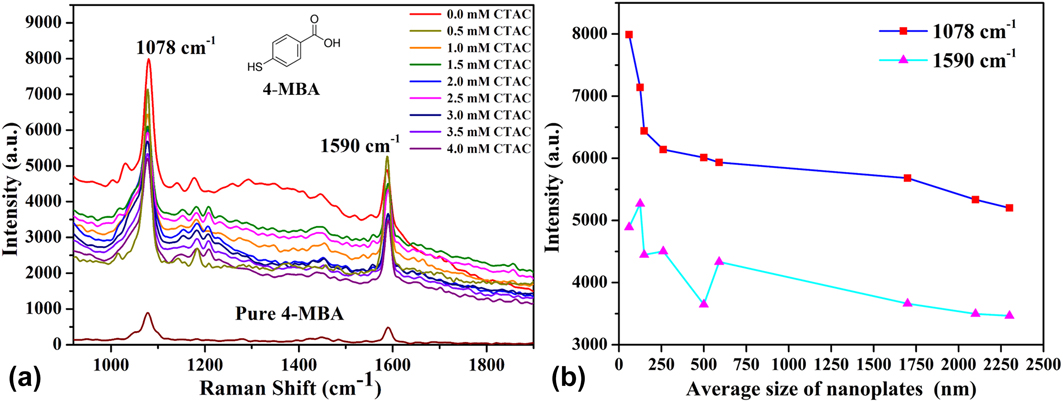
The structure-dependent LSPR characteristics of the as-prepared gold nanoplate which have planar surfaces and multi-edges were further investigated by Raman spectroscopy for studying their SERS activities. In our experiments, the SERS performance of the as-synthesized triangular gold nanoplates and derivatives was evaluated by measuring Raman active molecular 4-MBA. The Raman spectra of 4-MBA tagged nanoplates were conducted under a 785-nm wavelength. The Raman scattering of 4-MBA is arising from the molecule polarizability caused by the enhancement of the local electric field around the gold nanoplates. The Raman spectrum is molecular vibration spectrum, so the characteristic fingerprint peaks of 4-MBA molecules are located at ∼1078 and 1590 cm−1, which can be attributed to the benzene ring breathing vibration mode ν(C–C) as shown in Fig. 6(a). The benzene ring-breathing modes usually have the strongest Raman intensity in the Raman-based molecular vibration spectra.Reference Michota and Bukowska35 Besides, the other Raman bands of the 4-MBA, which are labeled with gold nanoplates in Fig. 6(a), such as 1152 and 1177 cm−1, which are derived from the bending mode of the benzene ring (ν(C–H)) and a stretching mode at 1430 cm−1  $\left( {\nu {{\rm{s}}_{\left( {{\rm{CO}}{{\rm{O}}^ - }} \right)}}} \right)$ can also be enhanced by the gold nanoplates which is barely not seen in the spectrum of the pure 4-MBA. The 4-MBA molecules are adsorbed on the surfaces of gold nanoplates through the S–Au bond, and the carboxyl group (COO−) is far away from the surface of gold nanoplates, so the stretching mode at 1430 cm−1
 $\left( {\nu {{\rm{s}}_{\left( {{\rm{CO}}{{\rm{O}}^ - }} \right)}}} \right)$ is less enhanced. Moreover, there is a certain angle between the plane of the benzene ring and the surface of gold nanoplates, so the intensity of the bending mode (ν(C–H)) on the benzene ring at 1152 and 1177 cm−1 is also relatively low. For more detailed illustration, the relationship between the average size of the gold nanoplates and the 1078 and 1590 cm−1 peak intensity of the 4-MBA of gold nanoplates, respectively, are shown in Fig. 6(b). From the Raman spectra of these colloidal solutions, the intensity of SERS signal of the 1078 cm−1 peak gradually increased as the size of gold nanoplates decreased.Reference Ho and Lee36 However, the Raman intensity of the 1590 cm−1 peak is not completely in line with this tendency. The 4-MBA tagged gold nanoplates without the surfactant CTAC have the most active SERS signal comparing with the gold nanoplates which synthesized with different CTAC concentrations.
Raman spectra of gold nanoplates with different concentrations of CTAC (a) and (b) the relationship between the characteristic Raman peaks of 1078 cm−1 and 1590 cm−1 to the average size of gold nanoplates, respectively.
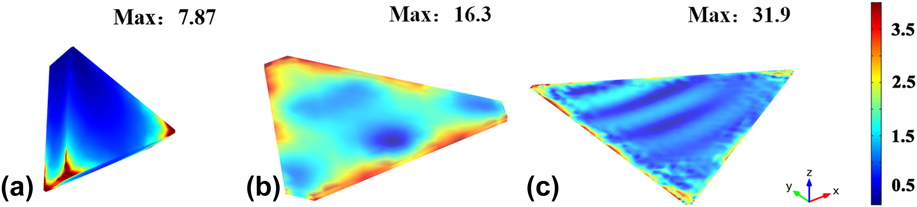
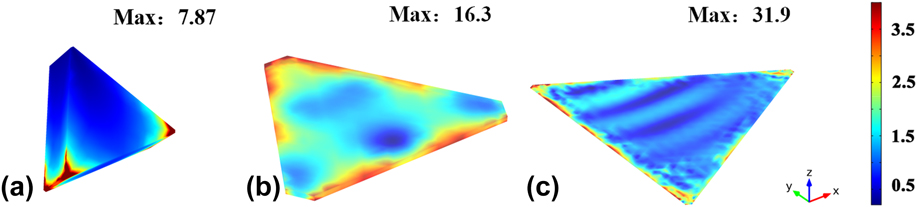
In general, the SERS enhancement mechanisms can be given credit to be the chemical enhancement and the electromagnetic enhancement. The latter one plays a major role, which arises from local enhanced fields due to surface plasmon resonance of the electromagnetic field.Reference Ding, Yi, Li, Ren, Wu, Panneerselvam and Tian37 To illustrate the SERS performance by the strong electromagnetic enhancement properties of gold nanoplates, the local electric field intensity distributions around the gold nanoplates are calculated and simulated with FEM software (COMSOL Multiphysics 4.3, COMSOL, Inc., Stockholm, Sweden) under irradiation of 785 nm-wavelength incident light.Reference Cui, Yang and Wang38 In our calculations, the dimensions of the gold nanoplate models were extracted from the SEM images. Three typical models of the triangular gold nanoplates with different edge length and thickness (60 nm × 23 nm, 500 nm × 14 nm, and 1.7 µm × 5 nm) nanostructures were constructed to simulate their electric field distributions by FEM calculation (Johnson 1972).Reference Johnson, Johnson and Christy39 The incident plane-wave propagated along the vertical direction (y) and polarized along the horizontal direction (x) at 785 nm wavelength. The distribution of enhanced electric field on the gold nanoplates is not homogeneous around the whole surface of the nanoplate structures but rather appearing around edges and corner of the gold nanoplates as shown in Fig. 7. The maximum enhanced electric field intensity of the gold nanoplates with different edge lengths and thicknesses are 7.87, 16.3, and 31.9, respectively. Compared with the three maximum values of the enhanced electric field intensity of these gold nanoplates, the larger micro-size of the gold nanoplate exhibits stronger electric field enhancement under 785-nm wavelength excitation light. The enhancement factor of the electric field is the biquadratic of the simulated electric field intensity and the theoretical SERS enhancement factors are proportional to |E|4 under certain approximations. Correspondingly, the electric enhancement values |E|4 with different sizes of gold nanoplates are 3836.2, 4330.7, and 1035.5, respectively.Reference Álvarez-Puebla40,Reference Zhang, Large and Wang41 Hence, the enhanced electric field intensity calculated by FEM is consistent with experimental Raman enhancement results. The simulation results could explain that why gold nanoplates without the surfactant CTAC have the strongest active SERS enhancement. That is because of the electric field enhancement caused by the plasmon resonance coupling of the gold nanoplates. As shown in the UV-vis absorption spectra of gold nanoplates in the Fig. 4(a) which pointed with a green line, the gold nanoplates without CTAC have the characteristic LSPR peak around 664 nm still have certain extent absorption intensity at the 785-nm incident radiation. While the rest of gold nanoplates, which LSPR bands are away from the wavelength of the laser, basically have weak absorption intensity at 785 nm and have off-resonance electric field enhancement.Reference Álvarez-Puebla40 Therefore, the difference intensity between SERS enhancement of these gold nanoplates could be due to the coupling effect between the LSPR band and the excitation wavelength in our experiments. The experimental Raman enhancement trend was consistent with the LSPR shift in the adsorption spectra which demonstrates that SERS enhancement rely on the LSPR properties of the gold nanoplates.
FEM simulation of the electric field enhancement maps of gold nanoplates with different edge lengths and thicknesses (a) 60 × 23 nm, (b) 500 × 14 nm, and (c) 1.7 µm × 5 nm, the incident plane-wave propagated along the vertical direction and polarized along the horizontal direction.
Furthermore, the SERS enhancement increases when the nanoplate’s thickness is decreased from dozens of nanometers to several nanometers at the nanoscale nanoplate. That is, the thickness of these nanoplates was getting thinner while the edge length of these triangular or hexagonal gold nanoplates was increasing to the micrometer. The electric enhancements typically distribute near the sharp and thin edges of gold nanoplates upon laser excitation due to the accumulation of electric charges in large curvatures of the nanostructures.Reference Zhang, Large and Wang41 Consequently, the 4-MBA molecules that are adsorbed on these regions should be more enhanced than those that are adsorbed on the flat faces. When decreasing the concentration of CTAC, the larger degree nanoplates displayed sharp and thin edges, which can result in stronger Raman intensity. Overall, the LSPR properties of gold nanoplates closer to the Raman laser play the dominant role in the determining the SERS enhancement in our work. Moreover, the sharper and thinner edges upon the larger gold nanoplates may also be a contribution to the SERS enhancement.
IV. CONCLUSION
The gold nanoplates were successfully synthesized via the hydrothermal method. The preparation of various sizes of gold nanoplates was generally carried out by controlling the ratio of gold precursors to surfactant CTAC. The CTAC plays an important role in controlling the growth of gold nanoplates. And chloride ions and sodium citrate in the reaction also act a guiding role in the formation of the planar nanoplate. Then, the LSPR characteristics and SERS performance of gold nanoplates under different CTAC concentrations were studied by the adsorption spectra, FEM simulation, and 4-MBA molecular tagged Raman spectroscopy. The results show that their LSPR and SERS properties are strongly dependent on the structure of gold nanoplates. Therefore, the controllable synthesis of gold nanoplates can provide an effective way to design and adjust their geometry-dependent optical properties for the potential application.
ACKNOWLEDGMENTS
This work is partially supported by Key Laboratory of Microsystems and Micro-Structures Manufacturing of Ministry of Education, Harbin Institute of Technology (2017KM012), and Shenzhen Basic Research Project (JCYJ20170413140519030).