


Introduction
Snow surface temperature (Ts) plays an important role in the formation of surface hoar or near-surface faceted crystals. As shown by Reference HollerHoller (1998), a very simple condition for surface-hoar growth is given if Ts falls below the dew point. More detailed information can be obtained by calculating the difference of water-vapor pressure (ΔP) between air and snow surface; for example, Reference Hachikubo and AkitayaHachikubo and Akitaya (1997) used AP to calculate the water-vapor flux (condensation rates). Reference GublerGubler (1998) developed an empirical formula to estimate the onset of surface hoar and used Tair and Ts. Reference Birkeland, Johnson and SchmidtBirkeland and others (1998) calculated the vapor-pressure gradient in the uppermost layer of the snowpack; they found values exceeding –25 h Pam–1 during the night, and these extreme vapor-pressure gradients led to the formation of near-surface faceted crystals.
However, data on snow surface temperature are necessary for the different calculations, both for open sites and for different locations of forest stands. Results on measured snow-temperature profiles in forest stands can be found in Reference Gubler and RychetnikGubler and Rychetnik (1991), but they did not measure snow surface temperature. Thus the main objective of the study was to measure Ts at different forest sites in order to find out how the forest (with different crown closures) influences Ts during night-time. The second objective was to develop a simple formula that makes it possible to calculate Ts using air temperature (Tair) only.
Study Area and Methods of Measurements
Two different experimental sites were selected in the western part of the Tyrol, Austria. Site A was about 35 km from Innsbruck (in the Stubai valley) in and beside a larch stand (larix decidua) near the timberline at about 1900 m a.s.l. (47°7’30” N, 11°17’50“E); larch trees grow up to >2000 ma.s.l. (timberline) and are the only conifer species that lose their needles in winter. Three different measuring zones (open field (Al), clearing (A2) and forest (A3)) were selected. Al was outside the forest on a south-southeast-facing slope (inclination 30°) and not influenced by the forest canopy; A2 was a clearing (aspect: south-southeast; slope angle 25°) with a diameter of approximately 7 m × 7 m (about 20% of the sky was covered by trees); A3 was in the forest (same aspect and slope angle as Al) with touching crowns.
Site B was in the Kühtai in a stone pine stand (pimus cembra) at about 1950 ma.s.l. (47°12’38“N, 11°05’18“E); stone pine trees can be seen especially in the central part of the Alps, and grow up to more than 2200 m a.s.l. Three different measuring zones were selected. Bl was in a great clearing (diameter: 15 m × 15 m) on a north-facing slope (inclination 30°); B2 was a smaller clearing (same aspect and slope angle as Bl) with a diameter of approximately 10 m × 15 m; B3 was in the forest (aspect: north; slope angle 25°) with touching crowns (about 75% of the sky was covered by the forest canopy). The crown closure of all measuring positions was recorded with an 8 mm fish-eye lens (Fig. 1). To estimate the canopy density (a; in Equations (2), (3) and (6)) for the different locations a so-called Horizontoscope was used. This simple device consists of a glass dome with a compass needle and a bubble level. If a sun chart is mounted on the lower side of the Horizontoscope, the canopy density can be estimated by tracing the line which is reflected by all obstacles (e.g. trees) at the site; these readings were taken in February 1999.
Crown closure of the different measuring locations, (a) A2: clearing in the larch stand (x =0.2); (b) A3: larch stand (x = 0.6); (c) Bl: great clearing in the stone pine forest (x =0.1); (d) B2: small clearing in the stone pine forest (x =0.3); (e) B3: stone pine forest {x= 0.75).

The measurements included air temperature (2 m), humidity and temperature at 0.1 m above snow surface at Al. Snow surface temperature and net radiation (incoming minus outgoing) were measured in all three zones of site A; separate measurements of incoming and outgoing longwave radiation were also performed at Al and A3.
At site B the temperature at 0.1 m above snow surface and the snow surface temperature was measured in all three zones. Values of air temperature (2 m), humidity and net radiation were taken from the meteorological observation site Langental (altitude 1920 m; aspect: northwest; inclination 15°) which is approximately 250 m from site B.
Temperature measurements (snow surface and 0.1 m above snow surface) were performed with platinum-resistance sensors. The sensors for measuring Ts were placed directly on the snow surface, which was possible during the night because shortwave radiation did not have to be considered (infrared thermometers would have been a good alternative, but they could not be used in this study because of their high cost). Air-temperature and humidity sensors (VAISALA) were placed within a radiation shield. Net radiation (Al, A2 and A3) was measured with three net radiometers (SCHENK). Incoming and outgoing longwave radiation (Al and A3) was measured with two Pyrradiometers (SCHENK).
Results
The measurements were performed on clear nights injanuary 1999, with some additional data from previous years. The results of the air-temperature measurements were as expected: higher values at site A, lower values at site B (Fig. 2). This can be explained by the different locations of the two experimental sites. While site B (stone pine stand) is near to a north-facing plateau where the cold air flows down and forms an inversion layer, site A (larch stand) was on a south-facing slope with more solar absorption.
Air temperature (at 2 m) at site A (larch stand on a south facing slope) and site B (stone pine forest on a north-facing slope), 15–24 January 1999.

Investigations by Reference Aulitzky and TurnerAulitzky and Turner (1982) showed that forest stands in the subalpine region do not have much influence on the air temperature, on either the south- or north-facing slope; the air temperature was almost the same in all zones (open field, forest, opening). These results correspond with data from Reference HollerHoller (1998). Even at 0.1 m above the snow surface the temperatures were similar at all measuring positions (Fig. 3).
Temperature at 0.1m above snow surface (a) and snow surface temperature (b) at different measuring locations at site B, 15–24 January 1999.

However, a strong temperature gradient was found between the measuring levels 2 and 0.1 m above the snow surface. During clear nights the air temperature at 2 m was 2.6°C higher (average) than at 0.1 m above the snow surface. While the temperature at 0.1 m on the north-facing slope (site B) was lower during day and night (Fig. 4), a change in temperature was found on the south-facing slope (site A), giving higher values at 0.1 m during daytime (due to higher values of shortwave radiation on the south-facing slope).
Temperature at 2 and 0.1m above the snow surface in the open field of site A (larch stand on a south facing slope) (a) andsiteB (stonepineforestonanorthfacingshpe) (b).

As expected, the snow surface temperatures were strongly influenced by the forest canopy. Figure 3b shows the snow surface temperatures at site B (continuous time series, 15–24 January 1999). Ts is warmer in the forest than in the great clearing during day and night. Due to the location of site B (a north-facing plateau where cold air flows down and forms an inversion layer), the surface temperature of the great clearing (Bl) was low throughout the day and did not even reach the values of the forest (B3) during daytime. A strong increase of the snow surface temperature at Bl was observed only on 16 January 1999 (because of high air temperatures). At that time Ts at Bl was about the same as at B3.
However, during clear nights Ts showed significant differences between the forest and the open field. At site A (south-facing slope) the minimum difference was 3°C, and the maximum difference 4.5°C. At site B (north-facing slope) the corresponding values are 3° and 7°C.
As an example, the clear night of 21–22 January is described (Fig. 5). On the south-facing slope (site A) the following values were measured: open field (Al) –6.8° to –9.6°C; clearing (A2) –5.9° to –9.5°C; and forest (A3) –2.2° to –6.1 °C. At site B (north-facing slope) all the corresponding values were lower: great clearing (Bl) –15° to –17°C; clearing (B2) –12° to –13°C; and forest (B3) –8° to –9°C. Although the stone pine forest on the north-facing slope (site B) was much denser than the larch stand on the south-facing slope (site A), Ts was higher inside the low-density larch stand. Moreover, the snow surface temperature in the great clearing of site B (north) was significantly lower than in the open field of site A (south). It can be assumed that the snow surface temperatures on site B (small north-facing slope near to a plateau with a cold climate) are influenced by developing inversion layers which lead to low surface temperatures in all three zones.
Snow surface temperature at different measuring locations of site A (a) and site B (b), 21–22 January 1999.

Snow surface temperatures at site A (south) were relatively high at the beginning of the night and decreased later on, while the corresponding values at site B (north) remained more or less constant. This can be explained by the fact that on the south-facing slope the snow surface temperature increases during daytime (solar absorption), while at site B (north) Ts is not influenced by shortwave radiation.
Incoming and outgoing longwave radiation were measured at Al and A3 (Fig. 6). On the clear nights of 15–24January the incoming longwave radiation (I [) was 220–300 W m–2 in the open field (Al) and 260–315 W m–2 in the larch stand (A3); outgoing longwave radiation (I]) was 290–315 W m–2 at Al and 300–320 W m–2 at A3. While the outgoing longwave radiation in the open field is only 6–11 W m–2 lower than in the forest, the incoming longwave radiation in the forest is significantly higher (about 17–50 W m–2) than in the open field. This can be explained by the additional longwave radiation of the trees. Consequently the net radiation in the forest was always higher than in the open field (see below).
Incoming and outgoing longwave radiation (during clear nights) in the open field (a) and inside the forest (b) of site A, 15–24 January 1999.

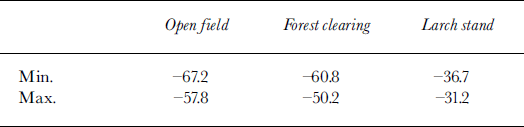
However, net radiation (/) during clear nights has only a small range of variation; net radiation measurements at site A showed that the difference between maximum and minimum values does not exceed 10 W m–2 (Table 1). As shown inTable 1 (data are calculated from 44 clear nights), the net radiation in the open field (Al) is very similar to / inside the clearing (A2), but the longwave balance in the forest (A3) was about 30 W m–2 higher than in the open field.
Minimum and maximum net radiation (W m–2) during clear nights for site A (data were calculated from 44 clear nights)
To calculate the incoming longwave radiation {If) the following equation was used (Reference OkeOke, 1987), which is valid for clear-sky and unforested conditions:

where a is the Stefan-Boltzmann constant (5.67 × 10⁻⁸ W m–2), T is the temperature in K and eair is the emissivity of air.
Reference Bader and WeilenmannBader and Weilenmann (1992) used the following equation to calculate / | inside the forest (clear sky above the forest):

where the first part is the incoming radiation of the atmosphere and the second part is the longwave radiation of the trees, x depends on the canopy density (e.g. x = 0 means no covering by the forest canopy). εtree is the emissivity of the trees; Ttree is the temperature of the needles in K. Following Reference Bader and WeilenmannBader and Weilenmann (1992), Ttree can be set to Ts (snow surface temperature) if trees are covered with snow, or it can otherwise be set to T (air temperature).
Using T instead of Ttree (there was no snow on the crowns during the January 1999 measurements), Equation (3) can be modified:

As the radiation balance (/) during the night includes only longwave parts, the following equation can be used to calculate the outgoing longwave radiation (I ↓):

and the outgoing radiation (I ↓) is given by the Stefan-Boltzmann law:

where Ts is the snow surface temperature and εs is the emissivity of snow. Combining Equations (3–5) and taking into account that εs is 1, Ts can be calculated:

Using Equation (6), Ts was calculated for all measurement positions, x was estimated by the measurements with the Horizontoscope (see above); the following values were obtained: Al: 0; A2: 0.2; A3: 0.6; Bl: 0.1; B2: 0.3; B3: 0.75.
The emissivity of air (εair) was calculated by the equation of Brunt. Taking into account that the average vapor pressure in the observation period was about 3 hPa (this value was calculated from humidity and air-temperature measurements at both experimental sites), εair can be set to 0.7. The emissivity of the leaves or needles (εtree) is 0.97–0.98 (Reference SellersSellers, 1965; Reference OkeOke, 1987). In accordance with Reference Gubler and RychetnikGubler and Rychetnik (1991), a value of 0.94 was used (because of a partial view to the clear sky).
Because the difference between maximum and minimum values of the net radiation was relatively small (10 W m–2), it should be possible to take averaged values of/. The following values were used for site A (calculated from the net radiation measurements; see Table 1): open field: –65 W m–2; clearing: –56 W m–2; forest: –34 W m–2. The values for site B were estimated from data of the observation site Langental and some additional measurements which were performed in January 2000 (I also took into account that the loss of heat at site B is less than at site A): great clearing: –45 W m–2; small clearing: –40 Wm–2; forest: –25 Wm-2.
Figures 7 and 8 show the measured and calculated values of some clear nights in January 1999 at sites A and B, respectively. The measured values at all sites regularly were less than the calculated values (by approximately 2–3°C). The correlation coefficient at site A was between 0.90 (forest) and 0.93 (clearing), and at site B between 0.73 (clearing) and 0.87 (forest).
Measured vs calculated values of snow surface temperature at different measuring locations of site A, 21–22 January 1999.

Measured vs calculated values of snow surface temperature at different measuring locations of site B, 19–22 January 1999.

To obtain a better correlation, however, the values of εair and εtree had to be reduced. To calculate εair, the formulations of Reference BrutsaertBrutsaert (1975), Reference SatterlundSatterlund (1979) and Reference IdsoIdso (1981) were used (with regard to the following data: air temperature –3°C; vapor pressure 3 hPa). The Idso formula gives an atmospheric emissivity of >0.7. The results of the Satterlund equation (suitable for temperatures of < 0°C) were relatively close to the values from Idso. Only the Brutsaert formulation shows emissivities of <0.7. Using 3 hPa for the vapor pressure, the atmospheric emissivity is 0.67.
The emissivity of the trees (£tree) was reduced in the same way. As published by Reference SellersSellers (1965), values of about 0.90–0.91 can be applied to pine forests. Although only site B was situated in a stone pine stand, the value of 0.91 was used at site A (larch stand) too, since larch trees lose their needles in winter, increasing the partial view to the clear sky.
Calculations with the reduced emissivity values (εair = 0.67 and £tree = 0.91) can be found in Figures 7 and 8 for sites A and B, respectively. These values come closer to the 1:1 line, while the correlation coefficients retain their positions. In any case it should be possible to improve the calculations by using lower values of £air and εtree.
Conclusion
The investigations showed that the snow surface temperatures were strongly influenced by the forest canopy. While the temperatures 0.1 m above the snow surface were similar at all measuring positions, Ts was significantly higher in the forest than in the open field.
During clear nights the snow surface temperature was about 3–4.5°C higher in the larch stand (A3) than in the open field (Al). Snow surface temperatures were 3–7°C higher in the stone pine forest (B3) than in the great clearing (Bl). The canopy of the dense forest (stone pine) prevents cooling of the snow surface (due to longwave radiation) more than does the larch stand.
However, the measured values of the snow surface temperature at site B (stone pine forest on the north-facing slope) were lower than at site A (larch stand on the south-facing slope), although the stone pine forest was much denser than the larch stand. This can be explained by the location of the two different sites. While site B is near to a plateau where cold air flows down and forms an inversion layer, site A was situated on a south-facing slope.
The surface temperatures at site A are relatively high at the beginning of the night, decreasing later on, while the corresponding values at site B (north) remain more or less constant. It can be assumed that on the south-facing slope the snow surface temperature increases during daytime (solar absorption), while at site B (north) Ts is not influenced by shortwave radiation.
A simple formula was developed to calculate the snow surface temperature using air temperature (Tair) and averaged values of/ (taking into account that the emissivity of air is 0.7 and the emissivity of the trees is 0.94). The calculations showed that the measured values were less than the calculated values (by about 2–3°C). To obtain a better correlation, the values of εair and £tree were reduced to 0.67 and 0.91, respectively. In that case the values come closer to the 1:1 line, so the calculations can be improved by using lower values of the emissivity.
Acknowledgements
I am grateful to A. Klebelsberg of the Tyrolean Hydro Power Company (TIWAG) for supplying the meteorological and nivological data from the observation site in the Kühtai.



