I. INTRODUCTION
It is known that the physical and chemical properties of thin films are strongly dependent on the morphology, i.e., the size and shape of microstructural features.Reference Karr, Petrov, Cahill and Greene1 Thin films grown by physical vapor deposition exhibit several morphologies due to self-assembly or kinetically driven surface structures. Under nonequilibrium growth conditions, anisotropic surface diffusion and kinetic roughening have been shown to lead to surfaces with asymmetric shapes, where thermodynamics and kinetics play competing roles in determining the film morphology. Strain is an important factor that is frequently encountered in thin films grown on noncoherent substrates. The strained layers are inherently unstable and undergo morphological changes by strain relaxation. Both modelingReference Muller and Grant2 and experimental workReference Eaglesham and Cerullo3 suggest that depending on the interplay between elastic or plastic strain relaxations, misfit dislocations at the interface or strained islands on the surface are formed. Furthermore, evidence for strain relaxation in thin films induced morphological instabilities leading to a variety of nanostructures such as zero-dimensional quantum dots, 1D nanowires, 2D layers and 3D islands has also been provided theoreticallyReference Liu, Rieth and Schommers4,Reference Colin and Grilhe5 and experimentally.Reference Chiu, Huang and Poh6–Reference Moison, Houzay, Barthe, Leprince, Andre and Vatel8
Morphological instabilities in epitaxial thin films leading to surface patterns have been studied theoretically for many years.Reference Grinfeld9–Reference Chirranjeevi, Abinandanan and Gururajan15 Such instabilities are classified under the broad category of Asaro–Tiller–Grinfeld (ATG) instabilities.Reference Politi, Grenet, Marty, Ponchet and Villain16 Much of this work focuses on thin-film substrate systems where either both are single crystalline or at least one of them is single crystalline. There is experimental evidence in literature on thin films grown by a variety of techniques that confirms this behavior.Reference Aqua, Gouyé, Auphan, Frisch, Ronda and Berbezier17 These studies, thus, show that the films display morphologies which are induced by elastic and stress instabilities. Morphological instabilities due to diffusion-limited aggregation (DLA) are another type of instability, which are frequently encountered in thin films.Reference Witten and Sander18–Reference Hou, Ouyang, Chen, Liu, Xue, Wu, Zhang, Gao and Pang22 Since the early report of Witten and Sander,Reference Witten and Sander18 experimental evidence for the formation of fractal structures in thin films due to DLA has been provided by many workers.Reference Hou, Meng, Huang, Zhu, Huang, Chen and Sun19–Reference Hou, Ouyang, Chen, Liu, Xue, Wu, Zhang, Gao and Pang22 Therefore, the present work aims at investigating the morphological instabilities in amorphous/crystalline TiN and NbN thin films of different thicknesses deposited on amorphous borosilicate glass (BSG) and single-crystal Si substrate by RF magnetron sputtering. To the best of our knowledge, this is the first report where evidence for the coexistence of strain relaxation and DLA-induced surface nanostructuring in titanium and niobium nitride thin films grown on amorphous and crystalline substrates is provided.
II. EXPERIMENTAL
TiN films with different thicknesses were deposited on BSG substrate by RF magnetron sputtering in 100% nitrogen plasma at a power of 100 W. Commercial grade (99.9% pure) titanium sheet of 50 mm diameter was used as the target. After achieving the final vacuum of 2 × 10⁻⁶ mbar, the chamber was filled with nitrogen gas (99.99% pure) up to the required working gas pressure of ∼5 × 10⁻² mbar. Prior to the deposition, the substrates were cleaned chemically using an ultrasonication bath in acetone, isopropanol, and double deionized water.
The thickness of the films was determined by a surface profilometer (Model XP-1, Ambios Technology, Santa Cruz, California). The crystal structure of TiN films was determined using an x-ray diffractometer equipped with Co-Kα (λ = 1.7889 Å) radiation. The surface morphology of the films was determined by field emission scanning electron microscopy (FE-SEM-ultra 55, Carl Zeiss, Jena, Germany) and contact mode atomic force microscopy (AFM, SPA-400, Seiko Inst., Toyko, Japan). These conditions were common for all the experiments. As listed below, several sets of experiments were performed by varying the other deposition parameters to investigate the structure and morphological evolution. In the rest of the paper these samples will be denoted by the names given to them below.
(i) TiN-1: Substrate = glass; interelectrode distance = 5 cm; substrate temperature = 250 °C; thickness = 40, 70, 150, and 180 nm. (To obtain the different thicknesses of the films, the deposition time was varied between 60–240 min.)
(ii) TiN-2: Substrate = glass; interelectrode distance = 4 cm; substrate temperature = 300 °C; thickness = 150 nm.
(iii) TiN-3: Substrate = Si; interelectrode distance = 4 cm; substrate temperature = 250 °C; thickness = 250 nm.
(iv) TiN-4: Substrate = Si; interelectrode distance = 6 cm; substrate temperature = 250 °C; thickness = 250 and 400 nm.
(v) NbN-1: Substrate = Si; interelectrode distance = 4 cm; substrate temperature = 250 °C; thickness = 300 nm.
The interelectrode distance is varied to investigate the effect of change in rate of deposition, whereas temperature changes are expected to result in enhanced adatom mobility. The different substrates enable the investigation of the effect of film–substrate interface on the structure and morphology.
III. RESULTS AND DISCUSSION
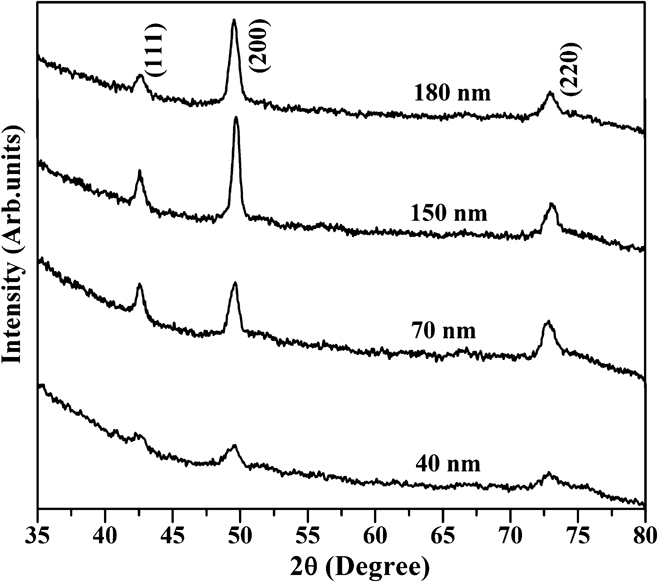
The x-ray diffraction (XRD) patterns of TiN-1 films deposited on glass substrates of different thicknesses are shown in Fig. 1. All the films crystallized in the cubic rock salt structure and exhibit peaks corresponding to (111), (200), and (220) orientations. The low intensity of the diffraction peaks for the 40 nm thick film indicates that it is partially amorphous. The intensity of the peak corresponding to the (200) plane progressively increased with increasing film thickness. This indicates that the films are preferentially textured along the (200) plane with increasing thickness. The lattice parameter of the 40 nm thick TiN film, which is 0.423 nm, increased to 0.424 nm for the 180 nm thick film. The lattice parameter is calculated from the position of the dominant peak and a change in lattice parameter is indicative of a shift in the peak position. A shift in peak position could also be due to the presence of strain in the films.Reference Welzel, Ligot, Lamparter, Vermeulen and Mittemeijer23 It should be noted that the glass substrate is amorphous and, therefore, the strain cannot be attributed to lattice parameter mismatch (between film and substrate). It is known that one of the sources of strain in thin films deposited on amorphous substrates is the difference in the thermal expansion coefficients (TECs). The TEC of titanium nitride is 93.5 × 10⁻⁶ K−1 (Ref. Reference Wang and Allen24), whereas that of BSG is 3 × 10⁻⁶ K−1 (Ref. Reference Wang and Allen25). During the cool down of the film-substrate system from 250 °C to room temperature, the strain is induced to accommodate the one order of magnitude difference in TEC between TiN and BSG. It is also possible that the growth process itself induces strains. From the shifts in diffraction peaks, it is only possible to estimate the total residual stress. The contributions from the various sources are more difficult to identify and isolate. Growth-related strains in thin films are quite well known.Reference Spaepen26
XRD patterns of TiN-1 series thin films for different thicknesses.

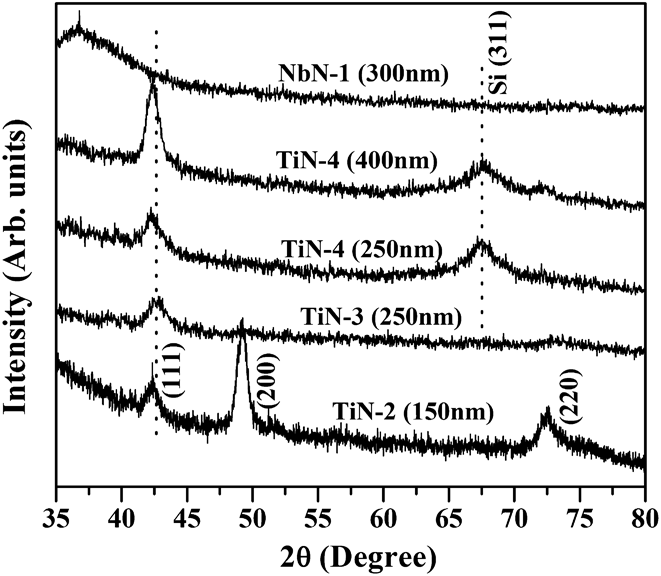
The XRD patterns of the TiN-2, 3, and 4 series films are shown in Fig. 2. Similar to TiN-1 series films, TiN-2 films with thickness 150 nm on glass substrate show a preferred (200) orientation. In contrast, TiN films on Si substrate belonging to the TiN-3 and TiN-4 series display only (111) orientation. However, the intensity of the (111) peak increases with increase in the thickness of the TiN-4 film and the peak position is progressively shifted to a lower diffraction angle. The lattice parameter of TiN-2 and TiN-3 films was 0.426 nm and the values were 0.427 and 0.428 nm for TiN-4 film of thickness 250 nm and 400 nm. There is a 20% difference between the lattice parameter of Si (with a diamond cubic structure of lattice parameter 0.54307 nm) and TiN (with a cubic rock salt structure of lattice parameter 0.423 nm). Therefore, it is expected that the large lattice parameter mismatch will introduce strains in the film grown on the single-crystal Si substrate. The surface energy per unit area of the TiN film is greater along the (111) plane than along the (200) plane.Reference Vasu, Krishna and Padmanabhan27 It is known that a combination of surface, interface, and strain energies, together, determines the crystalline orientation of thin films.Reference Carel, Thompson and Frost28 Although the effects of each of these cannot be isolated, depending on the growth conditions, the contribution of one or more of these parameters will dominate the others. In the current study, the surface energy does not vary with the energy of the bombarding particles, whereas the strain energy increases with it. Thus, it would appear that the strain energy dominates the contribution of the surface energy to determine the crystalline orientation in these films. The strain energies accumulated in thin films are proportional to the energies and the fluxes of the bombarding particles arriving on the growing film. When films are grown in 100% nitrogen, in contrast to a mixture of argon and nitrogen, the flux of the nitrogen particles bombarding the growing film causes a decrease in the strain energy of the film. This decrease in the strain energy per unit area results in a preferred crystallographic texture along the (200) plane. This can also be attributed to the anisotropy in the elastic moduli and, therefore, the plane with the lowest overall energy (surface energy + strain energy + stopping energy) will be the (200) plane. The substrate strain can also induce the crystallographic texture in thin films.Reference Vasu, Krishna and Padmanabhan27,Reference Kiran, Krishna and Padmanabhan29 Significantly the NbN films deposited on the Si substrate were amorphous in spite of the deposition temperature being as high as 250 °C. Evidently NbN requires a higher thermal activation than TiN for crystallization.
XRD patterns of TiN-2, 3, and 4 as well as NbN-1 series thin films for different thicknesses.
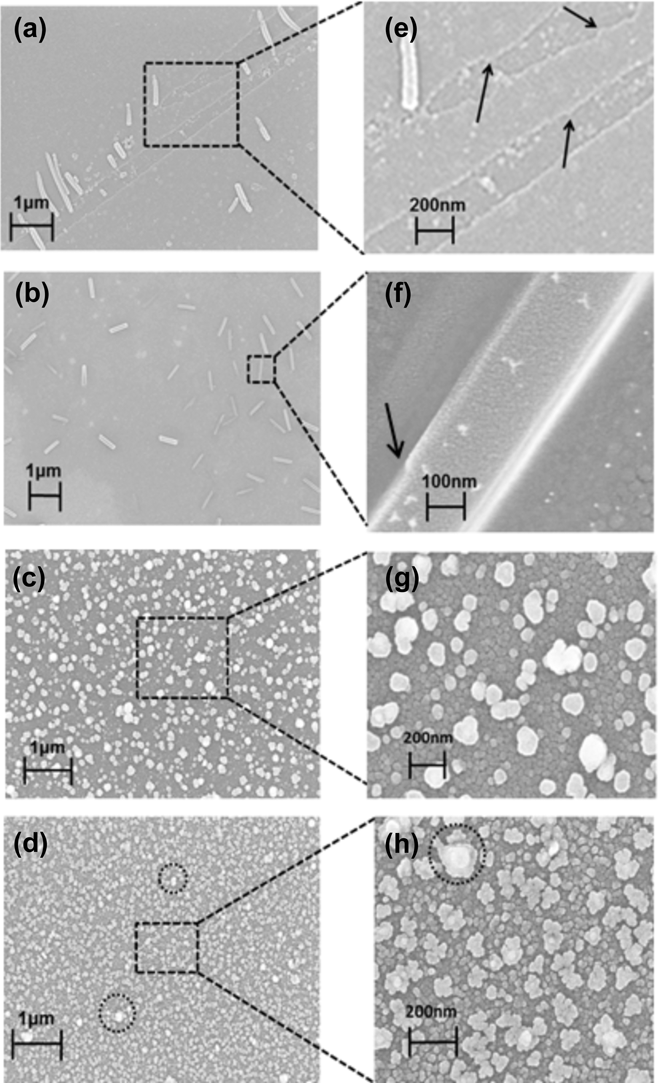
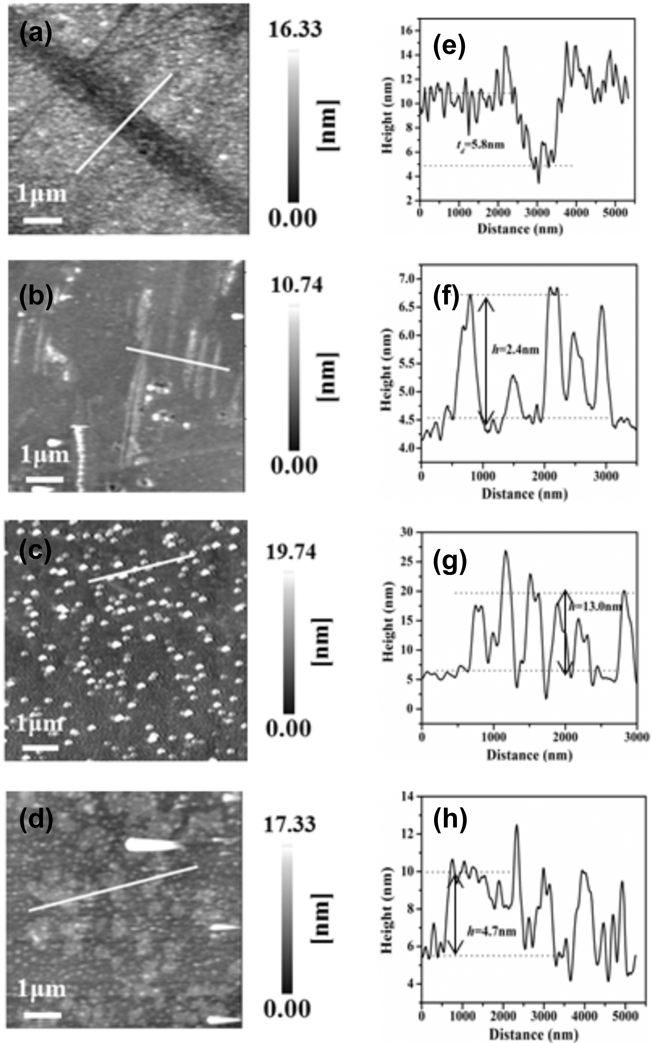
The XRD results clearly indicate the presence of strain in all the TiN films, irrespective of deposition parameters and thickness. As stated in the introduction, most of the theories and models developed to explain the morphological instabilities are intended for the growth of a crystalline film on crystalline substrates. Hence, the treatments always assume that there is a major contribution to the strain from the lattice parameter mismatch. One of the models that can be used to explain the morphological instabilities in thin films deposited on an amorphous substrate is the so-called ATG instability model.Reference Grinfeld9,Reference Asaro and Tiller10,Reference Politi, Grenet, Marty, Ponchet and Villain16 The major assumption in this model is that the substrate is a single crystal on which a crystalline film is grown epitaxially. It is further assumed that the substrate–film lattice misfit is small and that the instabilities are a consequence of this misfit. Thus, the ATG model is valid, in general, for crystalline films on crystalline substrates. However, it does account for the possibility of strain relaxation through a deformation of the surface or a 2D–3D transition, which is relevant to the present study. It does not deal with the possibility of either a crystalline film on an amorphous substrate or an amorphous thin film on any type of substrate. The surface deformation then results in the formation of hills and valleys. In the present study, such a situation is observed in the evolution of the surface morphology in TiN-1 thin films of different thicknesses, as presented in the FE-SEM images in Figs. 3(a)–3(h). The surface morphology of the 40 nm film is characterized by a terrace-step surface with microtrenches [Fig. 3(a)] with an average width of about 500 nm over a 10 × 10 μm2 area. The magnified view [Fig. 3(e)] of the image shows several kinks (indicated by black arrows), which are present at the trench steps. The valley and terrace of the trench consist of nanoparticles with an average size of 60 nm. In addition, several rod-shaped islands can be seen on the surface of the film. The surface morphology of a 70 nm film exhibits rod-like islands [Fig. 3(b)], but the trenches have completely disappeared. The length and width of the rods is approximately 1 μm and 200 nm respectively. A closer examination of the rods [Fig. 3(f)] revealed that they have structural defects on the edges (indicated by an arrow). The surface morphology of the 150 nm thick film shows isolated irregular shaped mounds decorated by nanoparticles [see Figs. 3(c) and 3(g)] of 30 nm size. The size of the mound is in the range of 80–150 nm. A further increase in the film thickness to 180 nm causes the surface mound morphology to turn into flower-like structures decorated by nanoparticles of 50 nm size [see Figs. 3(d) and 3(h)]. The average size of the flower is 100 nm. It can be seen that some of the mounds (indicated by circles) still remain on the surface. AFM was used to further study the surface characteristics of the TiN-1 thin films as shown in Figs. 4(a)–4(h) along with the corresponding line profiles over a 7 × 7 μm2 scan area. The AFM images are consistent with the FE-SEM images of the TiN-1 thin films presented in Figs. 3(a)–3(h). The surface morphology of the 40 nm film shows trenches, which transform into flowers via nanorod and mound structures as the film’s thickness increases to 180 nm. The trench depth (T d) of the 40 nm film is determined as 5.8 nm from the line profile of the AFM images. The step height of the nanorods in the 70 nm film is 2.4 nm, 13.0 nm for the mound in the 150 nm film, and 4.7 nm for nanoflowers in the 180 nm thick film. Similarly, the surface roughness of the film first increased from 2.46 to 3.9 nm as the film thickness increased from 40 to 150 nm and then decreased to 3.30 nm for the 180 nm thick film. The FE-SEM and AFM results presented above indicate that all the thin films follow the Stranski–Krastanov growth mode which is very common in strained films and also a necessary condition for the observation of ATG instabilities.Reference Politi, Grenet, Marty, Ponchet and Villain16 Clearly ATG instabilities are also possible in the case of a strained crystalline film grown on an amorphous substrate where the strain is induced by the large TEC mismatch.
FE-SEM images of TiN thin film’s surface nanostructures for different thicknesses (a) 40 nm, (b) 70 nm, (c) 140 nm, and (d) 180 nm. The magnified view of each surface feature is shown in (e), (f), (g), and (h) respectively.
AFM images of TiN thin film’s surface nanostructures for different thicknesses: (a) 40 nm, (b) 70 nm, (c) 140 nm, and (d) 180 nm, along with the corresponding line profiles (e), (f), (g), and (h), respectively.
It is known that one of the factors that lead to the ATG instabilities is the variation in growth rate.Reference Grinfeld9–Reference Spencer, Voorhees and Davis11,Reference Politi, Grenet, Marty, Ponchet and Villain16 The TiN films were, therefore, grown on BSG substrates at a slightly lower deposition rate (varied by increasing the interelectrode distance to 5 cm at a constant thickness, power, and pressure and accompanied by a slight increase in substrate temperature, 300 °C, to aid crystallization). The low magnification (100 μm) FE-SEM image of this series of films, TiN-2, on BSG substrates, displayed in Fig. 5(a), shows localized island-like discontinuities in the films of 100 μm size distributed over the entire surface. A closer examination of these areas [Figs. 5(b) and 5(c)] reveals the formation of “dendritic structures” and “Brownian tree”Reference Le Gall30 consisting of “snowflakes”-like morphology. The snowflakes are 10 μm in length with a secondary side branch (indicated by arrows) of the order of 5–7 μm as seen from Figs. 6(a)–6(c). The dendritic structures have a four-fold symmetry with trunks extending radially out at right angles to each other. Energy dispersive x-ray (EDX) spectra recorded on these structures show that they are composed only of Ti and N, signifying the formation of titanium nitride. Dendritic structures including snowflakes and seaweed type of morphologies have been observed in a variety of thin-film systems.Reference Hou, Meng, Huang, Zhu, Huang, Chen and Sun19–Reference Hou, Ouyang, Chen, Liu, Xue, Wu, Zhang, Gao and Pang22 The difference between the earlier reports and the current study is the existence of two different kinds of instabilities occurring over two different length scales. There is a macroscopic ATG type of instability that occurs over lengths of several tens of microns and another instability that is diffusion limited and occurs over length scales of a few micrometers. To the best of our knowledge, this is the first report on the coexistence of two different kinds of morphological instabilities. Significantly these occur in polycrystalline films deposited on an amorphous substrate.
FE-SEM images of the TiN-2 series of films (a) low magnification showing the two different regions on the surface and (b) and (c) showing the formation of dendritic structures.
(a), (b), and (c) FE-SEM images of the dendrites in the TiN-2 series films showing their dimensions.
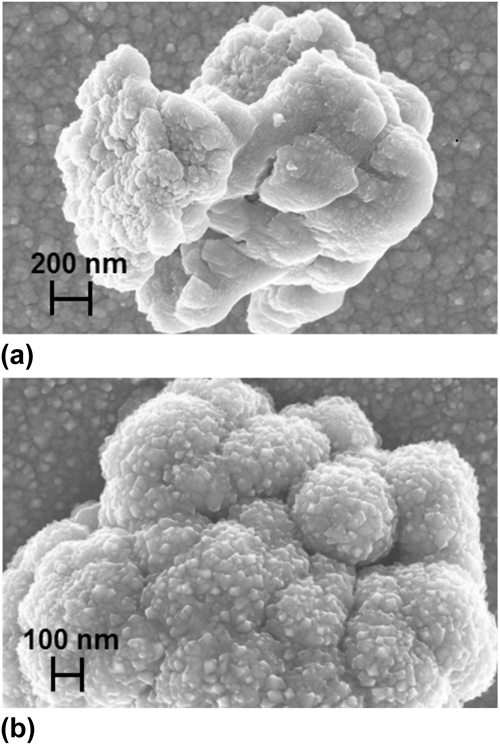
To understand the differences (or similarities) in the morphological instabilities between crystalline films grown on an amorphous substrate and that grown on a crystalline substrate, TiN films were also grown on a single-crystal Si (311) substrate. The FE-SEM images of the TiN-3 series of films that were deposited on the Si substrate (with an interelectrode distance of 4 cm, substrate temperature of 250 °C, and thickness of 250 nm) are shown in Figs. 7(a)–7(d). It can be observed from this image that the film morphology is composed of two distinct areas. The first area is very smooth and densely packed, whereas the second one consists of discontinuities in the form of circular islands of sizes that range from 20–40 μm in diameter [Fig. 7(a)]. These areas appear to have resulted from delamination of the films at those particular spots. From Figs. 7(b) and 7(c), it is evident that the film comprises two types of morphologies, the first of which consists of nanocubes of ∼200 nm dimension [see Fig. 7(d)] and the other comprises snowflakes and dendrites similar to those observed in Fig. 5. Interestingly, there is another level of self-organization that occurs, as seen from Figs. 8(a) and 8(b). The fractal structures organize themselves along the circumference of a circle whose center is either a cube or the ramified fractal itself. Clearly even in this case there is coexistence of the strain-induced and diffusion-limited instabilities. Another question that needs to be addressed is whether the instabilities disappear beyond a certain thickness. To establish a critical thickness, the next set of samples that were examined is from the TiN-4 series that were again deposited on Si (at an interelectrode distance of 6 cm, 250 °C substrate temperature, and thicknesses of 250 and 400 nm). The FE-SEM images of the 250 nm thick samples are shown in Figs. 9(a)–9(d) and those of the 400 nm thick films are displayed in Figs. 10(a) and 10(b). The 250 nm thick films also show the formation of microcubes comprising nanocube clusters [Figs. 9(a) and 9(b)]. In addition to the macroscopic ATG type of strain-induced instabilities, there is still some evidence for the formation of dendritic structures [Figs. 9(c)–9(e)]. It is also evident that the dendrites are not as well defined as in the case of the films of lower thickness and bear resemblance to denser seaweed type of morphology. Further increase in thickness to 400 nm results in more aggregation as evidenced by the cauliflower type of microstructures that are decorated by nanoparticles of TiN. At this thickness, both elastic strain-induced ATG type of morphology as well as the dendritic structures have completely disappeared. It can therefore be concluded that there is indeed a critical thickness (approximately ≥250 nm in this case) beyond which the morphological instabilities disappear and there is a transformation to a more columnar microstructure with particle aggregation, as commonly observed in physical-vapor-deposited thin films.
FE-SEM images of the TiN-3 series of films showing (a) two regions on the surface, (b) formation of dendrites, and (c) and (d) formation of micro/nanocubes.
FE-SEM image of the self-organization of dendrites with (a) cube and (b) dendrite at the center.
FE-SEM images of the TiN-4 series of films of 250 nm thickness at various magnifications showing the formation of (a) microcubes that consist of (b) nanocubes, and (c) clusters that consist of (d, e) dense seaweed type of morphologies.
FE-SEM images of the TiN-4 series of films of 400 nm thickness at various magnifications showing the formation of (a) cauliflower-shaped clusters which are decorated with (b) nanoclusters.
The existence of a critical thickness beyond which the morphological instabilities disappear is well documented (see, for example, Refs. Reference Grinfeld9 and Reference Politi, Grenet, Marty, Ponchet and Villain16). In the original work by GrinfeldReference Grinfeld9 it is shown that the critical thickness is related to the surface tension (energy), rigidity of the solid, and maximal shear stresses. It is further stated that the surface tension suppresses the unstable growth of irregularities (instabilities in the present case) below a certain critical tangential wavelength which, in turn, is related to the thickness. Politi et al.Reference Politi, Grenet, Marty, Ponchet and Villain16 relate the critical thickness to the energy minimization process that occurs during the growth of an adsorbate (thin film) on a substrate. The critical thickness is then the thickness at which stress relaxation occurs. They further show that both the thermodynamics and kinetics of growth contribute to the critical thickness. It should be recalled that in all these studies the substrate is assumed to be single crystalline and therefore the origin of the instabilities are misfits that occur at the interface between the film and the substrate. In the present case also, it is speculated that the critical thickness is related to the free energy minimization process and that instabilities disappear beyond the thickness at which stress relaxation takes place. The stresses here originate either as a consequence of growth parameters (such as pressure, rate of deposition, and substrate temperature) or the differences in the TEC of the films and substrates or a combination of these parameters. Since the films, in the present case, are grown on amorphous substrates the critical thickness is higher than in the case of crystalline films on crystalline substrates. This is the subject of further study and will be reported later.
The final set of samples examined were the NbN-1 thin films deposited on Si substrates (interelectrode distance of 6 cm at 250 °C substrate temperature and 300 nm thickness) and the FE-SEM images are shown in Figs. 11(a)–11(e). Surprisingly, in contrast to the TiN films, these films did not crystallize even at a thickness of 300 nm. The morphology is, however, very similar to that of the TiN films discussed earlier. The low magnification images presented in Figs. 11(a)–11(c) shows that these films consist of islands of up to 10 μm dimension with fractal and seaweed-like structures scattered between them. A closer examination of the image revealed that they were also large fractal structures in the form of snowflakes with lateral “end-to-end” dimension of 2–5 μm [Figs. 11(d) and 11(e)]. There are two layers of organization within these structures with dense snowflakes at the center and less dense secondary branches emerging out of these toward the circumference. It can also be seen from Figs. 11(b) and 11(c) that in some cases the seaweed structures extend laterally across the surface over lengths in excess of 50 μm. It is evident from the results presented above that there are two kinds of morphologies in the films. The first type of morphology is smooth and completely devoid of instabilities. The second type of morphology consists of surface patterns induced by a combination of strain and DLA. The surface patterns that result due to these instabilities are similar to those encountered when films are delaminated or debonded. These have been discussed by one of the current authors in an earlier work.Reference Marka, Menaka, Ganguli and Krishna31 During film formation, diffusion allows the number density of the previously created defects to reduce by grain growth, dislocation climb, annihilation, etc., resulting in a misfit as the film attempts to either contract or expand. However, since the in-plane misfit displacements are constrained by the substrate, elastic strains develop in the film. The residual stresses can also be redistributed by plastic deformation and creep, leading to cracking, debonding, or delamination. It is known that the surface energy minimization or strain relaxation of 3D islands transforms its shape by external perturbations such as elastic distortion of the substrate and the changes in film thickness.Reference Chiu, Huang and Poh6,Reference Muller and Kern7,Reference Brongersma, Castell, Perovic and Allmang32,Reference Tersoff and Tromp33
FE-SEM images of the NbN-1 series of specimens at different magnifications (a); (b) and (c) are at low magnifications showing islands extending over several tens of micrometers and the enlarged view of some of the dendrites in (d) and (e).
After strain relaxation, the 3D islands and their substrates are inhomogeneously strained and the strain distribution varies with film thickness. Therefore, these variations could have also induced the observed shape change in morphology. In the present case, we believe that the inhomogeneous strain relaxation in 3D islands with a change in film thickness causes the observed morphological changes. Tersoff and TrompReference Tersoff and Tromp33 showed that below a critical size, islands have a compact, symmetric shape that transforms into long thin shapes above that critical size. The reason for this is that the larger size allows better elastic relaxation of the island's stress (the reduction in the surface energy to volume energy ratio due to the increased size could also be another factor). It has been shown that the island's energy E = E s + E r where E s is the extra energy due to the surface and interface and E r is the energy changed due to elastic relaxation. They make the important point that strain generally causes deformation in the plane. More importantly, the strains are free to relax out of plane or normal to the substrate surface. In the present study also it is evident that the in-plane dimensions of the instabilities are much larger than the thickness of the films. Similarly, Granasy et al.Reference Gránásy, Pusztai, Börzsönyi, Warren and Douglas34 have demonstrated that the dendritic structures emerge due to an interplay between the ordering effect of crystallization and the disordering effect of interfacial instabilities as a result of, what they term as, growth front nucleation. They suggest that the evolution of the dendritic structures is critically dependent on the ratio of the phase field mobility M ϕ and orientational mobility M θ which, in turn, is proportional to the ratio of the rotational (D rot) to translational (D tr) diffusion coefficients. The remarkable similarity between the dendritic structures observed by Granasy et al.Reference Gránásy, Pusztai, Börzsönyi, Warren and Douglas34 and the current study, leads us to the conclusion that the instabilities in the present case also can be attributed to anisotropic growth front nucleation. The dendritic structures do not occur when the growth rate is high on BSG substrates even up to a thickness of 180 nm. The growth rates (R) follow the sequence R 4 cm > R 5 cm > R 6 cm, at a constant power and nitrogen pressure. The substrate temperature does not affect the growth rate significantly. Based on this, it can be postulated that a high growth rate on an amorphous substrate leads to the formation of dendritic structures (TiN-2 series), whereas on a crystalline substrate it appears to be independent of growth rate, since these dendritic structures are observed at both low and high growth rates (TiN-3, -4, and NbN-1 series). It also appears that the formation of dendritic structures is preceded by the ATG instabilities at lower thicknesses. Therefore, it can be postulated that local strain leads to the onset of delamination and hence strain-induced instabilities at lower thicknesses. At higher thicknesses, these are accompanied by diffusion-limited cluster aggregation. Significantly, in contrast to many other reports, volume crystallization does not seem to be a prerequisite for the formation of these structures. Since electron diffraction would require destructive sample preparation, it was not attempted in the case of the NbN films.
IV. CONCLUSIONS
The effects of elastic strain and DLA on morphological instabilities in titanium nitride and niobium nitride thin films have been investigated. SEM studies of the morphological instabilities reveal the coexistence of elastic strain-induced ATG type of instability and dendritic and snowflake structures due to DLA. The ATG instabilities extend over lengths of several tens of micrometers, whereas the DLA structures are confined to lengths less than 10 μm in the same film. A critical thickness and critical growth rate are necessary to cause DLA and coexistence of the two kinds of instabilities. Significantly, crystallization is not a prerequisite for the formation of dendritic structures and they can indeed occur in disordered films. For the first time, by manipulating the conditions of growth during the deposition of thin films, the coexistence of elastic strain-induced instabilities and DLA in the same films is demonstrated. However, it was not possible (given the experimental limitations) to establish a quantitative relation between the observed morphological features and deposition parameters such as growth rate. It was difficult to isolate the roles of the surface, interface, and strain energies in determining the formation of the observed morphological instabilities. The authors believe a model for morphological instabilities in amorphous/polycrystalline thin films grown on amorphous/polycrystalline substrates is essential to understand the experimentally observed growth patterns in the current study.
ACKNOWLEDGMENTS
The authors acknowledge the support received from the UGC-CAS and UPE programs. Infrastructural support provided by DST under the Center for Nanotechnology, UoH is acknowledged. The comments of the reviewer, which led to improvements in the work, are also acknowledged.