I. INTRODUCTION
Ni–Cr–Mo-based alloys have been widely applied in chemical, aerospace, and nuclear industry for their good oxidation resistance and corrosion resistance. Reference Zhang, Zagidulin and Shoesmith1–Reference Jakupi, Noël and Shoesmith3 It has been reported that Hastelloy C2000 alloy, with a nominal composition of Ni–26.62Cr–10.03Mo (at.%), is a promising candidate as heat exchanger in molten salt reactor at temperatures varying in the range of 300–700 °C. Reference Zhang, Zagidulin and Shoesmith1,Reference Delpech, Cabet, Slim and Picard4–Reference Chen, Yang, Sokolov, Erdman, Mo and Stubbins7 Among the precipitates Reference Kumar and Vasudevan8 formed in the alloy during service temperature, particles of ordered phase are mainly responsible for strengthening of the alloy. Reference Tawancy9,Reference Tawancy and Aboelfotoh10 However, the precipitation of ordered phase deteriorates corrosion resistance of the alloy in application due to partitioning of Mo. Reference Hou, Li, Onodera, Zhang, Koizumi and Chiba11 The evolution behavior of ordered phase has been an attractive subject of experimental and theoretical investigation in Ni–Cr–Mo-based alloys. Reference Zeng, Kou and Xie12–Reference Wang, Woodward, Zhou, Liu and Chen14
The evolution behaviors of ordered phase, such as thermal stability and solvus temperature, are dependent on composition of the Ni–Cr-based alloys, especially an atomic X/Cr ratio (X = Mo and W). Reference Turchia, Kaufmanb and Liu13,Reference Verma, Singh, Wanderka and Chakravartty15 Hu et al. Reference Hu, Cheng, Zhang, Li, Zhang and Fu16 investigated the stability of Ni2Cr1−x M x (M = Nb, Mo, Ta, and W) superlattice by first principle calculation based on the density functional theory, and found that all Ni2Cr1−x M x superlattice phases were energetically more stable relative to Ni2Cr when value of x up to 0.25, indicating the alloying elements can improve the thermal stability of the Ni2Cr superlattice. Pai et al. Reference Pai, Sundararaman, Maji, Biswas and Krishnan17 studied the solvus temperature (T f) of Ni2(Cr, Mo) phase in Ni0.66Cr1−x Mo x alloy with x varying from 0 to 0.5, i.e., T f increases with increasing an atomic Mo/Cr ratio (R) when 0 < R < 1. Similarly, T f of Ni2(Cr, Mo) also increases with R even though R > 1 according to the results of Dymek et al. Reference Dymek, Wróbel and Dollar18 and Tawancy and Aboelfotoh. Reference Tawancy9,Reference Tawancy and Aboelfotoh10 Moreover, it has been shown that aging temperature also plays important role in affecting thermal stability of ordered phase due to diffusion of alloying elements. Reference Arya, Dey, Vasudevan and Banerjee19 For example, Mishra and Ranganathan Reference Mishra and Ranganathan20 have reported that Pt2Mo-type and DO22 superlattice can co-precipitate in Ni–25Mo–5Al alloy (at.%) after long-range aging at 605 °C, while only Pt2Mo-type superlattice precipitates after aging at 727 °C. Reference Kulkarni and Dey21
The study of evolution of ordered phases has been primarily focused on the alloy with high atomic Mo/Cr ratio of 1.7 for Haynes 242.
Reference Kumar and Vasudevan8,Reference Dymek, Wróbel, Dollar and Blicharski22
It has been found, in Haynes 242, that ordered phase with Pt2Mo-type structure is coarsened along
 ${\left\langle {\overline 1 10} \right\rangle _{{\rm{fcc}}}}$
without changing its crystallographic and ordering characteristics after prolonged exposure to 650 °C for 4000 h, and finally transformed into Ni3Mo-type phase (βCu3Ni prototype) after thermal–mechanical treatment.
Reference Dymek, Wróbel, Dollar and Blicharski22
In the alloys with low atomic Mo/Cr ratio, such as Ni–24.7Cr–10.8Mo (Mo/Cr ≈ 0.44)
Reference Lu, Pike, Brooks, Liaw and Klarstrom23,Reference Li, Bai, Liu, Zhu, Xie and Zhan24
and Ni–23.9Cr–10.4Mo (Mo/Cr ≈ 0.43),
Reference Hou, Li, Onodera, Zhang, Koizumi and Chiba11
ordered phase is roughly spherical and its edge is poorly defined. The unique characteristic is different from ordered phase in Haynes 242, where the ordered phase shape is elongated, with a clearly defined edge and a specific orientation along
 $\left\langle {420} \right\rangle$
. The evolution behavior of ordered phase is therefore expected to exhibit a different behavior since the thermal stability of ordered phase is a function of alloy composition and aging temperature. On the other hand, it is known that plastic deformation applied before aged can produce a large number of defects and many inhomogeneity structures like stacking faults and twins, enhancing the diffusion rate of solute atoms and/or accelerating the decomposition of ordered domains. It can be deduced that plastic deformation has a significant impact on thermal stability of ordered domain. It has been found
Reference Dymek, Wróbel, Dollar and Blicharski22
that cold rolled of 50% before aged in Haynes 242 alloy led to decomposition of the Ni2(Mo, Cr) phase into the Ni3Mo-type phase.
To date, the evolution behavior of ordered phase in Ni–Cr–Mo-based alloys with low atomic Mo/Cr ratio has not yet been elucidated. Meanwhile, the decomposition of the Ni2(Cr, Mo) phase in the C2000 can occur or not after plastic deformation is an interesting problem. The present study aims at investigating the evolution behavior of ordered domains upon prolonged thermal exposure at elevated temperature in the Ni–Cr–Mo alloy with low Mo/Cr ratio from the viewpoint of experiments. Meanwhile, effect of plastic deformation before thermal exposure on the evolution behavior of ordered domains is discussed as well.
II. EXPERIMENTAL
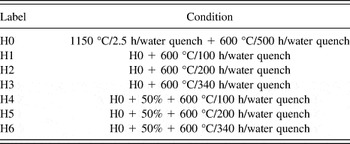
The alloy, with a nominal chemical composition of Ni–22.66Cr–15.80Mo (wt%) with Cu, Al, Mn, Co, Si, P, and 0.001C as minority alloying elements, (named Hastelloy C2000 alloy with an atomic Mo/Cr ratio of 0.38) was supplied by the Haynes International Inc. (Kokomo, Indiana). The specimens were heat treated and thermal exposed in the conditions shown in Table I.
Heat treatment and thermal exposure regime of the investigated alloy.

Specimens for transmission electron microscope (TEM) were prepared by a standard electro-polishing technique using a double-jet device. After mechanical thinning to approximately 50 μm, thin foils with 3 mm in diameter were thinned by the Fischione110 twin-jet electro-polisher (Fischione Instruments, Inc., London, United Kingdom) using 10% perchloric acid, 25% ethanol, and 65% N-butyl alcohol solution. The structure analysis was carried out using a Tecnai G2 F30 TEM (FEI Company, Hillsboro, Oregon) equipped with a field-emission gun at an operating voltage of 300 kV, utilizing the dark-field (DF), bright-field, and selected-area-electron-diffraction (SAED) modes, and the acquisition time for recording diffraction patterns was 0.5 s. Microhardness testing of samples obtained after thermal exposure at 600 °C was tested at room temperature to estimate the effect of the evolution of ordered domains on the hardness of samples. The load for the Vickers hardness test was set to 100 gf and test time was 15 s. The average values of hardness were obtained after 5 test repetitions.
III. RESULTS AND DISCUSSION
A. Precipitates in the aged C2000
Figure 1 shows TEM-DF image and the corresponding SAED pattern of the aged samples after heat treatment at H0 condition. It can be seen that nanometer-sized precipitates marked by the solid line outlines in Fig. 1(a) are roughly spherical and uniform throughout the matrix. Also, edges of the particles are poorly defined and their distribution does not display a specific orientation. The SAED pattern [Fig. 1(b)] of the precipitated phase in
 ${\left[ {\overline 1 12} \right]_{{\rm{fcc}}}}$
exhibits a typical superlattice spot of Pt2Mo-type structure. Moreover, the quantitative chemical analysis on the particle phase demonstrated that they approximately contain 18.93Cr, 22.73Mo, and 58.34Ni (wt%) and correspond to 22.88Cr, 14.89Mo, and 62.23Ni (at.%), suggesting that the phase is Mo-rich as compared to the matrix, which could be attributed to the fact that bigger Mo atoms require relatively smaller energy to reach at Cr vacancy.
Reference Verma, Singh, Wanderka and Chakravartty15
Based on the SAED pattern studies in conjunction with the TEM-energy disperse spectroscopy (EDS) analysis, and more negative formation energy for Ni2Cr than that of Ni2Mo,
Reference Turchia, Kaufmanb and Liu13,Reference Turchi, Kaufman and Liu25
hence, it is reasonable that the superlattice spots of Pt2Mo-type structure corresponded to Ni2(Cr, Mo) stoichiometry. It is worth noting that three variants of Pt2Mo-type superlattice marked by I, II, and III, respectively in Fig. 1(b) appear in
 ${\left[ {\overline 1 12} \right]_{{\rm{fcc}}}}$
zone-axis diffraction pattern. These results indicated that the different variants of the Ni2(Cr, Mo) precipitate can coexist in the matrix. Intensity of superlattice reflection, in general, is a function of: (a) volume fraction; (b) order parameter of ordered domains; (c) atomic scattering factors. Difference due to atomic scattering factors could be ignored for a given alloy. Moreover, effect of the order parameter on intensity of superlattice reflections could be assumed to be nearly one. Therefore, it is reasonable to presume that the superlattice reflection intensity is mainly governed by the volume fraction of ordered domain. The change in intensity of
 ${\left[ {\overline 1 12} \right]_{{\rm{fcc}}}}$
zone-axis diffraction pattern can reflect variation trend of the volume fraction of ordered domain with thermal exposure time. Moreover, it is known that the diffusion rate of molybdenum atom is less than that of chromium atom due to large atomic radius of molybdenum atom. As a result, the compositional gradient of Cr across the γ/Ni2(Cr, Mo) interface is more smooth than that of Mo, which has been suggested by Chen et al.
Reference Chen, Tang, Xu, Wang, Kou, Li and Cui26
by analyzing diffusion couples. Therefore, it can be deduced that the transitional interface lead to formation of the blurry phase boundary in C2000 with low atomic Mo/Cr ratio.
TEM image of dispersed precipitates (a), SAED patterns of the matrix in
 ${\left[ {\overline 1 12} \right]_{{\rm{fcc}}}}$
zone-axis after aging at 600 °C for 500 h (b).

B. Evolution of precipitates during thermal exposure at 600 °C
To investigate thermal stability of Ni2(Cr, Mo) domain itself, the samples containing Ni2(Cr, Mo) phase are exposed for 100–340 h at 600 °C. The TEM-DF images illustrating the precipitates evolution at 600 °C are shown in Fig. 2. From such images [Figs. 2(a), 2(c), and 2(e)], compared to the initial ordered domain, both size and shape of ordered phase do not significantly change, indicating the low coarsening rate and high thermal stability of ordered domain. The analysis of SAED pattern confirms that the ordered domain is still consists of Pt2Mo-type structure with further thermal exposure. The ellipsoidal shaped domains, marked by the dotted lines, dominated the microstructure over the spherical shaped particles, marked by solid lines, after 200 h of thermal exposure due to preferential growth along
 ${\left\langle {\overline 1 10} \right\rangle _{{\rm{fcc}}}}$
(see Fig. 2(d)). After 340 h, the matrix is almost occupied by ellipsoidal ordered domain marked by the dotted line outlines in Fig. 2(f), which is attributed to the greatest reduction in strain energy.
Reference Kumar and Vasudevan8
DF images of ordered domain after thermal exposure at 600 °C for (a and b) 100 h, (c and d) 200 h and (e and f) 340 h. The inset in (a), (c), and (e) show SAED of
 ${\left[ {\overline 1 12} \right]_{{\rm{fcc}}}}$
zone-axis.

C. Quantitative characterization of ordered domain
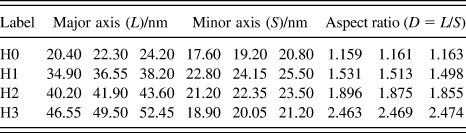
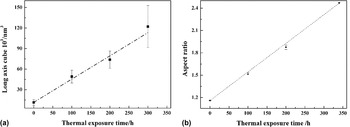
To better understand evolution behavior of Ni2(Cr, Mo) domain during thermal exposure, major-axis (L), and aspect ratio (D = L/S) of ordered domain are summarized in Table II by means of Nano measurer 1.2 software. It is noted that both L and D continued to increase with increasing t, which is consistent with the results observed in DF images in Figs. 2(b), 2(d), and 2(f). Figure 3 shows the variation of both L and D with thermal exposure time (t) at 600 °C. It was found that cube of the domain size varied in linear manner with time [Fig. 3(a)] whose slope yielded the value of parameter, k, according to r n (t) − r n (t 0) = k LSW(t − t 0) equation. The slope obtained by linear regression is approximately (3.39 ± 0.02) × 10−30 m3/s, i.e., the coarsening rate of ordered domain is very slow. A slower of coarsening rate of Ni2(Cr, Mo) phase in C2000 may be attributed to several reasons as follows, (i) the long-range ordered Ni2(Cr, Mo) phase itself is stable phase in the equilibrium Ni–Cr–Mo systems Reference Kumar and Vasudevan8,Reference Turchia, Kaufmanb and Liu13,Reference Turchi, Kaufman and Liu25 ; (ii) the alloying elements Mo can improve the thermal stability of Ni2Cr superlattice phase Reference Hu, Cheng, Zhang, Li, Zhang and Fu16 ; (iii) relatively low aging temperature of 600 °C compared to the solvus temperature (about 710 °C) of Ni2(Cr, Mo) phase in C2000. Reference Pai, Sundararaman, Maji, Biswas and Krishnan17 Similarly, there is also a linear relationship between D and t [Figs. 3(b)], i.e., D increases with increasing of t, which indicates that the growth rate of ordered domain along L is more than that along S with increasing of t due to the greatest reduction in strain energy. Reference Kumar and Vasudevan8 In other words, there is a preferential growth direction for growth of ordered domain during thermal exposure. The observed linear dependence is similar to that observed in several Ni-based alloys in which homogeneous precipitation of ordered phase occurs. Reference Sundararaman, Mukhopadhyay and Banerjee27 The coarsening of ordered phase was attributed to coherency strains or to matrix-precipitate lattice misfit (δ). The δ is associated with large elastic strain energy around the precipitates, in turn, which implies a large driving force for the coarsening of particle.
Different parameters of ordered domains by means of Nano measurer 1.2 software.

Both major axis (L) and aspect ratio (D) of ordered domain as a function of the thermal exposure time at 600 °C. (a) L 3–t and (b) D–t.

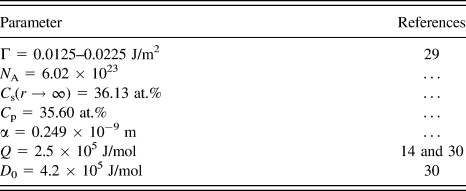
The result in Fig. 3(a) is consistent with a coarsening regime described by the Lifshitz–Slyozov–Wagner (LSW) model. Reference Lifshitz and Slyozov28 Therefore, the average radius of the particles as a function of time is described by Eq. (1) according to the LSW model. It is known that lattice parameter α of the Ni2(Cr, Mo) phase is a constant, and T aging is also a constant due to a constant aging temperature. Meanwhile, both the interfacial energy Γ and activation energy Q are also constant when ordered phase is given. Based on this, k LSW is a constant by Eqs. (2)–(4). Therefore, it can be seen from Eq. (1) that the cube of the average radius of the ordered phase follows linear increase with increasing of thermal exposure time. According to the data presented in Table III, the interfacial energy Γ varies between 0.0125 and 0.0225 J/m2, the activation energy Q is 2.5 × 10⁵ J/mol and the diffusion coefficient of solute in the Ni2(Cr, Mo) is 4.2 × 10⁵ J/mol. Using this data, the coarsening rate expected from Eq. (1) is calculated to be approximately (5–9) × 10−30 m3/s, which is larger than the experimentally determined value. This reason is attributed to these factors as follow. First, the LSW theory is strictly valid for infinitely dilute systems, which ignore the influence of the volume fraction of the precipitate on the coarsening. On the other hand, the interfacial energy increased resulting from increasing chemical energy between superlattice and matrix is not considered using the LSW model. Moreover, it is impossible to keep a perfect coherency relationship between ordered domain and matrix, viz. the arrangement of atoms with random angles on interface leads to increasing the interfacial energy.
 $${r^3}\left( t \right) - {r^3}\left( {{t_0}} \right) = {k_{{\rm{LSW}}}}\left( {t - {t_0}} \right)\quad ,$$
 $${k_{{\rm{LSW}}}} = {{8\Gamma {V_{\rm{m}}}D} \over {9R{T_{{\rm{aging}}}}}}{{{C_{\rm{s}}}\left( {r \to \infty } \right)} \over {{{\left( {{C_{\rm{p}}} - {C_{\rm{s}}}\left( {r \to \infty } \right)} \right)}^2}}}\quad ,$$
 $${V_{\rm{m}}} = \left( {{1 \mathord{\left/ {\vphantom {1 4}} \right. \kern-\nulldelimiterspace} 4}} \right){N_{\rm{A}}}{\left( {{\alpha ^{{\rm{P}}{{\rm{t}}_2}{\rm{Mo}}}}} \right)^3}\quad ,$$
 $$D = {D_0}\,\exp \left( { - {Q \mathord{\left/ {\vphantom {Q {RT}}} \right. \kern-\nulldelimiterspace} {RT}}} \right)\quad ,$$
where r(t) is the radius of the particle at time t, Γ is the interfacial energy, V m is the molar volume, D is the coefficient of diffusion of solute, R is the gas constant, T aging is the aging temperature, C s(r → ∞) is the solute concentration in equilibrium with a flat interface, C p is the solute concentration in the Ni2(Cr, Mo) particle, N A is Avogadro's number, α is lattice parameter of the Ni2(Cr, Mo) phase, D 0 is diffusion coefficient of solute in the Ni2(Cr, Mo) phase, and Q is activation energy.
Values of the different parameters.

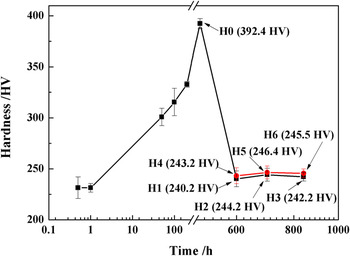
The change in hardness as a function of aging time at 600 °C is shown in Fig. 4. The hardness of samples increases continuously with aging time in a range of 50–500 h, reaching a maximum value of 392.4 HV at H0, and then decreasing to approximately 240 HV as thermal exposure (H4, H5, and H6). The results indicate that the ordered phase grows and coarse during thermal exposure. As a result, the hardness drops as the precipitates quickly overage, i.e., kinetics of precipitate growth being quite fast at overage, which is consistent with the result obtained by Kumar and Vasudevan. Reference Kumar and Vasudevan8 The diffusion of solute atoms reaches saturation with increasing thermal exposure time. As a result, effect of thermal exposure time on both nucleation and coarsening of ordered domain is weaken under a constant temperature, leading to slow growth of ordered domain volume fraction down. Increasing thermal exposure time further, growth rate of ordered domain slows down due to decreasing free energy, which is consistent with the results obtained in Fig. 3(a).
The hardness of samples as a function of the thermal exposure time at 600 °C.

D. Effect of plastic deformation on evolution behavior of ordered domain
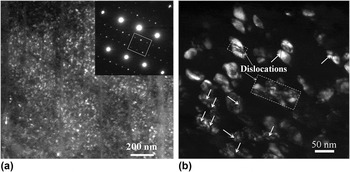
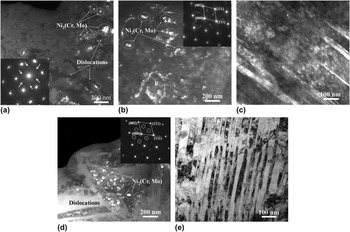
TEM images of samples after treatments at H0 + 50% (Fig. 5) and H4, H5, and H6 (Fig. 6) in Table I illustrate that effect of plastic deformation on thermal stability of ordered domain. It can be seen that plastic deformation does not lead to decomposition of the initial Ni2(Cr, Mo) phase [Fig. 5(a)], indicating that the stability of the Ni2(Cr, Mo) phase is insensitive to plastic deformation. It is interesting that some defects marked by the arrows in Fig. 5(b) appear on the surface of the ordered phase, implying a high free energy for the ordered phase. After treatments at H4, H5, and H6, the TEM images of the samples are somewhat different from that for samples after treatments at H1, H2, and H3. It is found that most of the precipitates exhibit a snowflake-like morphology marked by the arrows in Figs. 6(a) and 6(b), which have been confirmed to be Pt2Mo-type ordered phase by SAED patterns [inset in Figs. 6(a) and 6(b)], although they do not exhibit an ellipsoidal morphology. The snowflake-like morphology ordered phase distribute along substructures marked P in Fig. 6(b) and deformation twins marked by a dash line circle in Fig. 6(c). After H6 [Fig. 6(d)], the ordered phase exhibits a similar morphology feature with that of H1, H2, and H3 again, but its distribution mainly concentrates in dislocations, and some stacking faults [Fig. 6(e)] also appear in matrix. It is known that the lattice misfit between the precipitate and matrix, the distribution of solute atoms, and the elastic constants of the precipitates, play an important role in determining the morphology of the precipitates due to the minimization of the elastic strain energy. The lattice distortion on ordered phase formed after H0 + 50% increases the elastic strain energy of the phase. During thermal exposure in the early stages at 600 °C, the nucleation on the distorted ordered phase occurs by diffusion of solute atoms, which lead to the observed physical association of the initial and new ordered phase. It has reported Reference Chen, Tang, Xu, Wang, Kou, Li and Cui26 that the nucleation-growth of one metastable phase can occur on a specific plane of another phase. For example, nucleation of γ″ phase occurs on a {100} plane of a γ′ precipitate in Inconel 718 alloys due to a smaller interfacial energy requirement. Two particles join to form a composite single particle when their diffusion fields merge during growth or coarsening, which lead to appearance of snowflake-like morphology ordered phase. Moreover, the damage on crystal lattice of the initial Pt2Mo-type ordered phase resulting from introduction of defects into phases may be responsible for the snowflake-like morphology. Das and Thomas have showed that Reference Das and Thomas31 the metastable Ni2Mo is damaged by introduction of an anti-phase boundary. When the thermal exposure time up to 340 h, however, ordered phase can grow up fully and exhibit similar morphology with H1, H2, and H3, just its distribution focus on defect structures [Fig. 6(d)].
TEM images of samples after treatment H0 + 50%. (a) DF image and (b) BF image.

TEM images of samples after different treatments. (a) H4, (b and c) H5 and (d and e) H6.

IV. CONCLUSIONS
The evolution behavior of ordered phase in the Ni–Cr–Mo alloy with low atomic Mo/Cr ratio has been investigated in this study. The behavior was characterized by TEM and microhardness. The Ni–Cr–Mo alloys were subjected to a long-term thermal exposure of 100–340 h at 600 °C. Moreover, effect of plastic deformation applied before thermal exposure on evolution behavior of ordered phase was also studied. Based on the results from TEM analysis, the following principal conclusions can be drawn:
-
(1) The thermal exposure led to the coarsening of the Ni2(Cr, Mo) phase with rate of (3.39 ± 0.02) × 10−30 m3/s, without changing their crystallographic and ordering characteristics.
-
(2) There was a linear relationship between major-axis cube of ordered domain and thermal exposure time followed a coarsening regime described by the LSW model.
-
(3) A snowflake-like Pt2Mo-type phase appears in matrix after both plastic deformation and thermal exposure due to interaction between ordered phase and defects, although plastic deformation did not lead to decomposition of initial Ni2(Cr, Mo) phase into a new phase.
ACKNOWLEDGMENTS
Financial support was given by the National High Technology Research and Development Program of China (No. 2013AA031004) and the National Natural Science Foundation of China (No. 51171150), and the Program of Introducing Talents of Discipline to Universities (No. B08040).