



1. Introduction
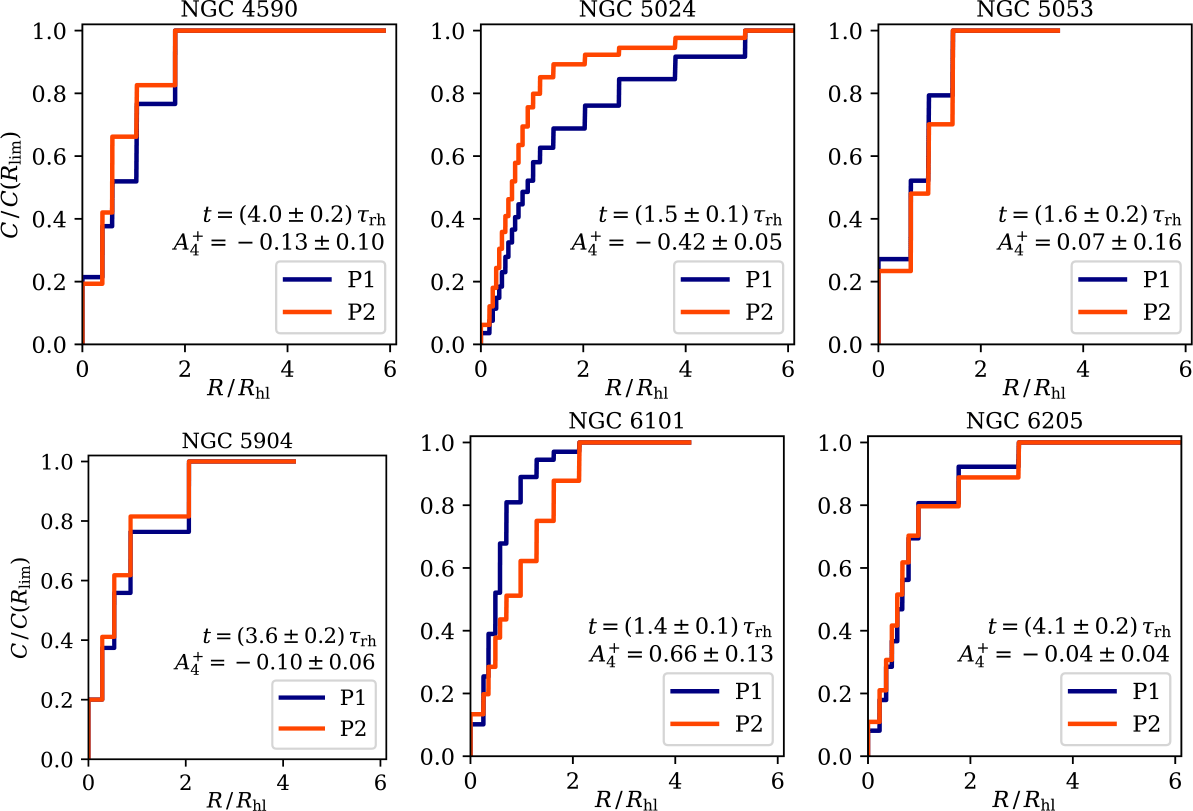
Massive and old globular clusters (GCs) are known to host multiple stellar populations with distinct chemical compositions and kinematics (e.g. Carretta et al. Reference Carretta, Bragaglia and Gratton2010; Gratton et al. Reference Gratton, Carretta and Bragaglia2012; Bastian & Lardo Reference Bastian and Lardo2018; Vesperini et al. Reference Vesperini, Hong, Giersz and Hypki2021; Leitinger et al. Reference Leitinger, Baumgardt and Cabrera-Ziri2025). The first population, or P1 stars, shows primordial abundances, while the enriched second population, P2, exhibits light-element variations that imply complex formation scenarios–ranging from in-situ formation in enriched gas to accretion of processed material (e.g. Carretta et al. Reference Carretta, Bragaglia and Gratton2010; Bekki Reference Bekki2011). Many formation models suggest P2 stars form preferentially in the core (e.g. Lacchin et al. Reference Lacchin, Calura, Vesperini and Mastrobuono-Battisti2022), but observations of dynamically-young GCs show diverse spatial distributions: some retain a centrally concentrated P2 population, others have higher numbers of P1 in the core, some are fully radially mixed (Leitinger et al. Reference Leitinger, Baumgardt, Cabrera-Ziri, Hilker and Pancino2023), see also a selection of Galactic GCs in Fig. 1.
Cumulative distribution functions of P1 and P2 stars in a sample of dynamically-young Galactic GCs. We note that the displayed radial range goes up to six half-light radii,
 $R_\mathrm{h[}l]$
, to show the whole clusters, but the parameter
 $A^+_4$
is calculated from stars only up to
 $4.27\,R_\mathrm{h[}l]$
(data taken from Leitinger et al. Reference Leitinger, Baumgardt and Cabrera-Ziri2025).

Figure 1 Long description
Six line graphs compare cumulative distribution functions of two star populations in different globular clusters. Panel A: NGC 4590. The line graph shows the cumulative distribution functions of P1 and P2 stars. The x-axis is labeled R/Rhl and ranges from 0 to 6. The y-axis is labeled C/C(Rlim) and ranges from 0 to 1. Panel B: NGC 5024. The line graph shows the cumulative distribution functions of P1 and P2 stars. The x-axis is labeled R/Rhl and ranges from 0 to 6. The y-axis is labeled C/C(Rlim) and ranges from 0 to 1. Panel C: NGC 5053. The line graph shows the cumulative distribution functions of P1 and P2 stars. The x-axis is labeled R/Rhl and ranges from 0 to 6. The y-axis is labeled C/C(Rlim) and ranges from 0 to 1. Panel D: NGC 5904. The line graph shows the cumulative distribution functions of P1 and P2 stars. The x-axis is labeled R/Rhl and ranges from 0 to 6. The y-axis is labeled C/C(Rlim) and ranges from 0 to 1. Panel E: NGC 6101. The line graph shows the cumulative distribution functions of P1 and P2 stars. The x-axis is labeled R/Rhl and ranges from 0 to 6. The y-axis is labeled C/C(Rlim) and ranges from 0 to 1. Panel F: NGC 6205. The line graph shows the cumulative distribution functions of P1 and P2 stars. The x-axis is labeled R/Rhl and ranges from 0 to 6. The y-axis is labeled C/C(Rlim) and ranges from 0 to 1.
This variety in radial distributions of P1 and P2 suggests that some internal dynamics shaped the present-day structure of GCs. Since binary–single star scattering is a prevalent cause of stellar population heating and ejections (see, e.g. Heggie & Hut Reference Heggie and Hut2003; Binney & Tremaine Reference Binney and Tremaine2008), we test whether massive binaries in GC cores could drive early redistribution or inversion of P2 stars.
2. Methods
To gain insights into the mixing capabilities of massive binary stars inside star clusters, we study a set of toy-models — i.e. our initial conditions are intentionally simplified to isolate the effects of the binary–single star interactions in the cluster core. In our follow-up paper (Pavl k et al. 2025), we expand this study to more realistic star clusters of various masses, radial profiles, and primordial binary star properties. Specifically, here we initialise all stars on circular orbits, so that their radial motion early in the evolution would be mostly affected by the binary–single star interactions and not by the random orientation of their orbits. We also adopt a uniform density distribution of stars to filter out rapid relaxation processes in the core.
Each cluster has ten thousand equal mass stars with
 $1\,M_\odot$
and either zero, one, or ten binaries with
 $30\,M_\odot$
components, circular orbits, and semi-major axes of 5 au. The masses of binaries are derived from the typical gravitational-wave sources, assuming they would be represented by black holes in real GCs. We label the single low-mass stars by their initial positions as ‘P2’ (below the quarter-mass radius) and ‘P1’ (everything else). We do not count the binaries towards either population. We average our results over ten random realisations of each model.
3. Results
We study the redistribution of P1 and P2 using their projected cumulative radial distribution functions, C(R). From these we calculate the
 $A^+$
parameter (Alessandrini et al. Reference Alessandrini, Lanzoni, Ferraro, Miocchi and Vesperini2016).
 \begin{equation} A^{+}_{R\mathrm{lim}} = \frac{1}{R_\mathrm{h}} \int_0^{R_\mathrm{lim}}{\left[ \frac{C_\mathrm{P1}(R)}{C_{\rm P1}(R_\mathrm{lim})} - \frac{C_\mathrm{P2}(R)}{C_{\rm P2}(R_\mathrm{lim})} \right] \mathrm{d} R},\end{equation}
where
 $R_\mathrm{lim}$
is the chosen limiting radius for normalisation. In Fig. 2, we use
 $R_\mathrm{lim} = 1\,R_\mathrm{h}$
for the central region,
 $4\,R_\mathrm{h}$
to compare with observations, and
 $10\,R_\mathrm{h}$
to include most of the cluster. In the models (Fig. 2), we scale
 $R_\mathrm{lim}$
by the projected half-mass radius, while the radial ranges of the observations (Fig. 1) are scaled by the half-light radii,
 $R_\mathrm{h[}l]$
; however,
 $R_\mathrm{h=} R_\mathrm{h[}l]$
in equal-mass star clusters. The dynamical age of the modelled and observed clusters is expressed in terms of their present-day half-mass relaxation time. In the modelled clusters with N stars and the total mass M, this is in projection (e.g. Spitzer & Hart Reference Spitzer and Hart1971; Binney & Tremaine Reference Binney and Tremaine2008).
 \begin{equation} \tau_\mathrm{rh\approx} \frac{0.138\,N}{\ln{(0.4 N)}} \sqrt{\frac{R_\mathrm{h}^{3}}{GM}}.\end{equation}
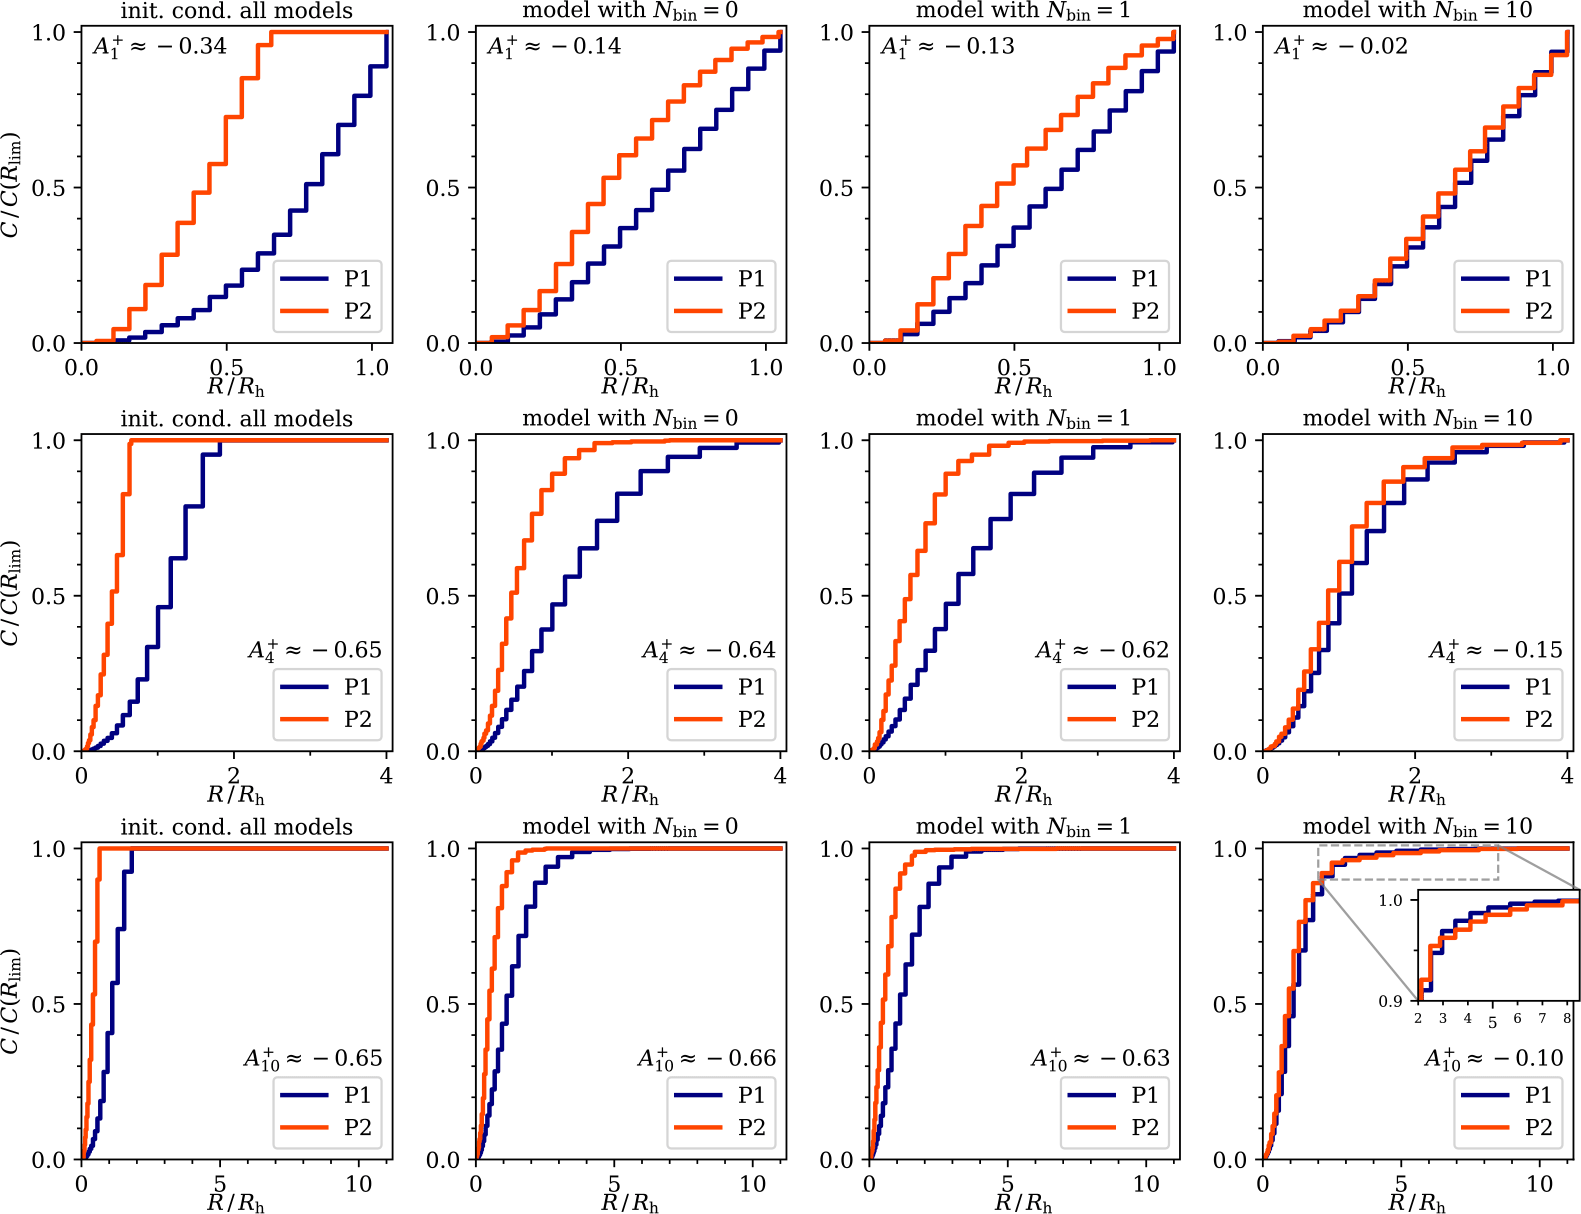
Cumulative distribution functions of P1 and P2 stars and their corresponding
 $A^+_{R{\rm lim}}$
values in our cluster models. Each row corresponds to a different projected radial range,
 $R_\mathrm{lim}$
. The left-hand column shows the initial conditions, the columns on the right each show the evolved models (each containing a different number of binaries) at
 $2\,\tau_\mathrm{rh}$

In Fig. 2, we plot the initial conditions of our models in the left-hand column and their evolved states at
 $2\,\tau_\mathrm{rh}$
in the right-hand panels (to be comparable with the observed dynamically-young GCs). In the top row of this figure, we see that the initially separated populations fully mix in the region up to
 $1\,R_\mathrm{h}$
in the model with ten binaries (
 $A^+_1\approx-0.02$
). The radial redistribution of P1 and P2 is lower in the models with one or no binary (and the difference between these two models is negligible). Even in the regions up to 4 or
 $10\,R_\mathrm{h}$
(middle and bottom row of the figure), the model with ten binaries appears mixed. We can even see a hint of inversion between 3 and
 $8\,R_\mathrm{h}$
(see the zoomed-out plot in the bottom-right panel). We do not see mixing or any signs of inversion at these radial scales in the models with one or zero binaries.
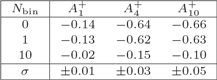
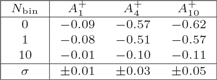
We list all values of
 $A^+$
at the evolutionary times
 $2\,\tau_\mathrm{rh}$
and
 $4\,\tau_\mathrm{rh}$
in Tables 1 and 2, respectively. From these and the figures above, we see that our simple models do not exhibit strong inversion (
 $A^+\gt0$
) as in the case of the observed cluster NGC 6101. However, already at
 $2\,\tau_\mathrm{rh}$
, the models with ten primordial binaries are comparable to the mixed GCs NGC 4590, 5053, 5904, or 6205. In turn, the models with a lower binary count are similar to the P2-centrally-concentrated NGC 5024. The level of P1/P2 mixing increases with the evolutionary time in our models (cf. Leitinger et al. Reference Leitinger, Baumgardt, Cabrera-Ziri, Hilker and Pancino2023; Leitinger et al. Reference Leitinger, Baumgardt and Cabrera-Ziri2025). We may also compare the two tables and see that
 $A^+$
usually decreases, except for the model with ten binaries, where its value stays almost the same (within the uncertainties).
The mean values of
 $A^+$
at
 $2\,\tau_\mathrm{rh}$
and their uncertainties (see also Fig. 2).

Table 1 Long description
A table comparing values of A+ at different evolutionary times and binary counts. The table has four rows and four columns. The columns are labeled N bin, A+ 1, A+ 10, and A+ 100. The row labels are 0, 1, 10, and σ. The values in the table are as follows: Row 0: N bin, 0; A+ 1, -0.14; A+ 10, -0.64; A+ 100, -0.66. Row 1: N bin, 1; A+ 1, -0.13; A+ 10, -0.62; A+ 100, -0.63. Row 10: N bin, 10; A+ 1, -0.02; A+ 10, -0.15; A+ 100, -0.10. Row σ: N bin, σ; A+ 1, 0.01; A+ 10, 0.03; A+ 100, 0.05.
The mean values of
 $A^+$
at
 $4\,\tau_\mathrm{rh}$
and their uncertainties.

Table 2 Long description
A table comparing mean values of A+ at 4τrh and their uncertainties. The table has 4 rows and 4 columns. Column headers are N bin, A+1, A+2, and A+10. Row labels are 0, 10, and σ. Row 1: N bin, 0; A+1, -0.09; A+2, -0.57; A+10, -0.62. Row 2: N bin, 10; A+1, -0.08; A+2, -0.51; A+10, -0.57. Row 3: N bin, σ; A+1, 0.01; A+2, 0.03; A+10, 0.05.
4. Conclusions
Our preliminary numerical analysis shows that massive binary stars (presumably black holes) can cause mixing of stellar populations inside a star cluster. We investigate this mechanism further — both theoretically and numerically — in Pavl k et al. (2025).
This research used computational resources from e-INFRA CZ (project ID:90254), supported by the Ministry of Education, Youth and Sports of the Czech Republic; and the computational cluster Virgo at the Astronomical Institute of the Czech Academy of Sciences. V.P. is funded by the European Union’s Horizon Europe and the Central Bohemian Region under the Marie Skłodowska-Curie Actions – COFUND, Grant agreement ID:101081195 (“MERIT”). V.P. also acknowledges support from the project RVO:67985815 at the Czech Academy of Sciences. E.I.L. acknowledges support from the ERC Consolidator Grant funding scheme (project ASTEROCHRONOMETRY, https://www.asterochronometry.eu, G.A. n. 772293). A.B. acknowledges support from the Australian Research Council (ARC) Centre of Excellence for Gravitational Wave Discovery (OzGrav), through project number CE230100016. M.H. acknowledges financial support from the Excellence Cluster ORIGINS which is funded by the Deutsche Forschungsgemeinschaft (DFG, German Research Foundation) under Germany’s Excellence Strategy – EXC 2094 – 390783311. A.J.W. has received funding from the European Union’s Horizon 2020 research and innovation programme under the Marie Skłodowska-Curie grant agreement No 101104656 and the Royal Society’s University Research Fellowship, reference URF/R1/241791.
 Rh[l]
 A4+
 4.27Rh[l]
 ARlim+
 Rlim
 2τrh
 A+
 2τrh
 A+
 4τrh


