Introduction
The use of paper as a novel device platform has gained increasing interest during the last decade with an emphasis on paper-based microfluidic diagnostic applications. Paper-based fluidic devices are low cost, easy to use, and disposable when compared to their classical counterparts constructed from glass or silicon. Reference Whitesides1 Advances in fabrication techniques as well as novel methods for manipulating fluid streams within the paper sheet exhibit promising high levels of multiplexing and greater assay diversity than existing simple paper-based dipstick tests. Reference Rolland and Mourey2
Nevertheless, a closer look at the current literature in paper-based microfluidics presents a rather clear picture—although a “diagnostics for all” is certainly a valid goal to be achieved, and there have been a large number of interesting platforms introduced by materials scientists, chemical engineers, and physicists to date, the number of ready-to-use devices in the market is limited. Unraveling the causes that limit development of paper-based microfluidics may reveal needs that must be addressed for successful design of a paper-based device. These include:
-
1. The paper material itself. It provides the necessary open porous structure to transport liquids by capillary action. What do we know about paper? Does it matter whether we take ordinary filter paper off the shelf or should it be a more sophisticated paper substrate instead? What is the role of the chemical and morphological constitution of the paper material? Does the origin of the paper fibers, the fiber thickness, or the sheet porosity of the paper matter, and how?
-
2. The definition of hydrophobic barriers. Such barriers are needed to confine fluid flow inside locally defined areas. Among the issues in the design of paper-based microfluidic devices, the formation of such barriers (e.g., by wax printing or any other hydrophobic substance) may be considered well understood and a number of recent reviews have carefully summarized the various techniques in detail. Reference Li, Ballerini and Shen3–Reference Liana, Raguse, Gooding and Chow5
-
3. The type of analyte (e.g., biomarker) to be detected. It defines the type of chemical-sensing elements to be immobilized in the paper structure. Examples range from DNA to proteins (e.g., antibodies) and to various molecules. What is the most efficient immobilization strategy? A large number of different demonstration devices have been reported to date and have been addressed in other reviews. Reference Yetisen, Akram and Lowe4,Reference Liana, Raguse, Gooding and Chow5
-
4. Control of capillary fluid flow. Controlled liquid transport is essential for obtaining reproducible results for the sensitivity of a paper-based sensor. If, for example, the fluid is transported within the paper at a too high rate, the analyte to be detected may not reach the sensing sites and thus will not contribute to a detection signal. If the capillary-driven flow is too slow, the analyte may stick to the solid interfaces of the paper fibers (chromatography effect) before it reaches the detection zone, where again, it may not be detected (i.e., a “catch” of analytes, where an analyte chemically reacted with, e.g., an antibody). Since a paper-based diagnostic tool relies on an increased signal-to-noise ratio, reproducible and tailored fluid flow is crucial for any paper-based microfluidic sensor. Reference Li, Ballerini and Shen3
In the following, we focus on recent developments specifically addressing challenges (1) and (4) from the list, respectively.
The paper substrate
Paper is a lightweight, highly porous, flexible, and foldable material that consists of isotropically oriented cellulose fibers in contact with each other. Paper has been used for more than 2000 years as a material for writing, printing, drawing, or packaging, and paper fabrication is currently one of the most optimized industrial processes. From a materials perspective, paper offers unique properties that make it a sophisticated material of high interest for use in the design of diagnostic tools.
Paper consists of renewable cellulose; the preparation of highly porous fiber mats with low densities is simple when compared to woven materials (e.g., textiles). In addition, cellulose-based fiber mats show almost no thermal expansion, which opens the door to a variety of chemical modifications, leading to changes in the hydrophilicity, permeability, or reactivity of the material. Reference Liana, Raguse, Gooding and Chow5,Reference Bracher, Gupta and Whitesides6 At present, a large number of different paper grades is available to researchers, and the paper material can be chosen based on the fabrication method used for the development of paper-based microengineered devices and the intended applications for the system. Reference Liana, Raguse, Gooding and Chow5 Among the different paper grades, filter paper is often used for the development of paper-based microfluidic platforms, because it consists of pure cellulose fibers typically derived from cotton linters (cotton linters are fine, silky fibers that adhere to the cotton plant seeds after ginning). In addition, this type of pulp has small amounts of other polysaccharides (i.e., so-called “hemi-celluloses”) and lignin. Lignin consists of chromophores, and thus, high lignin concentrations can lead to a discoloring and potential self-destruction of the paper sheet. Reference Yetisen, Akram and Lowe4 Hence, paper that consists of nearly 100% cotton is desirable for diagnostic applications. Reference Yetisen, Akram and Lowe4
In particular, Whatman No. 1 filter paper has been used extensively by many researchers for designing microfluidic papers. Reference Liana, Raguse, Gooding and Chow5,Reference Dungchai, Chailapakul and Henry7–Reference Böhm, Carstens, Trieb, Schabel and Biesalski11 Whatman No. 1 is a standard-grade filter paper that is commercially available with porosities between 0.5 and 0.8. The latter results in medium flow rate and retention. Reference Liana, Raguse, Gooding and Chow5 Li et al. used Whatman No. 4 filter paper, a paper grade with comparatively large pore sizes of 20–25 µm. This yielded an increase in the speed of fluid penetration, even though swelling of cellulose fibers in an aqueous environment can “close” some of the medium-size pores (pore diameter approximately 11 µm). Reference Li, Ballerini and Shen3,Reference Liana, Raguse, Gooding and Chow5,Reference Böhm, Carstens, Trieb, Schabel and Biesalski11,Reference Li, Tian, Garnier and Shen12 This swelling has not been studied in detail, and the influence of fiber-swelling on capillary transport remains largely unknown.
Böhm et al. used Whatman No. 1 and Roth A15 filter paper, and both paper grades were compared to control capillary-driven fluid flow. Reference Böhm, Carstens, Trieb, Schabel and Biesalski11 Although the morphological parameters were similar for both in terms of chemical identity (both filter grades are made from cotton linters) and porosity (i.e., overall free volume), significantly different flow rates were observed for the two. This was attributed to differences in the pore-size distribution of both paper grades. Note, the pore diameter of Whatman filter paper is approximately 11 µm, and the pore diameter of Roth 15A is approximately 4.6 µm. Reference Böhm, Carstens, Trieb, Schabel and Biesalski11 It was concluded that off-the-shelf filter paper makes it difficult to obtain reasonably reproducible results for capillary flow. The group also showed that reproducible flow can be tailored by engineering the paper substrate itself, as will be further discussed.
Besides filter paper, the use of other paper grades such as glossy paper (a flexible substrate made from cellulose fibers blended with an inorganic filler) has been reported. Reference Liana, Raguse, Gooding and Chow5 Typical fillers used in paper manufacturing range from calcium carbonate to kaolin or titanium dioxide and other inorganic pigments. Glossy paper can be considered a good substitute for filter paper, especially when the paper surface is modified, due to its relatively smooth surface. Reference Liana, Raguse, Gooding and Chow5,Reference Arena, Donato, Saitta, Bonavita, Rizzo and Neri13 However, in-depth studies on capillary-driven flow in glossy paper have not yet been conducted.
Finally, nitrocellulose sheets have been used extensively, both in research and in technology development. Reference Lu, Shi, Qin and Lin14–Reference Fu, Ramsey, Kauffman, Lutz and Yager16 Nitrocellulose membranes provide a narrow pore-size distribution (the pore size of nitrocellulose membranes is typically similar to those for standard filter paper grades), which results in a reproducible liquid flow within the porous network. However, the use of well-established modification techniques, such as wax printing, seems to be difficult, in particular, for nitrocellulose membranes, because penetration of hydrophobic wax into nitrocellulose membranes is slow and incomplete as compared to filter paper. Reference Liana, Raguse, Gooding and Chow5 Furthermore, hydrophobic nitrocellulose membranes tend to bind biomolecules nonspecifically, including proteins Reference Fenton, Mascarenas, López and Sibbett17 and DNA, Reference Cretich, Sedini, Damin, Pelliccia, Sola and Chiari18 resulting in poor reproducibility and low sensitivity (e.g., detection limit). Finally, nitrocellulose membranes always need additional support for structural integrity, such as thin plastic foils, because of the limited chemical and thermal stability.
Splitting and mixing in microfluidic paper
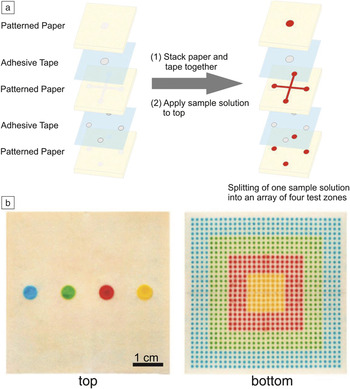
A number of techniques have recently been developed with the goal of achieving precise control of the fluid stream inside the paper network. Reference Rolland and Mourey2 Examples include splitting, mixing, filtration, or controlled delay of a fluidic sample in microfluidic papers. The splitting of a sample solution into multiple, separate fluid streams offers the possibility to concurrently detect various analytes from one sample solution, even for small volumes. Reference Rolland and Mourey2 Khan et al. have developed a device that allows simultaneous detection of different blood types from a single whole-blood sample by utilizing two-dimensional (2D) splitting. Reference Khan, Thouas, Shen, Whyte and Garnier19 Martinez et al. developed a microfluidic device that is capable of three-dimensionally (3D) splitting a fluidic sample solution with microliter volume into multiple fluid streams. Reference Martinez, Phillips and Whitesides20 The microfluidic device was fabricated by multiple stacking of microstructured paper sheets with double-sided adhesive tape between the sheets. Note, “3D” often refers to multilayered paper stacks, whereas because of its flat, anisotropic structure, a 2D device often refers to a single paper sheet. The multiple stacking of paper sheets allows vertical splitting of the sample solution into detection arrays with individual detection zones ( Figure 1 ). Reference Martinez, Phillips and Whitesides20
Three-dimensional (3D) micropaper-based analytical device (μPAD) capable of distributing fluids into arrays of detection zones. (a) Splitting of a sample solution into separate, multiple fluid streams by 3D stacking of patterned paper and adhesive tape. (b) Top and bottom photographs of a μPAD that distributes ∼100 μL of each fluid into 1024 detection zones. Adapted with permission from Reference Martinez, Phillips and WhitesidesReference 20. © 2008 National Academy of Sciences.

Mixing has also been studied in paper-based microfluidic systems. Reference Rolland and Mourey2 Yager and co-workers investigated the fluid transport and mixing of two fluid streams in a nitrocellulose paper-based flat y-shaped mixer consisting of two intersecting channels. Reference Osborn, Lutz, Fu, Kauffman, Stevens and Yager21 The flat y-mixer was used to achieve rapid sample dilutions in the paper network. Carrilho et al. investigated the mixing behavior of fluids in paper-based microarray plates as a preliminary experiment for the development of paper-based enzyme-linked immunosorbent assays (ELISA). Reference Carrilho, Phillips, Vella, Martinez and Whitesides22 ELISA is a widely used biochemical assay that utilizes antibodies and a color change to identify certain substances. Rezk et al. utilized a convective actuation mechanism using 30 MHz acoustic waves to perform fast and consistent mixing inside paper-based microfluidic channels. Reference Rezk, Qi, Friend, Li and Yeo23 The mixing speed and efficiency were measured and compared with capillary-driven, passive mixing inside the intersecting channel. They found that the passive mixing (i.e., diffusion within the paper pores) of fluid streams in a paper network is strongly dependent on the texture and fiber alignment inside the paper sheet as well as whether backflow occurs. Backflow leads to poor control of the mixing behavior.
Whitesides and co-workers recently investigated pressure-driven mixing of two fluid streams by carving a serpentine channel (consisting of repeating c-shaped channel units) into omniphobic paper (i.e., paper that repels different organic liquids [besides water]) using a graft-cutting tool. Reference Glavan, Martinez, Maxwell, Subramaniam, Nunes, Soh and Whitesides24 The repeating c-shaped units are able to induce mixing of the two adjacent fluid streams due to the introduction of advection and passive enhancement of the mixing at the point where individual fluid streams meet inside the channel. The chaotic advection is based on the consecutive generation of vortices in the serpentine-curved microchannel. Reference Glavan, Martinez, Maxwell, Subramaniam, Nunes, Soh and Whitesides24
Separation of capillary-driven fluids in microfluidic paper
Filtration is another important “second-order” technique for the control of fluid transport. Most biological samples (e.g., blood) require pre-analysis steps for preparation of the fluid sample. For example, blood cells need to be separated from plasma prior to analysis, or they may interfere with the colorimetric signal to be detected. Reference Songjaroen, Dungchai, Chailapakul, Henry and Laiwattanapaisal25
Songjaoren et al. developed a device that can be used for such separations by combining a commercially available blood-separation membrane (filter) made from glass fibers (Whatman LF1, MF1, VF1, and VF2) with patterned filter paper. Reference Songjaroen, Dungchai, Chailapakul, Henry and Laiwattanapaisal25 Yang et al. introduced another method for the separation of red blood cells from blood plasma in a single paper sheet. Reference Yang, Forouzan, Brown and Shevkoplyas26 In their approach, the plasma separation zone, located in the center of the paper device, was modified with agglutinating antibodies (Seraclone anti-A,B [AB03] clones). A droplet of blood was placed into the plasma-separation zone. The blood cells agglutinated and remained in the separation zone, whereas the blood plasma was transported to defined detection zones of the device, where specific reagents were deposited for sensing the concentration of glucose in the plasma.
Delaying and speed-up of fluid flow in microfluidic paper
For many applications (e.g., rate-dependent assays such as immunoassays or enzymatic reactions), it is desirable to control or delay the fluid streams at a specific geometric region within a microfluidic device. Reference Rolland and Mourey2 Jahanshahi-Anbuhi et al. introduced a simple method to control fluid transport inside microfluidic papers by sandwiching the paper channel between two polyester films. Reference Jahanshahi-Anbuhi, Chavan, Sicard, Leung, Hossain, Pelton, Brennan and Filipe27 The flow rate could then be accelerated by more than 10× as compared to the capillary flow through a noncovered paper channel. This finding was explained in terms of deformation of the flexible polymer film by capillary forces and the formation of a wedge at the liquid front. Fu et al. showed that control of fluid transport within a paper network could be achieved by changing the width (contraction or expansion) or length of the paper strip ( Figure 2 ). Reference Fu, Ramsey, Kauffman, Lutz and Yager16 During wet-out, the dry paper strip is brought into contact with a fluid reservoir. The fluid then wets the paper in hydrophilic regions (i.e., the channel) and is transported into the dry channel by capillary forces.
(a) Transport of fluids (from bottom to top) during wet-out for uniform-width (D, E) and sudden-expansion (A, B, C) strip geometries. For a sudden-expansion strip, the fluid front moves more slowly in the greater-width segment as compared to if it had continued in a constant-width strip (bottom image). The plot shows distance versus square root of time (
 $\sqrt t$
) for strips A–D. (b) Transport of fluids during wet-out for strips with a sudden contraction of the strip width. The plot shows the distance moved by the fluid front as a function of
 $\sqrt t$
in the first segment and distance versus (
 $\sqrt {{t_1}}$
+
 $\sqrt {t - {t_1}}$
) in the second segment for each strip (t
1, the time for the fluid front to reach the end of the first segment). Fluid front moves the fastest for the configuration in which the two lengths are closest to being equal, strip B (middle image). The data indicate that fluid-front displacement in the smaller-width segment follows a Washburn equation
Reference Washburn32
in terms of the relative time since the fluid front passed the segment transition, with a slope that is similar to the Washburn slope in the wider segment. Adapted with permission from Reference Fu, Ramsey, Kauffman, Lutz and YagerReference 16. © 2011 Springer.

Geometric control of fluid flow in microfluidic paper
Additional strategies to control the velocity of fluid imbibition in microfluidic paper involve the use of channels (defined by hydrophobic barriers) featuring different geometric widths. Songok et al. observed a significant decrease in the liquid front velocity once the fluid front reached the transition point from a narrow to a wider channel. Reference Songok and Toivakka28 This behavior was explained by mass conservation, and thus an increasing channel width (area) results in a decrease of the velocity of fluid transport. Interestingly, a transition from a wide channel to a narrow channel leads to a complete stop of fluid flow after the fluid is transported a certain distance within the narrow part of the channel. Reference Songok and Toivakka28 Other groups reported similar results. Reference Böhm, Carstens, Trieb, Schabel and Biesalski11,Reference Songok and Toivakka28–Reference Evans, Gabriel, Coltro and Garcia30 These observations are still not understood from a fundamental point of view. If fluid flow obeys a Lucas–Washburn (or Darcy) static viscous flow, Reference Lucas31,Reference Washburn32 the rate of fluid penetration should be independent of the channel width. Reference Hong and Kim33 Hence, for the previously mentioned examples exhibiting small channel widths, the Washburn model is unable to describe the capillary-driven flow in paper channels with wax boundaries sufficiently, and solving these issues remains challenging.
Hong et al. recently developed a model that investigates and describes the influence of hydrophobic (wax) barriers on fluid imbibition in paper channels. Reference Hong and Kim33 The authors demonstrated that the velocity of fluid transport is significantly reduced when in contact with wax boundaries. Hence the fluid imbibition depends on the channel width, because of retardation of the fluid at the hydrophobic boundaries. The developed model suggests that the observed fluid transport caused by the wax boundaries directly correlates with the contact angle at the edges of the paper channel. Reference Hong and Kim33 The authors were able to prove this hypothesis by covering the bare paper with various materials exhibiting different contact angles and successively examining the velocity of fluid transport. The researchers showed that the effects of the wax barriers were significant for channels with width ∼1 mm. Reference Hong and Kim33
Böhm et al. Reference Böhm, Carstens, Trieb, Schabel and Biesalski11 investigated the influence of the channel width in microfluidic papers using photoreactive polymers and lithography to accurately define channel widths as small as 1 mm, and their results were consistent with the previous study. Once the channel width became smaller than 2 mm, a significant drop in the capillary flow rate was observed, which was attributed to changes in the chemistry at the border of the channels. A detailed understanding of possible pinning effects at hydrophobic channel boundaries is still missing. Most interestingly, a channel width of 1 mm is often used for paper-based microfluidic devices, and as such, hydrophobic barriers might provide an additional parameter to adjust the velocity of fluid imbibition. Reference Hong and Kim33
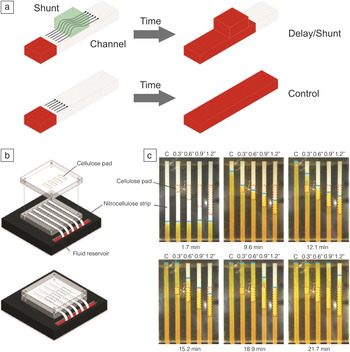
Yager and co-workers introduced a novel method for delaying fluid flow inside microfluidic paper that neither involves the release of chemicals nor requires any equipment to operate the system. Reference Toley, McKenzie, Liang, Buser, Yager and Fu34 A tunable delay of fluid penetration inside the paper network was achieved by diverting the fluid into a paper-based shunt made from cellulose that is brought into contact with the microfluidic channel ( Figure 3 ). Reference Toley, McKenzie, Liang, Buser, Yager and Fu34 The time delay could be tuned by controlling parameters such as the length and width of the shunt.
Control of fluid transport within microfluidic papers using cellulose-based shunts featuring different geometries (length). (a) Delay of fluid transport by diverting the fluid into a paper-based shunt brought into contact with the microfluidic channel. The time delay can be controlled by modulating the geometry of the shunt (i.e., length and width). (b) Schematic of the benchtop system used for measuring delays and (c) time-lapse images of the fluid flow through nitrocellulose strips in the absence of control (C) and in contact with 7.6-mm, 15.2-mm, 22.9-mm, and 30.5-mm shunts of cellulose (cellulose fiber sample pad). Dotted red lines indicate the location of the cellulose shunts and the blue lines indicate the fluid fronts. Longer shunts produce longer delays. Adapted with permission from Reference Toley, McKenzie, Liang, Buser, Yager and FuReference 34. © 2013 American Chemical Society.

Switching of a fluid flow—Fluid timers
Besides changing the geometry of the paper strip itself, a number of concepts for paper-based fluidic timers have been reported, including tools for switching off fluid flow by using source pads (i.e., reservoirs that provide the fluid for the paper channel) of varying fluid capacity capable of delivering defined volumes into a channel. Reference Fu, Kauffman, Lutz and Yager35,Reference Fu, Liang, Houghtaling, Ramachandran, Ramsey, Lutz and Yager36 Since capillary-driven fluid flow is dominated by interfacial phenomena (unlike pressure-driven flow), the speed of the fluid transport is sensitive not only to the channel geometry, but also to the chemical composition (surface energy) along the channel. Reference Songok and Toivakka28
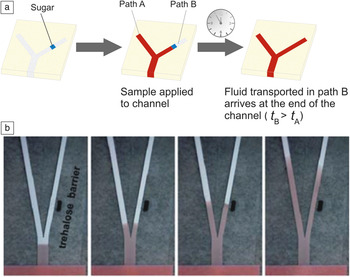
Fu et al. introduced the use of bridges made from sugar that dissolve to a permanent shutoff state after a well-defined volume of the sample solution has passed the bridge from a feeder. The volume that can pass the bridge before it dissolves can be tuned by changing the bridge geometry as well as the chemical composition of the bridge material. Reference Houghtaling, Liang, Thiessen and Fu37 In addition, fluidic timers that can be used to switch on fluid flow to a position downstream the channel at a defined time have been reported. Dissolvable sugar barriers were used to affect fluid transport by changing the viscosity in specific segments of the paper network ( Figure 4 ). Reference Fu, Lutz, Kauffman and Yager15,Reference Lutz, Liang, Fu, Ramachandran, Kauffman and Yager38
Control of fluid transport within microfluidic millimeter-wide channels using barriers consisting of sugar. (a) Delay of a fluid stream at a specific position downstream of the channel based on soluble sugar barriers. The delay of fluid transport depends on the initial extent of the barrier as well as the rate of the barrier dissolution. Note: t A and t B refer to the time of fluid flow in channel path A and B, respectively. (b) A dissolvable sugar (trehalose) barrier was created in the right fork of the device and produces a delay in the transport of fluid in the right fork. Images were taken at (left to right) ∼ 4, 19, 49, and 159 s, respectively, after introduction of fluid into the inlet. Adapted with permission from Reference Fu, Lutz, Kauffman and YagerReferences 15 and Reference Lutz, Liang, Fu, Ramachandran, Kauffman and Yager38. © 2010, 2013 Royal Society of Chemistry.

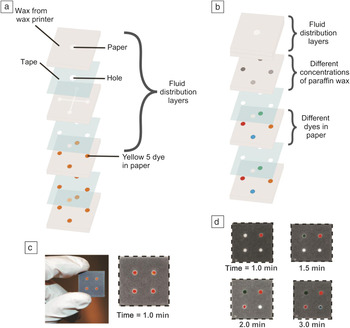
Songok et al. modified a commercially available paperboard (200 g/m2) with TiO2 nanoparticles in a roll-to-roll process, using a liquid flame-spray technique. Reference Songok and Toivakka28 This resulted in the formation of superhydrophobic properties for the paper. Subsequent irradiation of the modified paper sheets with ultraviolet (UV) light (and controlling irradiation time) allowed altering the contact angle of the modified paper over a wide range of values, due to the formation of OH-groups at the surface of the nanoparticles. Reference Songok and Toivakka28 By adjusting the surface energy gradient along the channel (i.e., the position of the hydrophobic stripe within the channel), the velocity of the fluid imbibition could be controlled over a wide range. Reference Songok and Toivakka28 Another group demonstrated the use of 3D paper-based fluidic timers as flow modulators Reference Noh and Phillips39,Reference Noh and Phillips40 based on insoluble blocking patches made from paraffin wax. The wetting property of the paper was modulated in a controlled fashion by applying different amounts of hydrophobic wax ( Figure 5 ).
Comparison of (a) an initial prototype of a 3D micropaper-based analytical device (μPAD) with (b) a 3D μPAD that contains meters. Reference Martinez, Phillips and Whitesides20 Each paper-based device consists of fused layers of patterned paper and micropatterned, double-sided adhesive tape. The images in (a–b) show an expanded view of the device to highlight the features in each layer. (c) Photograph of an initial prototype of a 3D μPAD that distributes 10 μL of water into four hydrophilic regions (red) of paper. The time required for water to pass from entrance to exit was 53 ± 6 s (number of measurements = 7). The dotted lines around the device mark the edges of the device. (d) Time-lapsed photographs of 3D μPADs with meters. The dyes used in the photographs are (counterclockwise from upper right) yellow 5, green dye, red 40, and blue 1. The wax concentrations are (counterclockwise from upper right) 0, 15.7, 31.4, and 47.1 μg μm–3. All measurements were taken at 25°C and 40% humidity. (c–d) Reprinted with permission from Reference Noh and PhillipsReference 40. © 2010 American Chemical Society.

Programmable paper-based microfluidic devices
The fabrication of programmable paper-based microfluidic devices has also been reported. These can be programmed by the user to mechanically control fluid penetration inside the paper-based channels. Reference Li, Zwanenburg and Liu29,Reference Martinez, Phillips, Nie, Cheng, Carrilho, Wiley and Whitesides41,Reference Liu, Li and Crooks42 Chen et al. reported a fluidic diode that promotes wicking in one direction, but not in the other direction. Reference Chen, Cogswell, Anagnostopoulos and Faghri43 The diode was fabricated by patterning hydrophilic areas with and without surfactants that are separated from each other by hydrophobic regions. Fluid transport occurs only from hydrophilic regions, where a surfactant was deposited (anode), to hydrophilic regions that do not contain surfactants (cathode). The change in the surface tension due to the presence/absence of the surfactant is the driving force that directs the fluid flow. Based on the fluid diode, the authors were able to fabricate functional circuits, including trigger and delay valves. A combination of the fluid diode and a delay valve was used to build up a circuit that allows for sequential delivery of fluids to a specific area within the device. Reference Chen, Cogswell, Anagnostopoulos and Faghri43
Whitesides and co-workers developed a “porous” valve by cutting channels inside an omniphobic paper and applying a pressure difference. Reference Glavan, Martinez, Maxwell, Subramaniam, Nunes, Soh and Whitesides24 The “porous” valve closes below a certain threshold pressure. When the applied pressure exceeds the threshold value (i.e., if the pressure difference is high enough to overcome the free energy of the hydrophobic surface of the pores), the valve opens, and water is forced through the pores of the paper sheet.
Control of fluid flow by paper engineering
Although significant progress in the design of paper-based fluidic timers has been achieved, all strategies introduced to date are based on the use of simple, commercially available filter papers or nitrocellulose papers. It should be noted that fluid transport inside a porous medium such as paper does not exclusively rely on the geometric dimensions or wetting properties of the pores inside the paper channel itself, but mainly depends on the intrinsic parameters of the paper substrate used such as the fiber source, fiber length and diameter, swelling of the fibers in an aqueous environment, and the fiber orientation within the paper sheet. In addition, the number of fibers per unit volume of the paper substrate (i.e., density of the paper sheet) is an important parameter that strongly influences the speed of fluid penetration.
Recently, the use of lab-engineered paper substrates for controlling the speed of fluid penetration within paper-defined channels was introduced. Reference Böhm, Carstens, Trieb, Schabel and Biesalski11 Paper sheets consisting of different fiber sources and pore sizes (i.e., porosities) have been designed and compared with commercially available filter papers. The results indicate that it is not trivial to accurately control fluid transport within paper-defined channels when using commercial filter papers due to the intrinsic presence of chemical additives that can influence the fluid transport, different fiber batches that are typically used to produce filter papers on a large scale, as well as chemical and mechanical fiber pretreatments, such as fiber beating, prior to the paper-making process. Customizable, lab-engineered paper sheets allow for accurate control of the constitution of the paper sheet itself, and potential side effects caused by chemical additives or fiber pretreatments can be suppressed or eliminated.
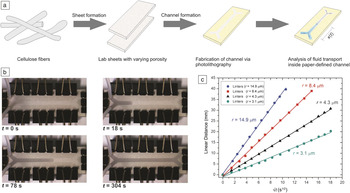
As illustrated in Figure 6 , the capillary flow inside chemically identical, tailor-made paper sheets can be controlled by varying the fiber density (i.e., the porosity) inside the sheets. Reference Böhm, Carstens, Trieb, Schabel and Biesalski11 Analysis of fluid transport in the channels of varying widths revealed a reduction in the flow rate if the channel was defined by hydrophobic barriers and the channel width was smaller than the length of the fibers. Knowledge of the fiber length inside the paper sheets is thus of great importance if precise and controlled fluid transport is to be achieved. These properties will become important for a number of applications for microfluidic paper materials where fluids need to be driven at defined speeds through capillary forces.
Control of fluid transport using lab-engineered paper substrates. (a) Lab sheets with different porosities were fabricated from cotton linter pulp, using conventional papermaking laboratory instruments. In addition, the prepared paper sheets were subjected to chemical modification via a photolithographic approach using photoreactive polymers to design small, millimeter-sized channels in the paper substrates. The fluid transport within the channels was analyzed via video streaming, and (b) individual data points of the one-dimensional position of the fluid front after a given time (t) were analyzed. Note, channel width here is about 4 mm, while the length of the complete channel is about 5 cm. (c) Comparison of the position, x, of the fluid front driven by capillary action along the channel as a function of t 0.5 for various cotton linter-based paper substrates with different fiber densities (i.e., pore sizes [r] given in the figure). By simply changing the pore size of the paper sheets, fluid flow can be tailored over a wide range. Adapted with permission from Reference Böhm, Carstens, Trieb, Schabel and BiesalskiReference 11. © 2014 Springer.

Summary
A major application for paper-based microfluidic systems is to serve as a platform for simple point-of-care diagnostics, food-quality control, and other low-cost, analytical devices. A number of promising demonstrators have been reported in the literature that focus on the use of such paper devices as a “diagnostic for all” tool. By examining which of these newly developed diagnostic tools has made it to the market and which of such demonstrators are truly available “for all,” the picture obtained is clear—only a few examples have been transferred to specific field studies. This stands in sharp contrast to the large number of research articles in this particular scientific field. Bottlenecks that have been identified and are still present with paper-based diagnostics concern the sensitivity of the readout as well as understanding capillary fluid flow. The latter comes down to the challenge of understanding, in more depth, paper as a material. Although this material has been a part of our daily lives for hundreds of years, and technology to produce paper in large quantities is highly optimized, there are a large number of open questions that are directly related to the complexity of the geometric structure and chemical constitution of paper sheets.
In the future, we will need to investigate and understand in detail how this material, which has pores of various length scales, will affect, for example, capillary-driven fluid transport. In a similar manner, we need to understand how surface chemistry tools can be used to avoid nonspecific interactions of analytes with the fibers and to increase sensitivity of diagnostic paper strips. In the future, understanding this complex material over all length scales, rather than trying to adapt a specific application to paper as a porous carrier, may be the key for a successful transfer of this traditional material into high-tech applications and for solving still-existing challenges for microfluidic paper-based diagnostic tools.
Acknowledgments
We acknowledge ongoing financial support from the Verband der Papierindustrie, Germany, and the Vereinigung Arbeitgeberverbände der Papierindustrie.

Alexander Böhm is an application scientist for molecular spectroscopy and microscopy at Thermo Fisher Scientific, Germany. He received both his MS degree in chemistry in 2010, and his PhD degree in the field of paper-based microfluidics in 2014, from the Technische Universität Darmstadt, Germany. From 2015 to 2016, he was a postdoctoral associate at the Technische Universität Darmstadt working on paper-based analytics. Böhm can be reached by email at alexander.boehm2@thermofisher.com.

Markus Biesalski has been a professor of macromolecular chemistry and paper chemistry at the Technische Universität Darmstadt, Germany, since 2008. He studied chemistry at the Johannes Gutenberg-Universität Mainz, Germany, where he received his degree in 1996. He then received his PhD degree from the University of Mainz and the Max Planck Institute for Polymer Research, Germany, in 1999. He was a postdoctoral researcher at the University of California, Santa Barbara, in the Materials Research Lab and the Department of Chemical Engineering. He then moved to the Universität Freiburg, Germany, as an assistant professor. Biesalski can be reached by phone at +49 6151 16 23720 or +49 6151 16 23721 or by email at biesalski@tu-darmstadt.de.