I still remember my first day of teaching as a new assistant professor at the University of Iowa. As I headed down from my office on the third floor of Schaeffer Hall carrying my books and notes, I was nervous. I had no idea what to expect in the classroom. Thirteen first-year graduate students were waiting for their required introduction to statistics course. In retrospect, I am sure they did not know what to expect either. Iowa had a reputation for providing very good training in quantitative methods, and I was taking over the course from Becky Morton. I figured my heavily mathematical graduate training during my PhD studies at Caltech had prepared me well to cover the material at an appropriately technical level. It had not provided, however, much in the way of classroom experience. Still, the butterflies in my stomach confirmed my uncertainty: Was I prepared enough? Did I know the material well enough? Would the students ask difficult questions that I could not answer?
My fears were largely unfounded, as I suspect is typical in these situations. It turned out that my graduate training provided me with a much better background in methods than a first-year graduate student, even at Iowa. Nevertheless, it did not necessarily prepare me to teach it effectively to these students. My original plan that year was to teach the material I knew, the way I knew it. It seemed the safest approach and—not irrelevant for a first-year assistant professor—the easiest. However, it became clear over the course of the semester that it was not the best approach for the students I was teaching. Too many of them were unprepared for and disoriented by the heavily mathematical approach. It heightened their own anxieties and reinforced the idea that studying or learning methods was only for a select few with good mathematical skills.
The course went fine, but I knew I needed to make changes for the next year—and that set off a long process of gradual changes in how I approach teaching graduate methods that has evolved into a coherent philosophy.Footnote 1 I now focus on engaging students with the material in various ways to engage multiple learning styles and provide useful tools for students with different backgrounds and different expectations for how methods will fit into their career—academic or otherwise.Footnote 2 Since that first semester, I have taught dozens of undergraduate and graduate courses at Iowa, ranging from statistics to regression to maximum likelihood estimation (MLE) to various advanced topics; I have offered numerous half- and multi-day workshops at Iowa and at other institutions; and I have taught regularly in social science summer training programs. In the process, I have encountered hundreds of students from many disciplines with varied statistical backgrounds and wide-ranging learning objectives.
These experiences have taught me to provide multiple ways of understanding and learning the material. I therefore approach every method and estimator I teach from multiple perspectives and provide students with opportunities to interact with them from various perspectives: mathematical, intuitive, visual, engineering, and applied. This range reflects the different ways that students may utilize the material in the future. Despite my methods proselytizing, most students simply want to be able to apply these methods in the future. Perhaps a few will want or need to interact with them on a more technical level.
My main goals for students are that they understand when to apply a given method, why to apply it instead of common alternatives, and how to obtain and interpret estimates. Clearly incorporating these objectives into the syllabus and the weekly material helps students to see where their long-term goals fit in and how they can obtain the skills they want. I believe this is especially beneficial for students who lack a strong mathematical or statistical background and may not perceive initially how a methods course fits into their plans to study political science. It is important that the three main course objectives can be reached without mastering mathematical details—even though many students benefit from them. Some students will make sense of the math, others will make sense from the applications, and still others will make sense from the figures or intuition. Ideally, these perspectives work together and allow students to grasp the method and turn it around in their mind to see it in different ways to better understand the whole. Just as the intuition and visualizations can demystify the equations, so can the math sharpen the intuition or interpret the application.
My main goals for students are that they understand when to apply a given method, why to apply it instead of common alternatives, and how to obtain and interpret estimates.
In practice, how are these different approaches implemented? Typically, I start with a general intuition about where the method fits in the bigger picture and then quickly move to a review of the underlying math. As much as possible, I supplement the equations with pictures, analogies, metaphors, and examples. Following this, I move to a series of exercises to extract the meaning of the equations. This typically includes a lab session in which students generate data from the model and then apply the estimator. Underpinning this approach is the idea that if students cannot generate data from an estimator, then they do not fully understand how it works. In more advanced classes, students might program the likelihood themselves, which provides an opportunity to work with the details of the estimator and to see how it is implemented in software for estimation; in other settings, it might involve using an existing command or package.
The simulation process affords an opportunity to compare the results under the true data-generating process to those obtained from a “next-best” but less sophisticated estimator that ignores key features of the data. This often serves as the foundation for a Monte Carlo exercise in which students can compare more comprehensively the results across estimators. The value of Monte Carlo simulations has been seen across various disciplines including, among others, political science (Carsey and Harden Reference Carsey and Harden2013, Reference Carsey and Harden2015; Mooney Reference Mooney1997) and statistics (Sigal and Chalmers Reference Sigal and Chalmers2016). Those who are concerned that it might be too complex or technical should know that simple versions are used to teach middle-school children about probability (Braun, White, and Craig Reference Braun, Bethany and Craig2014). With more complicated methods, Monte Carlo often is the only way to determine differences among approaches. Simulations allow students to experiment with the underlying assumptions that govern the degree of difference between the correct model and the incorrect next-best model, often by varying the magnitude of a correlation, variance, or mean. Related exercises focus on generating predicted values with associated measures of uncertainty. Although existing software packages and commands exist to accomplish this, asking students to use the formulas to calculate predictions and simulation to capture the uncertainty provides an opportunity to interact with the data-generating process. We then take these lessons and skills to real-world data where the truth of our assumptions is not known to see how different estimators perform, how they may change our inferences, and how to address the inevitable complications of analyzing data.
To see how this fits together, this article describes how I teach the topic of nonrandom sample selection. I use this example because it is adaptable to all of the techniques that I described but also because I find it often is misunderstood. I typically cover this topic in our advanced methods course, which largely encompasses limited dependent variables and MLE. For this topic, students prepare by reading the relevant chapter in Long (Reference Long1997), one of the primary texts for the course. During lecture, I introduce Little and Rubin’s (Reference Little and Rubin2020) typology of missing data to provide context and intuition on different types of “missingness” and their consequences for estimating population and model parameters. We then move to a presentation of the probit selection and continuous outcome equations that combine to form a Heckman selection model (Heckman Reference Heckman1979). I focus on the key conditions that determine the presence and consequences of nonrandom sample selection: correlation between the errors and correlation or overlap in the independent variables from the two equations. Both must be present for biased slope coefficients to occur.
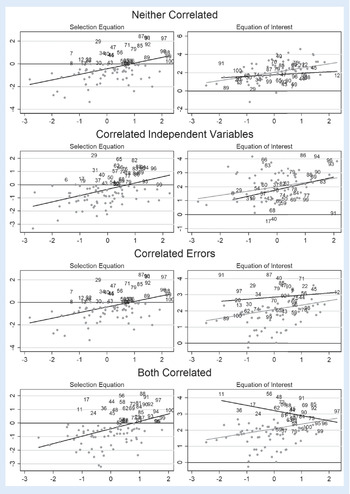
This is readily used for visualization to build intuition, as displayed in figure 1. Each row of plots shows the relationship between the selection equation’s independent variable and latent outcome (i.e., the left plot) and the equation of interest’s independent variable and outcome (i.e., the right plot). Observations in the scatter plots are colored black for cases that select and gray for cases that do not. Observations that select in are represented by identification numbers based on the order of the values of the selection-equation independent variable. The black lines show the linear fit for observed data and the gray lines in the outcome-equation column show the regression line among all cases, whether or not they are selected. With fully observed data, obtaining unbiased estimates of the coefficients in the continuous equation of interest poses no challenge. Deviations of the line estimated among observed cases show the consequences of different combinations of correlation between the independent variables and the errors, respectively.
Consequences of Variable and Error Correlations for Regression Estimates
Note: Graphs on the left side plot values of the selection-equation latent dependent variable against the selection-equation independent variable; those on the right side show the continuous outcome of interest against the independent variable for the equation of interest. Observations for which the outcome variable is observed are represented by numbers ordered by the value of the independent variable in the selection equation. Those not observed are represented by gray circles. Black lines represent the estimated linear relationship among observations included in the analysis—that is, all observations for the selection equation and those whose outcome variable is observed for the outcome equation. Gray lines in the plots for the outcome equation represent the estimated linear relationship among all observations—that is, whether or not the outcome would be observed.

The first row presents the case with correlation in neither the independent variables nor the errors. In this case, selection means that we randomly lose data points in the outcome equation; however, without correlation, the lost points are spread evenly across the cloud of all observations in the outcome equation plot. Note the lack of a pattern in the location of the numbered data points (other than the fact that they tend to be larger because such observations are more likely to select in as shown in the left plot). Under these circumstances, the main consequence is simply a decrease in observations that produces no bias. The second row shows how this changes when we add correlation (i.e., positive, for exposition) in the independent variables. Observations that do not select in have smaller values of the independent variable for selection, which translates into lost observations occurring more frequently for smaller values of the independent variable for the equation of interest. This is evidenced by the preponderance of larger case-identification numbers in the scatter plot for the equation of interest. However, removing these observations does not produce bias because it amounts to selecting on the independent variable, on which the regression model is explicitly conditioned. Note that fewer of the observed cases in the equation of interest come from lower values of the independent variable compared to the no-correlation case.
Switching to correlation in the error terms requires shifting our intuition from the horizontal axes to the distance between the predicted values and the observed values, which corresponds to the error terms. For large values of the variable in the selection equation, the size of the error does not matter much for whether an observation selects in. However, as that variable decreases, the value of the error begins to matter more until only observations with large values of the errors make it to the equation of interest. A positive error correlation means that we tend to lose observations in the equation of interest that lie below the true regression line. However, the lack of correlation between the independent variables means that the lost observations are distributed randomly across the horizontal axis in the equation of interest, as evidenced by the random location of the case-identification numbers in the right plot. The upward shift in the errors among the observed cases pulls the estimated sample regression line upward, biasing the intercept; however, the lack of association with the independent variable leaves the slope unaffected.
The final graph in figure 1 combines correlated errors with correlated variables. As in the case with only correlated independent variables, selection no longer removes observations equally across the horizontal axis. Combining this with correlated errors creates problems, however. Observations with large values of the independent variable in the selection equation almost always will be included in the equation of interest and therefore will have a full range of observed errors. In contrast, observations with small values of the selection-equation independent variable will appear only in the outcome equation when they have larger values of the error term. This induces correlation (negative in this example) between the selection-equation independent variable and the selection-equation errors among observations that select in. Recall that in this case, the errors and the independent variables are each correlated across equations. The induced correlation among selected observations works through these preexisting correlations to engender correlation between the independent variable and the error among observed cases in the equation of interest. These two features are evident in the right plot. First, correlated independent variables lead most of the observed cases to be associated with larger values of the independent variable. Second, for smaller and medium values of the independent variable, we observe cases that only lie well above the full-sample regression line in gray, whereas for larger values, we observe a better balance of cases above and below the line. Together, this leads to pronounced bias in the regression line among observed cases. In fact, the slope now has the wrong sign. This figure allows students to see that the selection process produces data that are not even representative of themselves: the changing range of observed values of the errors imposed by the selection process means that the outcome does not cover its full range for some values of its independent variable.
In the lecture component of this material, I present an explanation based on the two plots in the final row of figure 1. This provides an opportunity to pair the logic of the math in the two equations with the visualization of bias in the presence of both forms of correlation. Understanding the bias creates a parallel opportunity to build intuition about when nonrandom sample selection produces bias. The key insight is that selection makes the errors among observed cases unrepresentative of the full set of errors that might occur and that correlation in the independent variables leads to correlation between the error and the independent variable in the equation of interest—a clear violation of a key assumption of linear regression and MLE estimators.
In the lab session that follows, I ask students to work through a data-generating process that produces the results in each of the four cases represented in figure 1. At this point in the semester, they have learned about generating random variables, including from the multivariate normal distribution. The instructions define specific parameter values for the distribution of the errors and the independent variables as well as the equations to generate the selection equation and the equation of interest outcome variables. We start with the case with no correlations. With the data generated, students create graphs of the data for the equation of interest as in figure 1 and estimate the parameters of the equation of interest via a naïve linear regression model and again via the Heckman approach. Because we generated the data, we can compare the results obtained from estimating the outcome equation on the selected data against those from the full data—an opportunity not offered in real-world applications.
We proceed by changing the correlations between the independent variables and the errors one at a time, corresponding to the final three cases in figure 1. Students can see the consequences of ignoring selection and observe the Heckman model’s ability to correct for it. I then encourage them to experiment with the code. This can involve changing the magnitude and direction of the correlations, which will affect the direction and extent of bias in the naïve version of the equation of interest. It also can involve changing the relative contribution of the explanatory and error variables in the two equations because both also matter for this bias. Changing the parameters of the selection equation in a way that affects the proportion and mix of cases that select in also matters.
I follow this exercise with a homework assignment that directs students to estimate and evaluate the consequences of selection in a real-world example. I do so using replication data from an article published by a colleague (Lai Reference Lai2003). The assignment requires them to estimate the naïve and Heckman models and compare the results. Furthermore, they implement the Heckman approach through full information MLE and then again by working through the two-step procedure manually (i.e., by generating the inverse Mills ratio and including it in the equation of interest). I ask them to combine the results into a single, publication-quality table and compare the results.
I follow this basic structure for most of the methods topics and courses that I teach. The balance and level of math, visualization, intuition, simulation, and applied examples may change, but I usually include most of them. This recognizes and targets different modes of learning, providing all students an opportunity to gain some insight on a given topic. It also provides students with a toolkit for learning about and developing new methods. For example, several PhD students have used these pieces to construct methods articles to aid in interpreting, applying, or developing methods (e.g., Kreitzer and Boehmke Reference Kreitzer and Boehmke2016; Licht Reference Licht2011; Neiman Reference Nieman2015). However, it is in the increased appreciation for and understanding of quantitative methods that its value is most revealed. When students have less apprehension about properly applying and interpreting these methods, they make better choices in their own research, offer better suggestions to collaborators and colleagues, and convey more insight in the classroom.
The balance and level of math, visualization, intuition, simulation, and applied examples may change, but I usually include most of them. This recognizes and targets different modes of learning, providing all students an opportunity to gain some insight on a given topic.