doi: 10.1557/jmr.2019.254, Published by Materials Research Society with Cambridge University Press, 2 September 2019.
Due to technical error, several corrections to this article [Reference Catoor, Ma and Kumar1] were not properly processed before publication.
The correct affiliation for Catoor is Medtronic Inc., Corporate Science, Technology, and Clinical Affairs, Minneapolis, MN 55432, USA.
A footnote for Table I was omitted and should read: “The asterisks denote ‘runouts,’ i.e., specimens that did not fail after 10 million cycles.”
Throughout the paper, the phrase “upper and LPSs” should read “UPS and LPS.”
On page 3513, the final sentence of the first paragraph should read “Again, this observation is in agreement with the observations in the section on Type 2 cyclic loading–strain distribution as well as with those of Shaw and Kyriakids [26].” In the second paragraph with reference to the stress concentration in Fig. 8(a), the text “see arrows in” should be omitted, as there are no arrows present in the figure.
On page 3517 under point (iii), the phrase “austentite co-existing martensite transition zones” should read “austentite–martensite transition zones.”
In the final paragraph on page 3519, Duerig et al. should be replaced with Shamimi et al. (as in Ref. 37).
Corrected captions for Figures 7 and 9 are as follows:
Figure 7: Snapshots of the surface of specimen S1 at displacement minima and maxima during cyclic loading for both Type 1 (a, b) and Type 2 (c–e) cases. Frequency and displacement amplitude are indicated above each set of figures. In all figures, the austenite-martensite phase boundary is clearly visible. Reference ink marks were made to locate the phase boundary and follow its movement. Although there is little noticeable boundary motion in Type 1 (30 µm), the boundary migrates across macroscopic distances during Type 2 loading (60 µm) for all frequencies.
Figure 9: Crack initiation at the austenite-martensite transition zone for Type 2 loading at a displacement amplitude of 60 µm. (a) Specimen S5 loaded at 40 Hz. (b) S6 loaded at 1 Hz.
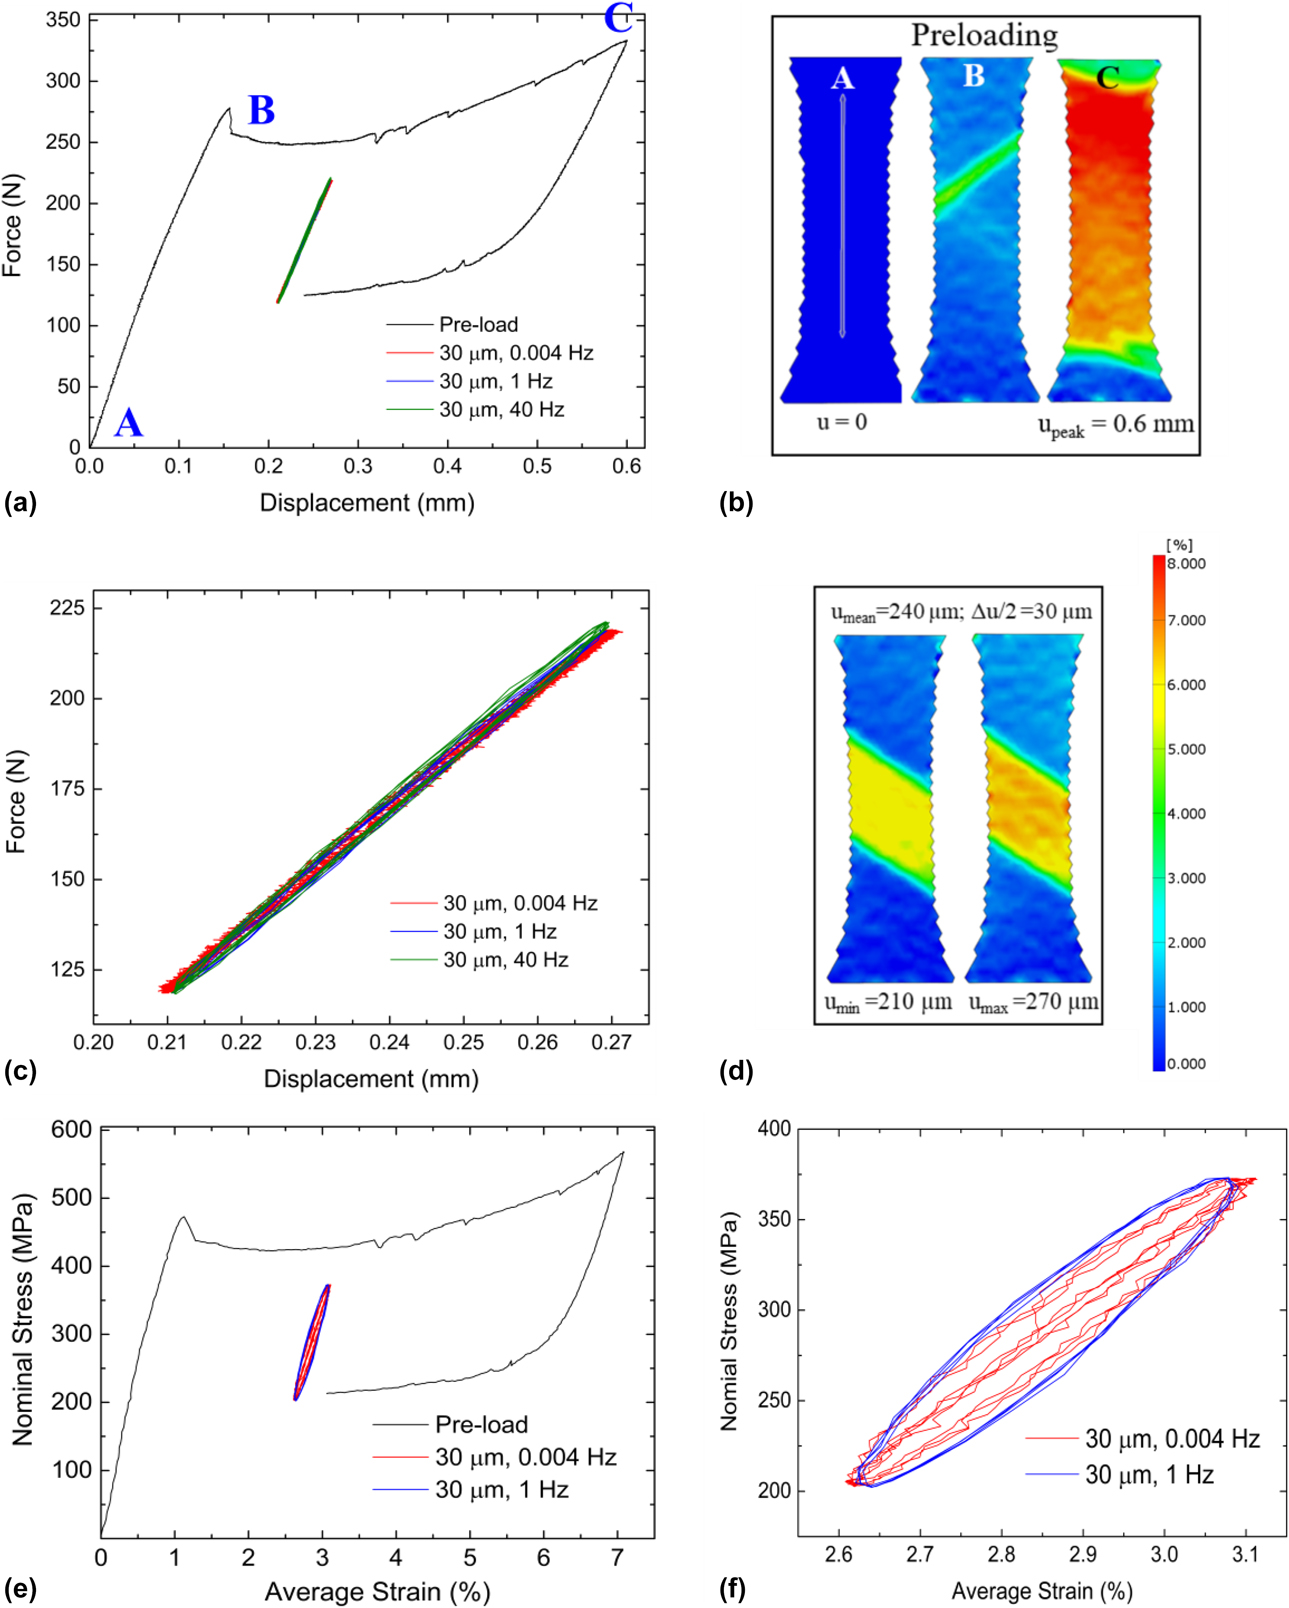
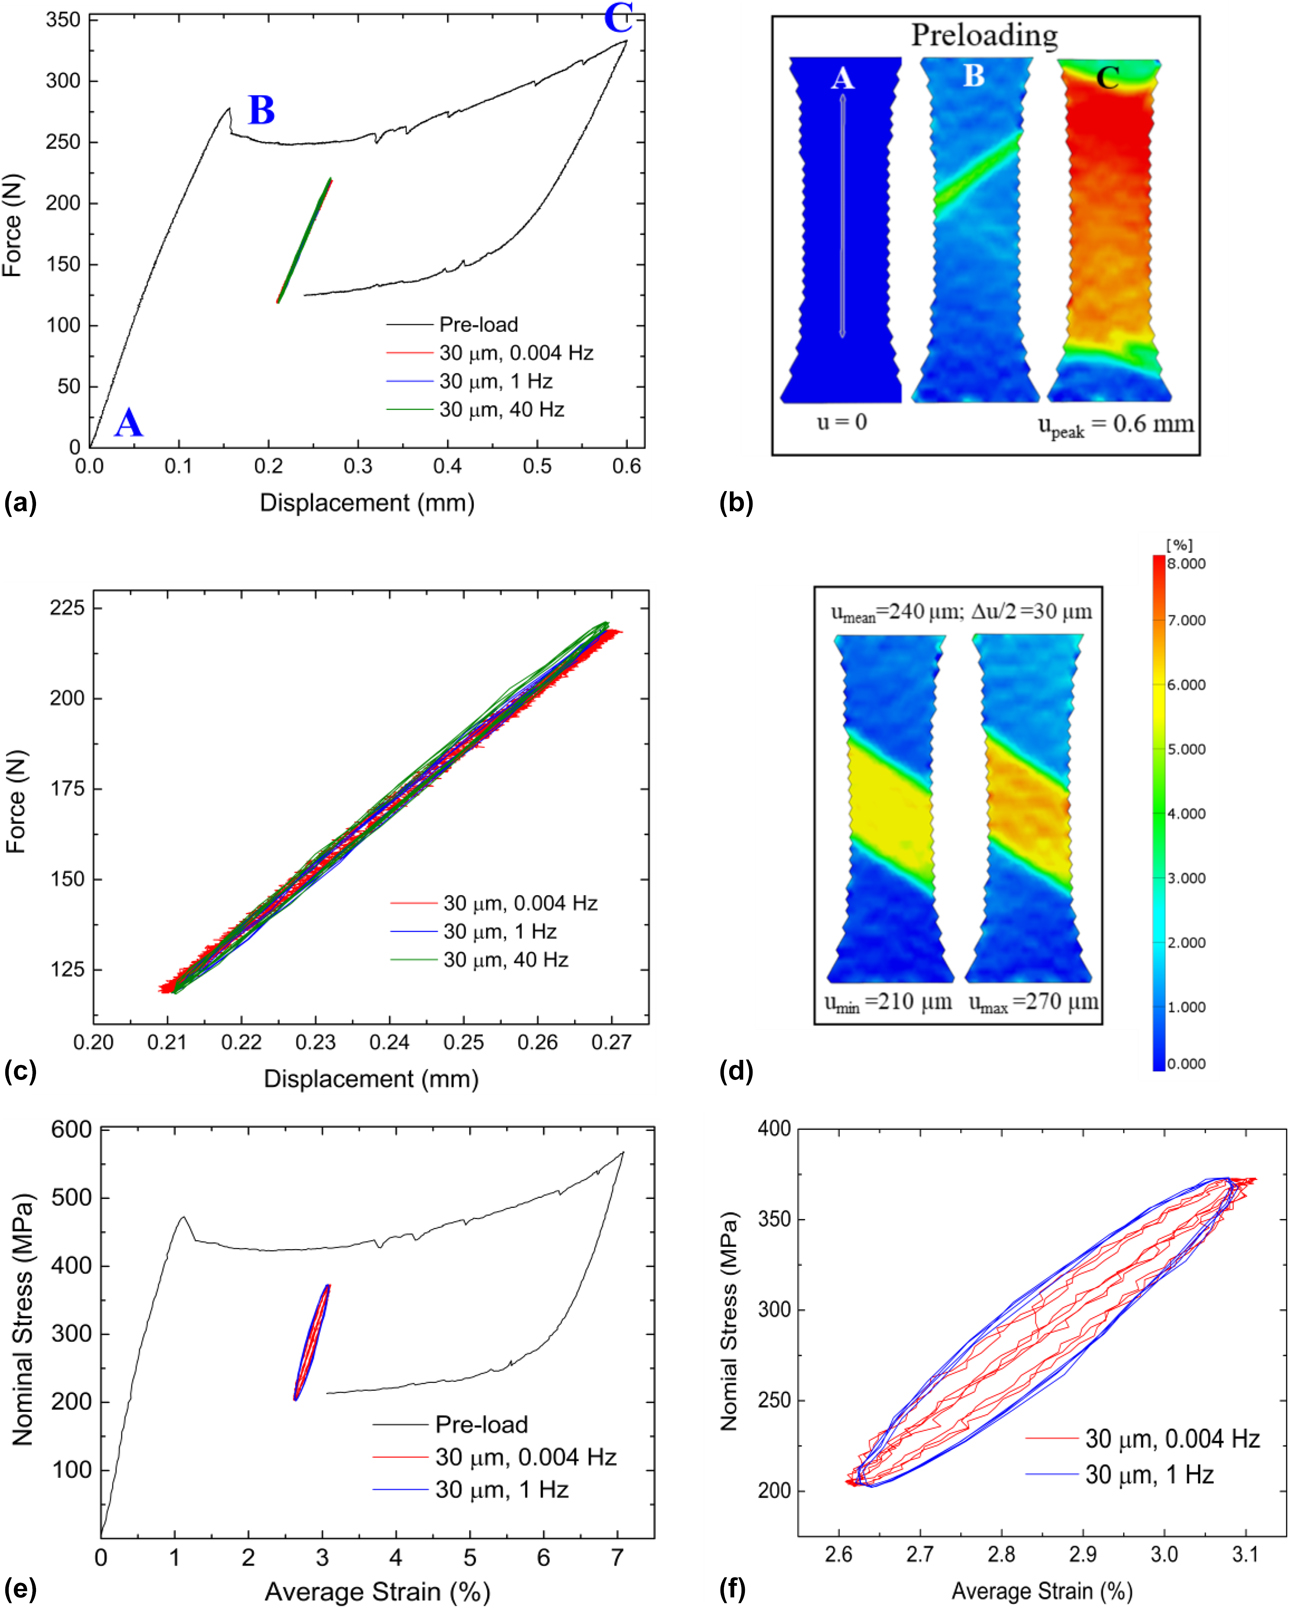
A revised Fig. 3 is replicated below, with a corrected caption.
Mechanical response during Type 1 loading. (a) Force–displacement curve for specimen S2 during Type 1 loading at 30 µm displacement amplitude. (b) Surface strain maps obtained by DIC during the pre-loading procedure at points A, B, and C marked on the force–displacement curve in (a). (c) Magnified view of only the cyclic portion of the force–displacement curve–note the insensitivity to cyclic frequency. (d) DIC strain maps at displacement minimum and maximum during cycling showing no observable change in martensite volume fraction. (e) Nominal stress–strain curves derived from load and DIC strain maps for 0.004 and 1 Hz. (f) Magnified view of the cyclic portion of the stress–strain curve in (e).
The publisher sincerely apologizes for the errors in publication.