

With the signing of the North American Free Trade Agreement (NAFTA) in 1994, the Mexican state opened up the country’s protectionist economy to its Canadian and U.S. counterparts and to the global economy more broadly. Only six years later, former Coca-Cola executive Vicente Fox, of the Partido Acción Nacional (PAN), ascended to the presidential chair—ending the seven-decade rule of the Partido Revolucionario Institucional (PRI). The twin processes of liberalizing the economy and democratizing the polity were marketed as the means to launching Mexico into First World nationhood. But in light of economic crises and controversial elections, the viability of the country’s new democracy and market-oriented development model are frequently questioned. In the last decade, much hope surrounding Mexico’s future has been drowned by an unprecedented wave of violence related to the drug trade, or narcoviolence.
Following the Fox presidency, Felipe Calderón (PAN) launched an antinarcotics campaign in December 2006 that began with militarized operations in the state of Michoacán and shortly thereafter in Baja California. This crackdown carried over into Enrique Peña Nieto’s (PRI) administration with no real success in eradicating the drug trade. With more than one hundred thousand dead and at least thirty thousand disappeared (Pena and Stevenson 2016), the state has managed only to unleash violence across Mexican communities. Yet despite the long reach of drug- trafficking organizations (DTOs), narcoviolence is unevenly distributed across the national territory.Footnote 1 And while the industry itself dates back to the early twentieth century, high levels of violence are relatively new (Astorga Reference Astorga2005; Recio Reference Recio2002).
Current research on narcoviolence in Mexico generally looks at the dynamics of illicit markets, antinarcotics policies, and the logic of criminal violence directed at the state (e.g., Lessing Reference Lessing2018; Phillips Reference Phillips2015). Most authors also emphasize the links between state actors and traffickers, and the political settings that historically allowed the state to regulate the industry (e.g., Astorga Reference Astorga2005; Durán-Martínez Reference Durán-Martínez2018). Most authors do not engage with research on economic change in Latin America that sees social exclusion as the basis of new forms of violence across the region (e.g., Briceño-León and Zubilaga Reference Briceño-León and Zubilaga2002; Sánchez Reference Sánchez2006). Building on these separate literatures, this study places the history of the Mexican drug trade within the country’s experience with economic liberalization in order to explain subnational variation in narcoviolence.
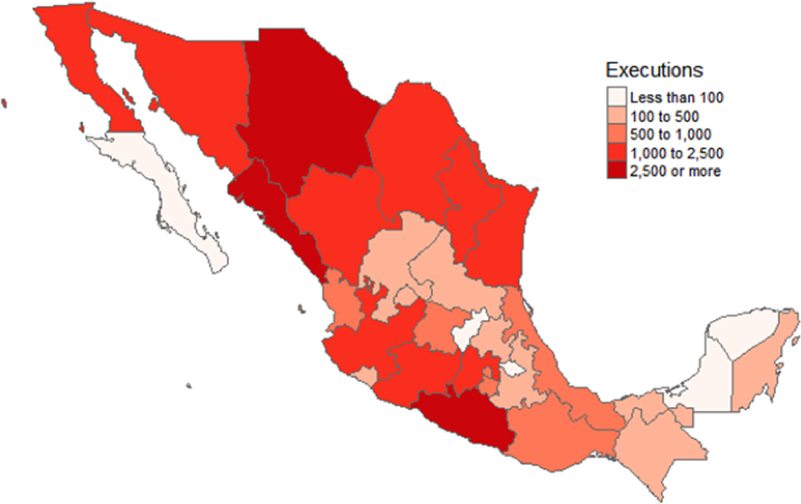
The account presented here places drug trade workers, as opposed to drug lords, at the center of the analysis. To understand the narcotics industry, it is important to understand its social basis. That is, what is the labor force that this illicit niche draws from? I argue that the subnational distribution of narcoviolence (visualized in map 1), operationalized as drug trade deaths, is indirectly driven by political economic processes that promote social exclusion and, in turn, fuel the growth of the drug trade by growing its labor force.
Geography of Narcoviolence (Drug Trade Deaths), December 2006–November 2011

By focusing on trade liberalization, this study discusses two mechanisms through which this occurs. First, trade reform restructures the agricultural sector with negative consequences for small producers, which can increase the flow of rural workers into the narcoeconomy in drug-producing regions. Second, trade liberalization has not meaningfully absorbed surplus labor in northern manufacturing centers, where key smuggling routes are located, which leaves a precarious pool of labor that the drug trade can absorb. Through both mechanisms, the workers who do enter the supply side of the international drug market are entering an illicit market, with institutional settings that allow for fierce competition, state intrusion, and the use of violence.
The empirical analysis uses quarterly panel data (2007–2011) for Mexico’s 32 federal entities to examine these arguments. It finds evidence that exposure to trade is associated with narcoviolence in both drug-producing and drug-smuggling areas, but with a stronger effect in the former.
Violence and Drug Markets
Violence, as defined by the World Health Organization, is “the intentional use of physical force or power, threatened or actual, against oneself, another person, or against a group or community, which either results in or has a high likelihood of resulting in injury, death, psychological harm, maldevelopment, or deprivation” (2014, 2). In Mexico, narcoviolence and the deaths, kidnappings, rapes, and tortures it incurs approximate what can be considered “pure” economic violence. This violence is economic because it is employed as a means to gain and maintain economic power (Imbusch et al. Reference Imbusch, Misse and Carrión2011). It is pure because despite its political consequences, actors in the Mexican drug trade are primarily concerned with drug trafficking and not with capturing state power (Lessing Reference Lessing2018).
Economic actors in the drug trade (individuals and DTOs) operate under slightly different institutional settings than those in other industries, due to the drug trade’s illicit status. Most important, the drug trade has no legal-institutional channels through which to enforce contracts or ensure fair competition (Friman Reference Friman2009). Traffickers thus employ violence as a form of social control and market regulation to solve grievances and punish or discourage those who might harm their economic activities. Despite the illegality of this sector, violence is selectively administered. It is usually employed against rivals over control of the market, and if the state is targeted, it is usually in response to varying degrees of repression (Friman Reference Friman2009; Lessing Reference Lessing2018). However, excessive violence is undesirable because it draws too much attention to illegal activities from the media and the state, which can disrupt business (Andreas and Wallman Reference Andreas and Wallman2009). To this end, violence is not inherent in illicit markets. It appears in both manifest and latent ways, and usually to support further economic activities (Williams Reference Williams2009).
The close links between illicit sectors and violence make market dynamics central to studying drug industries. In Mexico, narcoviolence is usually carried out to establish control over territories useful for drug trafficking, including drug-producing regions, smuggling routes, local drug markets, and other logistic points connected to international trade (Calderón et al. Reference Calderón, Robles, Díaz-Cayeros and Magaloni2015). Studies focusing on antinarcotics operations show that state strategies of decapitation (targeting DTO leadership) only temporarily reduce violence. In the long run, such state intrusions cause more violence by fragmenting and creating power struggles within DTOs, leaving them vulnerable to encroachment by rivals (Calderón et al. Reference Calderón, Robles, Díaz-Cayeros and Magaloni2015; Osorio Reference Osorio2015; Phillips Reference Phillips2015; Rios Reference Rios2012).
Durán-Martínez (Reference Durán-Martínez2015, Reference Durán-Martínez2018) takes a holistic approach to narcoviolence in Mexico and Colombia by looking at the interactions between states and illicit markets. She argues that the frequency of violence increases as markets become less monopolistic and more competitive, but the visibility of violence increases as the state’s security apparatus becomes less cohesive and more fragmented. This suggests that state power is an integral aspect of the workings of drug markets.
State-Narco Relations in Historical Perspective
The Mexican drug trade is not a new industry, but one that dates back to the early twentieth century (Astorga Reference Astorga2003, Reference Astorga2005; Recio Reference Recio2002). As U.S. policymakers moved toward the regulation and criminalization of narcotics in the 1910s and 1920s, Mexican growers stepped up in producing cannabis and opium for export. Production took root in northern states, but the drug trade would eventually expand throughout the country. Those same provinces also developed a model of state control over the drug trade that defined the industry between the 1950s and 1980s. Like much of twentieth-century Mexican history, this history fails to escape the long shadow cast by the PRI.
The consolidation of Mexico’s postrevolutionary state is synonymous with the rise of the PRI and its corporate political system. Corporatism a la mexicana tied citizens to the state through official institutions that represented the country’s main social sectors: workers, peasants, and the middle classes. The political center (the presidency) employed centralized, top-down control over provincial and local actors through partisan loyalties, clientelism, family relations, economic incentives, and sometimes coercion (Cornelius 1999). The monolith proved to be resilient, thanks to its ability to resolve elite conflicts, co-opt and integrate new interest groups, and legitimate itself through social compacts and electoral processes (Cornelius Reference Cornelius, Cornelius and Jane1999; Magaloni Reference Magaloni2006).
The PRI’s centralized political arrangements allowed political actors to insert themselves into the drug trade, such that “the Mexican drug trade was born in the shadow of politics and has been subject to them for decades” (Astorga Reference Astorga2005, 161; author’s translation). Traffickers would seek political protection and cooperate with the state through bribes and pacts with local police, regional military commanders, and governors (Grayson Reference Grayson2010). But the “rules of the game” were established by political actors, who allocated plazas (territories) to traffickers and had the power to dispose of insubordinate traffickers (Knight Reference Knight and Pansters2012; Serrano Reference Serrano and Pansters2012).
The drug trade was allowed to blossom as an export industry under the conditions that violence would be minimal, no domestic market for drug consumption would be created, and DTOs would not expand beyond their designated product lines (Grayson Reference Grayson2010; Knight Reference Knight and Pansters2012; Serrano Reference Serrano and Pansters2012). Lupsha and Pimentel (1997) describe this relationship as elite exploitation because it treated DTOs as “cash cows” for political actors to manipulate and exploit. Therefore, it was not the traffickers who penetrated the state, but state officials who subordinated traffickers and integrated them into the political system (Knight Reference Knight and Pansters2012). Of course, this does not implicate the entire PRI machine as corrupt—at least not in regard to the drug trade—but only the formal institutions charged with combating drug trafficking (Astorga Reference Astorga2005).
The breakdown of the “perfect dictatorship” began in the late 1980s, as opposition parties gained electoral victories in Congress and several states (Cook et al. Reference Cook, Middlebrook and Horcasitas1994; Cornelius Reference Cornelius, Cornelius and Jane1999), and culminated with the PAN’s presidential victory in 2000. The PRI’s demise is directly related to the state party’s capture by internationally oriented technocrats who oversaw the implementation of market and institutional reforms during the 1980s and 1990s. This new generation of state managers inadvertently disrupted the flow of patronage to constituents and social sectors— resulting in the erosion of the PRI’s mass bases of support and divisions within elites (Dresser Reference Dresser1994; Magaloni Reference Magaloni2006). These reforms also allowed for the modernization and decentralization of the state apparatus through electoral transparency, pluralism, actual checks and balances, and a softening of control from the political center (Ward and Rodríguez Reference Ward and Rodríguez1999).
With gradual political liberalization, the state lost control over the drug industry. The inefficiency of new authorities allowed both DTOs and implicated political actors to break away from the old rules of the game (Astorga Reference Astorga2005). Without centralized control, local and state-level PRI actors still in power could not be held accountable, making them just as susceptible to institutional rupture (Knight Reference Knight and Pansters2012). But ties between the state and DTOs were not entirely severed. Instead, the rules of the game were reversed, and it was now the traffickers who often employed and coerced state functionaries (Hernández Reference Hernández2013). Political realignment also occurred in tandem with the empowerment of DTOs, thanks to windfall profits from higher demand for drugs and changing commodity chains—specifically the transfer of cocaine routes from the Caribbean to Mexico. The result was a privatized and more violent drug market, where increasingly autonomous DTOs readily used violence in the absence of institutionalized protection from persecution and competition (Astorga Reference Astorga2005; Serrano Reference Serrano and Pansters2012).
While the illicit nature of drug markets made the use of violence a useful business tool, this logic was historically suppressed in the twentieth century, due to the state’s regulatory role in the drug industry. The removal of state support therefore reactivated this basic logic of illicit markets. To this end, various scholars have argued, from different angles, that the recent surge in violence is an unintended consequence of democratization, decentralization, and poor coordination in the state’s security apparatus (Durán-Martínez Reference Durán-Martínez2015, Reference Durán-Martínez2018; Rios Reference Rios2015; Shirk and Wallman Reference Shirk and Wallman2015; Snyder and Durán-Martínez Reference Snyder and Durán-Martínez2009; Trejo and Ley Reference Trejo and Ley2016; Villarreal Reference Villarreal2002). These politicoinstitutional approaches to understanding the Mexican drug trade have great explanatory power, but they say little about the social basis of the drug trade and its embeddedness in the broader political economy.
Economic Change and the Social Basis of the Drug Trade
The growing rates of violence since the 1980s are a major concern across Latin America. Urban centers, in particular, are undergoing a “democratization of violence,” in which the state and contenders for state power are no longer the primary perpetrators (Ascher and Mirovitskaya Reference Ascher and Mirovitskaya2012; Krujit and Koonings Reference Koonings and Kruijt2004). Violence is increasingly dealt by citizens, often in pursuit of economic gain and in illicit markets, which, some scholars argue, has a basis in the changing dynamics of social exclusion and inequality in the region (Arias and Goldstein Reference Arias and Goldstein2010; Briceño-León and Zubilaga Reference Briceño-León and Zubilaga2002; Sánchez Reference Sánchez2006).
Episodes of economic liberalization during the 1980s and 1990s are associated with lower wages and higher rates of labor informality across Latin America (Portes and Hoffman Reference Portes and Hoffman2003), and, in turn, continue to be seen as a driving force behind this trend. Essentially, the depletion of economic opportunity in the licit labor market can promote the growth of the illicit sector, and violence proliferates because it can be a means to economic ends within the illicit workforce. This is not to say that all excluded workers transition into the illicit sector—many choose to migrate, or to or live in a state of informality—but the illicit sector remains a powerful alternative to economic desperation.
The Mexican drug trade is not insulated from changes in the national or global political economy, yet the literature largely ignores the aforementioned insights on economic change and violence. On the one hand, drug trafficking globally is wed to new developmental regimes by taking advantage of the expansion of international trade, faster modes of transportation, and reduced border controls (Buxton Reference Buxton2006). On the other hand, labor markets in the developing world have been restructured along more precarious lines, making social reproduction more difficult in licit sectors and arguably aiding the growth of illicit industries. According to Briceño-León (Reference Briceño-León2007), such macrolevel processes create the basis for violence but do not directly determine violent outcomes. The actual use of violence is determined by mesolevel factors that affect the behavior of actors and their propensity to use violence.Footnote 2
In the case of Mexico’s drug industry, violence is used as a control mechanism within an illicit market, but has been historically limited by politicoinstitutional arrangements. The collapse of those arrangements has created a surge in violence stemming from state intervention and competition between DTOs. These are mesolevel factors. The macrolevel factors emphasized in this study are political economic; in particular, the drug trade’s embeddedness in the political economy and its transformation, which arguably affects the labor input of illicit industries. To emphasize this point, a slight reorientation in how to think about the drug trade is needed.
Contrary to sensationalized accounts of drug trafficking, kingpins are not the only important actors in the industry. There is a larger class of informal workers willing to produce and transport illicit goods and to use violence as a tool of the trade. Regardless of political regime or who is killed or incarcerated, thousands of narcotics workers will keep the commodity chain moving, as a result of excess supply and high demand (Grillo Reference Grillo2012; Buxton Reference Buxton2006).Footnote 3 This labor force and its necessary reproduction ultimately forms the social basis of drug trafficking. This study explains the geographic patterning of narcoviolence by placing the half-million individuals working in Mexico’s drug trade at the center of the analysis and identifying the political economic forces that generate the labor force for this illicit sector.Footnote 4 Trade reform can be specifically linked to narcoviolence through its socioeconomic consequences for workers in key regions for drug trafficking.
Market-Led Development and its Discontents
Mexico’s democratic transition was defined not only by the decline of the PRI but also by the concomitant onset of a market-led development model. Pushed by external processes (economic crisis and IMF pressure) and internal processes (technocratic revolution), the country’s change in development strategy put an end to the previous era of state-directed development (Babb Reference Babb2001; Centeno Reference Centeno1994).
Mexico’s shift in policy regime was carried out through two stages of reforms. First, crisis-induced structural adjustment programs in the early 1980s sought to downsize the state and to promote fiscal and monetary austerity. Second, through the mid-1990s, institutional reforms dismantled developmentalist policy, liberalized trade and the financial system, and privatized numerous state-owned enterprises (Moreno-Brid and Ros Reference Moreno-Brid and Ros2009). The end result was a liberalized national economy, backed by a market-oriented state focused on promoting development through export-led growth and attracting foreign investment.
The hypothesis forwarded here is that trade opening leads to sectoral changes in the Mexican political economy, which, in turn, inadvertently increase the flow of workers into the drug trade. These changes arguably contribute to higher rates of drug violence under the industry’s current politicoinstitutional settings, which promote violent competition among DTOs and state intrusion. Two different mechanisms pertain to different nodes in the international drug trade—production and smuggling—but with a similar underlying logic. Although not all labor in the drug trade involves the immediate use of violence (e.g., cultivation, refinement, transportation), higher labor inputs allow DTOs to expand their operations, compete with rivals, and confront the state. Illicit labor is therefore intertwined with the growing importance of particular regions that are subject to power plays and violent takeover.
Trade Liberalization and Production Zones
Trade reform is the hallmark of Mexico’s economic liberalization. Policy change began rather slowly in 1984 with the relaxation of direct import controls and their progressive replacement with tariffs—and later the reduction of those tariffs (Moreno-Brid and Ros Reference Moreno-Brid and Ros2009). The implementation of NAFTA a decade later finalized the new regime by removing tariffs and other trade barriers. Restrictions on foreign investment were also gradually liberalized.
In the agricultural sector, NAFTA deepened the sectoral dualism between commercial and small producers (Moreno-Brid and Ros Reference Moreno-Brid and Ros2009; Rosenzweig Reference Rosenzweig2005). On the one hand, export-oriented commercial production (e.g., fruits, vegetables) grew considerably as barriers to trade fell. On the other hand, the small production sector was negatively affected by the influx of agricultural imports that were generally produced for local consumption (e.g., grains, beans). Small producers were also affected by the reduction of agricultural subsidies, falling prices, and the growing dominance of agribusiness (Davis Reference Davis2000; Puyana and Romero Reference Puyana, Romero and Solano2009). As a result, many rural workers had to diversify their income sources through other forms of work (often informal) or by migrating (Audley et al. Reference Audley, Papademitriou, Polaski and Vaughan2003; Davis Reference Davis2000).
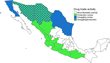
Many of the states in which NAFTA took a toll on small producers were drug- production zones—critical nodes in the international drug trade where most drugs were produced (see map 2). Durango, Sinaloa, and Guerrero, for example, each saw more than 49,000 hectares of cannabis and poppy crops eradicated between 2007 and 2015 (Resa Nestares 2016). Naturally, a labor force is required to cultivate, process, and bring to market these illicit commodities. The availability of such a labor force is historically related to underdevelopment, but the displacement of rural populations due to economic liberalization contributes to the expansion of drug production (McDonald Reference McDonald2005).
Major Drug Trade Activity for the International Market

As a way to mitigate economic deprivation, peasants in drug-producing regions can switch traditional crops for more profitable illicit ones, or they can work in related trafficking activities (Briceño-León and Zubillaga Reference Briceño-León and Zubilaga2002; Buxton Reference Buxton2006; Teichman Reference Teichman2012; Vellinga Reference Vellinga2004). In the Caquetá department of Colombia, for example, market reforms (export promotion policies, privatization, deregulation) exposed agricultural producers and workers to the global market and, in turn, led many to pursue work in coca production (Hough Reference Hough2011).
Thus, the growth of the drug trade in rural Mexico and other drug-producing countries in part stems from rising social exclusion, spurred by economic liberalization (Maldonado Aranda 2012; Malkin Reference Malkin2001; Teichman Reference Teichman2012). If the social basis of the drug trade lies in the conditions that generate a labor force in this sector, the industry as a whole benefits from the dispossession of rural means of reproduction at the hands of political economic forces, recently prompted by neoliberal statecraft.
The first mechanism explaining the geography of narcoviolence thus posits that trade liberalization changes the sectoral composition of agricultural production and employment in a way that can increase the flow of rural workers into the narcoeconomy. Although these processes began a decade before the explosion of violence, it took 15 years to fully implement the new free trade regime.Footnote 5 Market-led development has also deepened, not reversed, following democratization.Footnote 6 Therefore, entire economic sectors, including the drug trade, and the livelihoods of Mexican workers continue to be shaped by the current development model. And with the collapse of politicoinstitutional arrangements that previously limited drug violence, workers enter an illicit market where the use of violence is the new norm. We can therefore expect a stronger link between exposure to trade and violence in production zones compared to areas without a significant role in the international drug market.
Trade Liberalization and Smuggling Zones
Trade reform is just as impactful, if not more so, in industrialized, urban centers as in rural areas. Indeed, most economic growth post-NAFTA has been in export manufacturing, particularly in borderland maquiladoras. But work in this sector tends to be low-skilled, low-paying, highly flexible, and feminized, because firms take advantage of women’s labor market disadvantages (Salzinger Reference Salzinger2003; Sklair Reference Sklair1993). Although manufacturing exports boomed in the 1990s following NAFTA, they began to decline in the 2000s as some production moved to Asia. Furthermore, the moderate and sporadic growth following the apertura has been insufficient to provide formal employment to a growing labor force, and the wages of Mexican workers have failed to converge with those of their U.S. and Canadian counterparts (Moreno-Brid et al. Reference Moreno-Brid, Santamaría and Carlos Rivas Valdivia2005). Instead, wage inequality has widened as liberalization primarily has benefited skilled labor and neglected unskilled labor (Audley et al. Reference Audley, Papademitriou, Polaski and Vaughan2003; Esquivel and Rodríguez-López Reference Esquivel and José2003).
Watt and Zepeda (Reference Watt and Zepeda2012) argue that border states have a particularly large labor pool available to DTOs, due to internal migrants seeking factory work and young men overall who are unable to find work, since maquiladoras prefer female labor. This situation is crucial, given that cities in border states where manufacturing has grown also form the country’s most important smuggling routes (e.g., Tijuana, Ciudad Juárez). These drug-smuggling zones (refer to map 2) are especially important in the neoliberal period, since free trade facilitates the transportation of illicit commodities alongside licit ones (Buxton Reference Buxton2006). Smuggling zones are highly coveted by DTOs looking to dominate U.S. drug markets and thus require a labor force to transport drugs and protect their assets from competitors and the state. The supply side of the drug trade thus benefits from liberal trade regimes at the point of transportation and smuggling, not just production.
The second mechanism used to explain narcoviolence relates to the failure of trade liberalization to deliver its developmental promises. Instead, this export-led model preserves, and in some areas expands, the precarious pool of labor that can be attracted to the growing, competitive, and violent drug trade. In smuggling zones, this means that DTOs may utilize surplus labor from urban manufacturing centers for their illicit activities, such as smuggling and violence. We can therefore expect to see a stronger relationship between exposure to trade and narcoviolence in drug- smuggling zones compared to areas without a significant role in the international drug market.
Panel Data Analysis
This study examines the effects of exposure to trade on the distribution of narcoviolence in Mexico using panel data for 32 federal entities from 2007 to 2011. The unit of analysis is the state-quarter (20 quarters total), and it is determined by the availability of key labor variables used to create the trade exposure metric described below. Violence is also highly variable within years, and a yearly analysis may not accurately capture the intermediate effects of economic change. Quarterly data are therefore a trade-off between fine-tuned monthly data and overly aggregated yearly data. Given that the subnational turn in the social sciences has emphasized disaggregated geopolitical units, a state-level analysis is a useful first step in analyzing regional trends in the relationship between trade exposure and violence before attempting a municipal-level study.
The time frame is restricted to the availability of the outcome variable, narcoviolence, which is operationalized as drug trade deaths. The data were compiled by researchers at the Centro de Investigación y Docencia Económicas (CIDE) in Mexico City, using official data they anonymously received at the beginning of Peña Nieto’s presidency (Atuesta et al. Reference Atuesta, Oscar and Alejandro2016). The data register a total of 43,746 drug war deaths from December 2006 to November 2011, which is most likely to be an underestimate of the violence. Reliable data on drug trafficking, or any other illicit industry, are difficult to obtain, for obvious reasons. Data on casualties are especially problematic because corpses are not always immediately discovered and sometimes not discovered at all. Nevertheless, the data capture the relative intensity of violence between states.
In order to fit a linear model, the outcome variable is turned into a logged rate of deaths per one hundred thousand inhabitants.Footnote 7 The population data used to create the rate variable are midyear estimates retrieved from Mexico’s National Population Council (CONAPO 2014), which are interpolated to fit the quarterly analytic scheme.
Key Predictors: Trade Exposure and Drug Trade Activity
Trade openness (imports and exports as a proportion of GDP) would be ideal for estimating the impact of free trade on violence, but these data do not exist for Mexico at the subnational level. Instead, this analysis employs Topalova’s innovative approach (2007) to studying the effects of trade policy change on poverty and inequality in Indian districts. She measures subnational exposure to trade using industry-level tariffs weighted by the number of workers in each industry relative to the total workforce. Trade protection is calculated as
 $${\rm{Trade}}\,{\rm{Protectio}}{{\rm{n}}_{s,t}} = {{{\sum _k}(Worker{s_{s,k,2006q}}*Tarif{f_{k,t}})} \over {{\rm{Worker}}{{\rm{s}}_{s,2006q}}}}$$
where s represents the unit of analysis (states), t time, and k the sector. The average tariff for k sector in t year is multiplied by workers employed in that sector in s state in 2006 quarter. The process is repeated for each sector and its sum is divided by the total labor force in s state in 2006 quarter. Only workers in tradeable industries (i.e., not service workers) are included in the denominator. The product is weighted tariffs that capture the level of trade protection per quarter per state. Topalova’s original equation uses workforce weights in the year prior to the period of study, which in this case is 2006. Here this is modified by using 2006 quarterly weights in order to capture within-year fluctuations in the workforce. For example, trade protection estimates for Jalisco in 2010q1 use workforce weights from 2006q1, 2010q2 uses weights from 2006q2, and so on.
To look at the subnational consequences of national trade policies, nominal tariff data (ad valorem duties) were retrieved from the World Trade Organization (2016) and linked to employment data from the National Occupation and Employment Survey (INEGI 2011). Average nominal tariffs were calculated for three broad tradeable sectors, based on the most disaggregated available employment figures: extractive industries, manufacturing, and agriculture (grouped with livestock farming, fishing, hunting, and forestry). To better fit the focus of the research, the trade protection measure was reverse-coded. This allows us to analyze the effects of exposure to trade, as opposed to protection from trade. Trade exposure is measured as
 $${\rm{Trade}}\,{\rm{Exposur}}{{\rm{e}}_{s,t}} = ({\rm{mi}}{{\rm{n}}_{{\rm{TradeProtection}}}}{\rm{ + ma}}{{\rm{x}}_{{\rm{TradeProtection}}}}) - Trade\,Protectio{n_{s,t}}$$
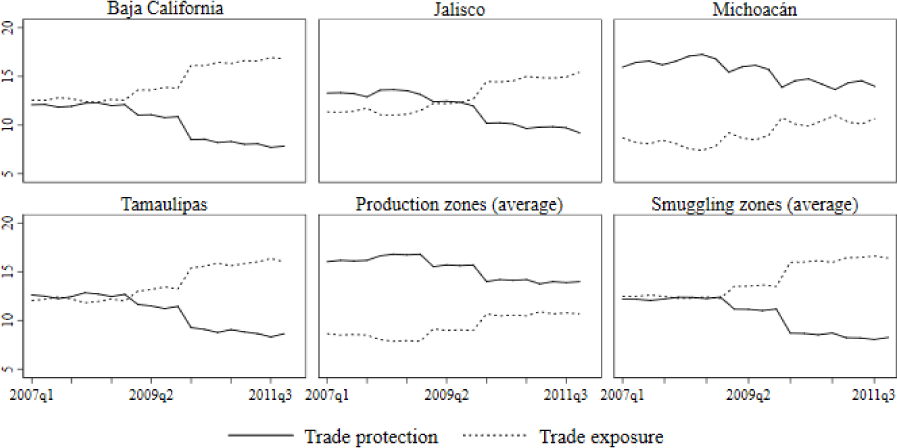
Simply put, the state-quarter observation of trade protection is subtracted from the sum of its lowest and highest values. Figure 1 provides a snapshot of cross-state and within-state variation in trade protection and exposure, including an overall trend of increasing trade exposure.
Sample of Subnational Trade Openness Metrics

I created a typology of the most salient drug trade activity found in each state (refer to map 2). This categorical variable consists of smuggling zones, production zones, and a residual category of states with less important participation in the global drug trade. All six states along the U.S.-Mexico border were categorized as smuggling zones. Records from the U.S. Drug Enforcement Administration (2016) show drug seizures at all ports of entry from these states.Footnote 8 Production zones were states with substantial cannabis and opium production.Footnote 9 Using data collected by Resa Nestares (2016) from Mexico’s Secretariat of National Defense, states were labeled production zones if they had at least 4,000 hectares of drug crops eradicated between 2007 and 2015. Together, these states had over 260,000 hectares of drugs eradicated in that time period—99.3 percent of the national total. As for the residual category, these states were not as critical for the international drug market but might still fall under the influence of DTOs, due to minor production activity, the recent growth of domestic drug markets, or the presence of seaports.
Controls
As discussed, Mexican drug trafficking has a deep-seated and ever-changing relationship with the state. Given the importance of coordination, or lack thereof, between different levels of government, a political coordination variable was included, measured as the proportion of municipalities in a state where the municipal president belongs to the same party as the state governor and the national president. This proxy was constructed using data from the Center of Investigation for Development (CIDAC 2017) and the National Institute for Federalism and Municipal Development (INAFED 2017). The state’s presence and institutional capacity were measured using the number of public ministry agents (both state and federal agents) per one hundred thousand inhabitants.
It is also important to control for the geography and violent dynamics of illicit markets. Road density (ratio of total road surface to total area) was used to measure access to transportation networks used in drug production and smuggling. State interventions in the drug market were accounted for using counts of kingpin decapitations. This variable was borrowed from Phillips (Reference Phillips2015), who counts the killing or arrests of high-ranking DTO leaders by the state’s security forces. Given that the territories of DTOs often span large areas, leadership removals can affect several states at once. Therefore, the removal of a given kingpin was counted for all states occupied by their DTO.Footnote 10 Competition between DTOs was also taken into consideration using a binary variable for disputed territory. This variable was also taken from Phillips (Reference Phillips2015), who provides a “conservative” estimate of territorial disputes based on well-established and substantial conflicts between DTOs.
A spatiotemporal lag was included to deal with the theoretical and mechanical polemics of violence spillover in neighboring states. Turf wars and other violent episodes can expand large areas or cause spillovers, which suggests the possibility of spatial interdependence in the data. Following Phillips (Reference Phillips2015), a neighborhood deaths variable was created that measures the average number of drug-trafficking deaths in bordering states. In other words, each observation contains a spatial lag that is the weighted average of outcomes (in count form) for spatially proximate units. The immediate concern with this approach is endogeneity in the form of simultaneity bias, which can lead to an overestimation of interdependence strength. I used Franzese and Hays’s suggestion (2008, 758) to temporally lag the spatial lag as a way to mitigate simultaneity bias.
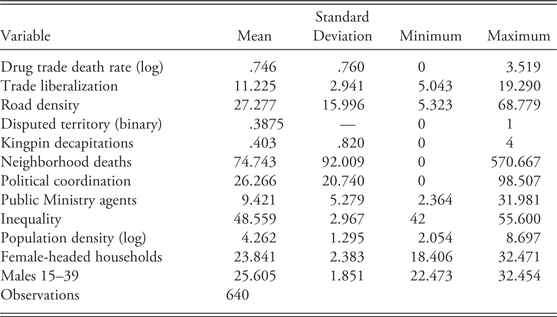
The story of drug production in developing societies is ultimately a story of underdevelopment and inequality. Yet most development-related measures (e.g., GDP per capita, remittance inflows, migration rates) are difficult to account for, due to high correlations with the trade metric, so this analysis focused on controlling for inequality with the Gini coefficient. This variable was drawn and interpolated from biannual data produced by the National Council for the Evaluation of Social Development Policy (CONEVAL 2016). To account for changing demographics, I included population density (population/km2) as a proxy for urbanization, the percentage of female-headed households as a proxy for family structures, and the ratio of males aged 15 to 39 relative to the rest of the population—this being the primary group attracted to and affected by drug trafficking. These variables were retrieved from CONAPO (2014) and INEGI (2011). Table 1 presents descriptive statistics for all these variables.
Descriptive Statistics

Estimation
Random effects models (REM) were employed to examine the relationship between exposure to trade and the territorial distribution of narcoviolence in Mexico. This estimation strategy was used to account for the panel structure of the data (repeated observations of groups over time). Random effects (group-specific error term) were implemented over fixed effects (group-specific intercepts) because differences across states are expected to influence the dependent variable. The models were estimated with heteroskedastic and cluster-robust (HAC) standard errors. A robustness check was also used by reestimating the REMs using an alternative dependent variable.
The second data source was the Office of the General Prosecutor (PGR), and it tallied drug war deaths between January 2007 and September 2011. These data are also from an official source yet distinct from the CIDE data. The PGR data were originally available to the public but were taken down early in Peña Nieto’s presidency.Footnote 11 They tally 47,259 deaths. As with the CIDE data, the PGR death counts are turned into a logged rate per 100,000 inhabitants. Regression results are generally consistent using the different data sources (see the appendix).Footnote 12
Results
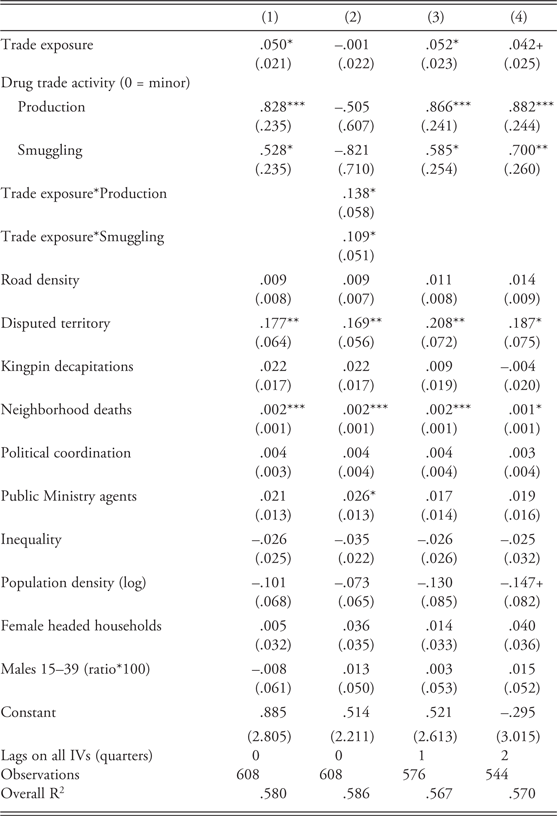
Results for the REMs of logged rates of drug-trafficking deaths are presented in table 2. Model 1 reports the baseline model. Model 2 includes the interaction effect between trade exposure and drug market activity. Models 3 and 4 lag all the timevariant predictors in the baseline model by one and two quarters, respectively. By focusing on illicit workers as the key actors in the drug trade, it is argued that increasing social exclusion can help explain the territorial distribution of narcoviolence in Mexico. Empirically, the analysis looks at exposure to international trade as a key aspect of the country’s turn toward market-led development.
The main hypothesis is that trade exposure is positively associated with higher levels of violence, due to the exclusionary dynamics of Mexico’s trade opening—but with mechanisms that differ based on the political economy of drug trafficking in each region. Model 1 shows that greater exposure to international trade is associated with a 5 percent increase in log death rates across the board. This association is maintained when the predictors are lagged by one quarter (model 3), but the effect diminishes to 4 percent and becomes marginally significant when they are lagged by two quarters (model 4).
When an interaction term is added in model 2, the results suggest that trade exposure is associated with about 14 percent and 11 percent more violence in production and smuggling zones, respectively, when compared to regions with minor international trafficking activities. This supports the hypothesis that trade liberalization is associated with higher rates of violence, but through different mechanisms. The changing composition of the agricultural sector, spurred by trade liberalization, increases the flow of rural workers into the narcoeconomy, and the export-led growth model prompts new patterns of migration and labor precarity in the industrialized north, which generates new pools of labor available for the drug industry.
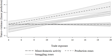
Figure 2 visualizes the findings by plotting the adjusted linear prediction of the outcome variable by trade exposure according to different areas of drug trade activity. The effect of trade exposure on narcoviolence is consistently positive and stronger in production zones across levels of exposure.
Adjusted Linear Prediction of Narcoviolence Across Trade Exposure

Random Effects Models for Logged Rate of Drug Trade Deaths (CIDE)

***p < .001, **p < .01, *p < .05, +p < .1
Note: Unstandardized coefficients are reported, followed by heteroskedastic and cluster robust standard errors in parentheses.
When looking at drug trade activities alone, the models show that production and smuggling zones experience about 8 to 9 percent and 5 to 7 percent more violence, respectively, than areas less important for the international drug trade. The models are unable to show whether political coordination between different levels of government is related to levels of violence. This may be due to the state-level analysis; most studies that do find such relationships do so at the municipal level. Territorial disputes between DTOs are associated with a 17-to-20-percent increase in violence rates. But the models do not bring back significant results for the effects of DTO leader decapitation. It is important to note that earlier analyses (not shown) suggest a positive association between decapitation and violence, but it disappears once the spatiotemporal lag (spillover variable) is added to the models. No other variables are sensitive to its inclusion. Furthermore, the spillover variable itself is highly significant across models. The coefficients are small (.2 to .3 percent increase), but they suggest that violence in neighboring states is associated with a given state. No other variables bring back significant results.
Discussion and Concluding Remarks
This article demonstrates that the contemporary violence of the Mexican drug trade has social and economic roots and not just political ones. The atmosphere of insecurity in the country is arguably part of a regional trend consuming Latin American societies, in which the use of violence is being democratized. That is, mundane and incredible acts of violence are no longer under the strict purview of state actors and contenders for state power. Instead, violence is increasingly perpetrated by segments of marginalized social classes for economic ends. From this perspective, this study departs from sensationalist accounts put forth by the media, political commentators, and the occasional academic by placing the workers in the drug trade at the center of analysis. This labor force forms the social basis of the narcotics industry through its exploitation in production, distribution, and violence-making activities.
Empirically, this article contributes to studies of narcoviolence in Mexico by analyzing the political economic forces that foster precarity and, in turn, make the illicit sector an attractive alternative for some segments of the workforce. It focuses on the role of trade liberalization, due to its importance for the country’s transition toward market-led development, and finds that greater exposure to trade is associated with higher levels of violence in regions where drugs are produced and smuggled for the international drug market.
These macrolevel factors do not directly determine violent events. They instead transform the social environment in which the drug trade flourishes. The use of violence itself, and its recent proliferation, is more directly explained by market dynamics and institutional settings that can encourage or constrain it. While the analysis does show that territorial disputes and neighboring violence are associated with higher rates of narcoviolence, the models do not find consistent evidence for the known effects of political coordination and state capacity. Future research therefore needs to study these relationships at different levels of analysis and with alternative data on drug violence.
Nevertheless, the sociological insights gained from this study are Polanyian. To understand drug trafficking, its actors, and the violence it can produce, we must understand that it is embedded in a particular politicoinstitutional history, as well as in a changing political economic landscape. While the histories of drugs and violence may vary across the drug-producing countries of Latin America and Asia, nowhere is drug trafficking autonomous from state power or from social relations. A Polanyian perspective also suggests that disembedding markets comes with severe consequences (Polanyi [1944] 2001). Following Mexico’s own great transformation, the country’s drug trade is nearly autonomous from state control, and ill-conceived attempts by state functionaries to subdue this capitalist hydra has led to the quagmire that is the drug war. As DTOs and kingpins are successfully knocked down, others rapidly take their place. If the industry is attacked at the point of production, or cultivation, then production is simply moved elsewhere.
While it would be virtually impossible to eradicate the drug business, given the high demand for narcotics in Northern countries and the excess supply in the South, it is more conceivable instead to target the prolific poverty and inequality found in Mexico and throughout the developing world. There is no commodity chain without the producers, smugglers, and sicarios to keep it moving. However, for a social development approach to curtailing violence to work, the Mexican state would need to reinforce its institutions and immunize them from corruption and to prioritize social welfare over economic growth. Historical institutionalism suggests that purposefully forging bureaucratic institutions is rather difficult—the pervasiveness of corruption in Mexican politics and society corroborates this view. Social welfare is still not a priority in the continuation of market-led development under democratic governance. Therefore, even the most cautious pessimism of the intellect suggests that little can be done about the growing power and autonomy of DTOs. Lamentably, as popular ballads glorifying trafficking often proclaim, sigue la mata dando— the drug trade continues to give fruit.
Appendix. Robustness Checks, REM Models Using Alternative Data (PGR)

***p < .001, **p < .01, *p < .05, +p < .1
Note: Unstandardized coefficients are reported, followed by heteroskedastic and cluster robust standard errors in parentheses.