

1 Introduction
It has long been recognized that monosyllabic adjectives strongly prefer synthetic comparatives/superlatives (i.e. -er/-est) whereas adjectives longer than two syllables almost always take analytic forms (i.e. more/most) (see Thomson & Martinet Reference Thomson and Martinet1980; Quirk et al. Reference Quirk, Greenbaum, Leech and Svartvik1985: 461; Huddleston & Pullum Reference Huddleston and Pullum2002: 1583; Biber et al. Reference Biber, Johansson, Leech, Conrad and Finegan1999: 522, among others). Nevertheless, some adjectives can take both synthetic and analytic forms, as shown in the following examples from the British National Corpus (BNC).
-
(1)
-
(a) Today he is to visit Gettysburg, Pennsylvania, the site in 1863 of the bloodiest battle of the American Civil War. (BNC: A1V-785)
-
(b) Later they went to the scene of one of the most bloody battles in the 1950–53 Korean war affecting British troops. (BNC: CEM-524)
-
-
(2)
-
(a) Low rateable values in some of the remoter rural areas also played a part. (BNC: FPR-847)
-
(b) Everyone knows how good he is, or nearly is, but somehow he remains a more remote figure. (BNC: AHK-217)
-
A number of studies have examined determinants of the S-A variation, e.g. presence of complements, final segments of the respective adjective and frequency (see section 3 for relevant studies).
There are at least three gaps in the literature. First, previous research has shown that as many as 20+ variables can potentially have an effect on the S-A variation. Many researchers study the effect of one single variable at a time without systematically controlling for other variables. It is important to examine the S-A variation using a model that can take into consideration a range of variables simultaneously. Hilpert (Reference Hilpert2008) is a notable exception in that he takes into account a wide variety of variables using logistic regression. Our methodology is similar to his. Second, previous research on S-A alternation is heavily skewed towards comparatives. Superlatives have largely been neglected. Third, some are based on relatively small data samples (e.g. Leech & Culpeper Reference Leech and Culpeper1997; Lindquist Reference Lindquist2000).
Our research will address these limitations in several ways. We have adopted a multifactorial methodology to systematically compare the S-A variation in English comparatives and superlatives. Special attention will be paid to the difference in the respective predictors’ contribution to the analysis of comparatives and superlatives. We included additional predictor variables that have been mentioned previously but were not studied in Hilpert (Reference Hilpert2008). To ensure that findings are reliable and representative, two large datasets derived from the BNC have been used to build the regression models. Three research questions are to be tackled in this article.
-
(3)
-
(a) What are the relevant predictor variables affecting S-A variation of English comparatives and superlatives?
-
(b) Among those identified in (a), which are the strongest predictors?
-
(c) Is S-A variation in comparatives and superlatives determined by the same factors?
-
The remainder of the article is organized as follows. Section 2 reviews the approaches of previous studies on S-A alternation and illustrates some shortcomings. The list of predictor variables identified is briefly described in section 3. In section 4, we introduce the corpus data extracted from the BNC and the regression methodology used to determine variable strength. Section 5 provides the results of the regression models. Section 6 discusses similarities and differences between S-A variation of comparatives and superlatives. A conclusion will be drawn in section 7.
2 Synthetic–analytic alternation of comparatives and superlatives
2.1 Monofactorial studies
Most studies on comparative alternation (see Leech & Culpeper Reference Leech and Culpeper1997; Lindquist Reference Lindquist2000; Mondorf Reference Mondorf2003, Reference Mondorf2009; González-Díaz Reference González-Díaz2008, among others) and superlatives (see Claridge Reference Claridge2007; Lindquist Reference Lindquist2000) focus on the identification of variables that affect S-A alternation. As documented in Mondorf (Reference Mondorf2009), at least 25 variables (in eight categories) have been reported in the literature,Footnote 2 as shown in (4).
-
(4)
-
(a) Phonological: e.g. avoidance of stress clash, avoidance of certain final segments
-
(b) Morphological: e.g. morphological complexity
-
(c) Syntactic: e.g. various types of complements, attributive vs predicative position
-
(d) Semantic: e.g. abstractness, figurativity, gradability
-
(e) Lexicon: e.g. length, frequency, parallel structure
-
(f) Pragmatic: e.g. end-weight, emphasis, gradual increase
-
(g) Historical: e.g. Old English, Middle English, Early Modern English
-
(h) Variety: British vs American English
-
Some previous studies adopt a quantitative approach based on relatively small data samples. For instance, among the variables studied, Lindquist (Reference Lindquist2000) finds that premodification of the comparative (e.g. ‘the single deadliest strike’) seems to favour the analytic form.Footnote 3 In his corpus of The Independent, 46 per cent (57 out of 123) of analytic comparatives are premodified while only 33 per cent (42 out of 127) of synthetic comparatives are premodified.
Mondorf (Reference Mondorf2003, Reference Mondorf2009) and González-Díaz (Reference González-Díaz2008) adopt a more stringent methodology. Although they also focus on the effect of one independent variable at a time, they control for one or two potentially intervening variables. For example, to study the effect of to-infinitive complements on comparative alternation, word length (monosyllabic vs disyllabic) and positional distribution (attributive vs non-attributive) are systematically controlled for (see Mondorf Reference Mondorf2003: 261–3). These measures help isolate the contribution of individual variables to S-A variation.
Nevertheless, monofactorial approaches have inherent limitations.Footnote 4 First, since 20+ variables may simultaneously contribute to the variation, it is not feasible to systematically control for all other 20+ variables when one studies a particular variable. Even with Mondorf's (Reference Mondorf2009) methodology, only a few variables can be controlled for at a time, thus limiting our understanding of the simultaneous contribution of the other variables. Multifactorial models offer more explanatory potential by permitting the comparison of multiple – though not all 20+ – variables at the same time. Second, it is difficult to compare the contribution of different variables as determined in a monofactorial analysis. One cannot easily make predictions about the choice of comparative variant if individual variables lead to conflicting S-A predictions. Third, some previous studies (e.g. Lindquist Reference Lindquist2000) are based on relatively small datasets.
Apart from identifying various variables, Mondorf (Reference Mondorf2003, Reference Mondorf2009) attempts to provide a principled account for why the synthetic and analytic comparatives are correlated with various properties or contexts. Drawing heavily on processing research (see Hawkins Reference Hawkins1994; Rohdenburg Reference Rohdenburg1996), Mondorf argues that one of the important principles determining the relationship between the variables and the S-A outcome is processing efficiency. She proposes the notion of more-support:
More-support: In cognitively more demanding environments which require an increased processing load, language users tend to make up for the additional effort by resorting to the analytic (more) rather than the synthetic (-er) comparative. (Mondorf Reference Mondorf2009: 6)
More-support thus works as a support strategy, mitigating the processing load in hard-to-process environments (for further examples of analytic variants as support strategies in English, Spanish and German see Mondorf Reference Mondorf, MacWhinney, Malchukov and Moravcsik2014). The analytic form is more explicit and incurs a lower processing demand. As a result, the analytic variant is preferred when the comparative is more complex phonologically, lexically, syntactically, semantically or pragmatically. For example, the presence of an adjectival complement tends to favour the use of analytic more. In Mondorf's (Reference Mondorf2009) analysis, the complement results in a higher degree of syntactic complexity, leading to the higher frequency of the analytic form. We will report in section 6 whether our findings are consistent with this hypothesis.
2.2 Multifactorial study
Hilpert (Reference Hilpert2008) utilizes logistic regression to provide an integral account of the influence of 16 variables on S-A alternation. The advantage of regression analysis is that it can evaluate the significance of each predictor variable simultaneously. The approach represents a significant improvement over previous studies. Hilpert's regression analysis fitted to 79,878 comparatives from the BNC shows that 15 out of 16 variables have a statistically significant influence on S-A selection. To evaluate the relative importance of three variable groups (i.e. phonological vs syntactic vs frequency variables), three additional regression models were constructed, each of which excludes one group of variables. The model with the lowest accuracy suggests that the deleted variable group has the strongest influence on S-A alternation. Hilpert concludes that phonological variables are strong determinants, and that syntactic variables and lexical frequency are much weaker predictors.
The findings of Hilpert (Reference Hilpert2008) will be compared with ours in sections 5 and 6 as both studies use similar methodology to study S-A variation of comparatives. It is noteworthy that the predictors and the data used in the two studies are not exactly the same. Each study has a few predictors such as Complement(P) and FS_s_st_sh that are exclusive to the study. Further, the definitions of some variables differ slightly. Complement in Hilpert's study is restricted to only to-infinitive complements. Also, our study distinguishes three types of positions (attributive, predicative and postnominal) whereas Hilpert only distinguishes the former two.
Although our multifactorial analysis largely mimics Hilpert's, we will take on three issues not tackled in his studies. First, while Hilpert (Reference Hilpert2008) has only dealt with comparatives, we will highlight the similarities and differences between comparatives and superlatives. Second, Hilpert's analysis of predictive power was run for variable groups but not for individual variables. For example, as both final stress and final consonant cluster are part of the phonological group, one cannot easily tell which one exerts a stronger influence on S-A alternation. Third, even though our study cannot include all variables proposed in the past, we include a few variables proposed in other studies that were not considered in Hilpert's (Reference Hilpert2008) study, e.g. prepositional complement and final sibilant segments (see Mondorf Reference Mondorf2009).
3 Description of predictor variables
The predictor variables selected in this study were previously reported to be significant to the S-A alternation of comparatives or superlatives. All predictors are categorical variables, except SyllNum, Pos_Freq, CompPos_Ratio and SuplPos_Ratio.
3.1 Phonological predictors
A. Number of syllables (SyllNum). It is well established that the number of syllables of an adjective is an important determinant of S-A alternation (see Huddleston & Pullum Reference Huddleston and Pullum2002; Biber et al. Reference Biber, Johansson, Leech, Conrad and Finegan1999; Mondorf Reference Mondorf2009). Shorter adjectives (e.g. free) strongly prefer the synthetic form, whereas longer ones (e.g. comfortable) favour the analytic form. SyllNum refers to the number of syllables of the positive adjective and is a continuous variable.
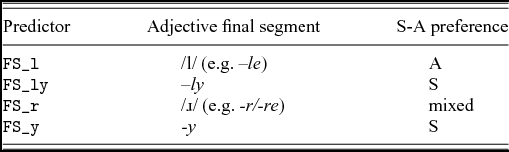
B. Final segments. Based on earlier research, Kytö & Romaine (Reference Kytö and Romaine1997) report that the final segments of adjectives influence S-A preference. Final segments, such as -y, -ly, -le and -er have been examined. Final segments in /i/ (e.g. easy, friendly), /l/ (e.g. cruel) or /ɹ/ (e.g. clever) favour the synthetic form. Mondorf (Reference Mondorf2009: 19) and Hilpert (Reference Hilpert2008: 309), on the other hand, point out that adjectives ending in /ɹ/ are more likely to be rendered analytically. Lindquist (Reference Lindquist1998) as well as Leech & Culpeper (Reference Leech and Culpeper1997: 359) distinguish -ly from -y (even though they both end in /i/), claiming that -ly adjectives are more analytic-oriented. The list of final segments is provided in table 1. The predictor FS_ly is reserved specifically for adjectives ending in -ly (e.g. friendly), and the predictor FS_y, for /i/-endings other than -ly. Syllabic /ɹ/ and /l/ final segments are also separated.Footnote 5
Phonological variables for various adjective final segments (A = analytic; S = synthetic)

C. Avoid haplology. Some studies (Sweet [Reference Sweet1891] Reference Sweet1968: 327, as cited in Mondorf Reference Mondorf2009: 24; Plag Reference Plag, Kehrein and Wiese1998; Kytö & Romaine Reference Kytö, Romaine and Wright2000: 185) note a tendency for adjectives ending in /ɹ/ and /s, st, ʃ/ to take analytic comparatives and superlatives respectively. It has been suggested that the (near-)adjacent repetition of identical features such as /ɹ/ (e.g. clearer, severer) and sibilant consonants (e.g. harshest, vastest) makes the sequence more difficult to pronounce. As a result, the analytic variant is favoured in order to avoid phonological haplology. Two predictors are introduced to capture the effect in both the comparative and superlative logistic regression models.
-
• FS_r: [same as the predictor mentioned in B]
-
• FS_s_st_sh: adjective ending in a sibilant, i.e. /s/, /st/ or /ʃ/.
One may wonder why FS_r is needed in the superlative model. After all, the -est morpheme does not clash with an adjective X r ending in /ɹ/. We still include FS_r because /ɹ/ could potentially disfavour the use of the -er morpheme. The rarer use of the synthetic comparative marker -er on X r may result in a dispreference of the synthetic superlative -est on X r for consistency across the two related categories. Including both predictors in the analyses allows us to detect such an effect. By the same token, FS_s_st_sh is included in the comparative model.
D. Consonant cluster (Cons_Cluster). Consonant cluster endings /pt/ (e.g. apt, corrupt) and /kt/ (direct, correct) have been claimed to increase processing effort (Görlach Reference Görlach1991: 93; Mondorf Reference Mondorf2009: 31–3). As a support strategy which compensates for the added cognitive effort, the analytic variant is more often used among these adjectives (see Mondorf Reference Mondorf2009: 31–3). The predictor indicates the presence of consonant clusters at the end of the adjective. Following Hilpert (Reference Hilpert2008: 400), adjectives ending in /l/ and in a consonant cluster at the same time such as ample only receive a positive value for Cons_Cluster but not FS_l.
E. Stress on final syllable (Final_Stress). Adjectives with stress on the final syllable are more likely to take the synthetic variant -er (see Leech & Culpeper Reference Leech and Culpeper1997). Mondorf's (Reference Mondorf2009: 23) explanation for the preference is that the -er suffix can serve as a ‘buffer’ to avoid two consecutive stressesFootnote 6 in a row when the comparative is immediately followed by an initially stressed noun, as shown in (5).
-
(5)
-
(a) a since rer gesture (two stressed syllables separated by an unstressed one)
-
(b) a more sincere gesture (two consecutive stressed syllables)
-
Although Mondorf (Reference Mondorf2009: 22) notes this tendency, the effect is not very strong. The variable Final_Stress helps to check if the final stress of an adjective plays a role in the S-A alternation.
3.2 Syntactic predictors
F. Positional distribution (Position). Predicative comparatives are positively correlated with the analytic form whereas attributive comparatives correlate with the synthetic form (see Leech & Culpeper Reference Leech and Culpeper1997: 357; Lindquist Reference Lindquist2000: 126; González-Díaz Reference González-Díaz2008: 110–11; Mondorf Reference Mondorf2003: 286–7, Reference Mondorf2009: 80). Leech & Culpeper (Reference Leech and Culpeper1997) suggest that the attributive use of more could result in ambiguity between a comparative marker (e.g. [more happy] stories) and a determiner (e.g. more [happy stories]). To avoid the ambiguity, synthetic comparatives are favoured in attributive position. Leech & Culpeper (Reference Leech and Culpeper1997) as well as Mondorf (Reference Mondorf2009) include a third category for ‘postnominal’ position, as in (9). They observe that postnominal comparatives pattern with predicative comparatives, preferring the analytic form. Therefore, the predictor ‘positional distribution’ has four possible values:
-
• Predicative (P): adjective serving as a predicate,Footnote 7 e.g. (7)
-
• Attributive (A): adjective preceding and modifying a nominal, e.g. (8)
-
• Postnominal (N): adjective occurring after a nominal,Footnote 8 e.g. (9)
-
• Others (O): all positions other than the above, e.g. correlative comparatives (10a) and nominalized superlatives, e.g. the coldest of stares.
-
(6) I should have been more strict with you. (BNC: HWC-1030)
-
(7) Where these signs are not obvious, subtler discriminations can be made . . . (BNC: CAH-1184)
-
(8) She had put on something rather more dressy. (BNC: H8F-1369)
-
(9) . . . the angrier Gebrec became, the more Erdle taunted him. (BNC: GVP-2998)
G. Premodification. When the comparative/superlative is immediately preceded by a modifying adverb,Footnote 9 like considerably, even, ever, far, much, significantly, slightly, still, yet, a bit or a lot, the example will be marked as being premodified, as illustrated in the examples below.
-
(10) The note taken from the victim's purse was even briefer. (BNC: G3E-1264)
-
(11) The very simplest kind of perceptron consists of a single node. (BNC: FNR-1772)
H. Complement type (Complement). Poutsma (Reference Poutsma1914: 477, cited in Mondorf Reference Mondorf2009: 57) observed early on that adjectives with a complementFootnote 10 tend to form comparatives analytically. Complement has four possible values, namely, to-infinitive complement (T) (13), PP complement (P) (14, 15), other complements (O) (16) and no complements (Z).
-
(12) Telecommunications were easier to build, service, and tap in this way. (BNC: A64-1512)
-
(13) One set of parents were very understanding but the others were more angry about it, although they are calmer now. (BNC: CBF-5492)
-
(14) But when I go from hence to this testing I must leave affairs here in one pair of hands, the closest and dearest to me. (BNC: K8S-2138)
-
(15) And in any case, it's most likely that it was a completely misleading headline in the press. (BNC: KGR-458)
The proportion of analytic comparatives is higher when the comparative has a to-infinitive complement (see Mondorf Reference Mondorf2003: 262, Reference Mondorf2009: 59) or a prepositional complement (see Mondorf Reference Mondorf2003: 266, Reference Mondorf2009: 72). Hilpert (Reference Hilpert2008: 408) confirms that the to-infinitive complement is a significant predictor of the alternation, but he does not test for prepositional complements.
I. Presence of than phrase (Than_Phrase). There has been speculation that the than phrase is a complement of the comparative and might lead to more frequent use of more. Lindquist (Reference Lindquist2000) considers the than phrase a ‘postmodification’, not a complement. Its effect is debatable, though. While many studies (see Leech & Culpeper Reference Leech and Culpeper1997; Lindquist Reference Lindquist2000; Mondorf Reference Mondorf2009) found no noticeable correlation, Hilpert (Reference Hilpert2008) did. Mondorf (Reference Mondorf2009: 78–80) explains that the stipulation of a correlation results from a misconception, because the than phrase may not be treated as an adjectival complement in the first place, as it is dependent on the degree marker rather than the adjective itself. This predictor is included in our comparative model, though we are aware of its doubtful status as an adjectival complement.
3.3 Lexical frequency predictors
High-frequency adjectives tend to be shorter in length and prefer synthetic -er. Mondorf's (Reference Mondorf2009: 40) data shows that highly frequent comparatives correlate with the synthetic variant. Hilpert (Reference Hilpert2008: 402) furthermore uses the ratio of comparative/positive in his logistic regression model. He argues that a high ratio of comparative/positive implies that the adjective is highly gradable, and highly gradable adjectives are more likely to form comparatives synthetically. The following continuous predictors are used in our analysis.
-
• Pos_Freq: frequency of the positive form of the adjective
-
• CompPos_Ratio: comparative/positive ratio (for comparatives only)
-
• SuplPos_Ratio: superlative/positive ratio (for superlatives only)
4 Methodology
4.1 Corpus data
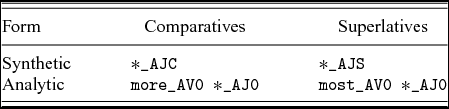
The data used were extracted from the BNC XML edition, a 100-million-word collection of spoken and written texts. It contains British English near the end of the twentieth century (see Aston & Burnard Reference Aston and Burnard1997; Burnard Reference Burnard2007). The BNC includes 90 million words of written English and 10 million words of spoken English. Its size makes it possible to collect a large amount of tokens. Also, the BNC has part-of-speech tags for positive adjectives (AJ0), comparative adjectives (AJC), and superlative adjectives (AJS) (Burnard Reference Burnard2007), making it easy to retrieve examples with the search queriesFootnote 11 in table 2. Mondorf (Reference Mondorf2009: 202) comments that due to possible tagging errors in the BNC, some relevant examples may not be correctly retrieved. However, she also notes that the use of a large amount of examples from the BNC would likely not considerably skew the overall results.
Search queries for comparatives and superlatives (AJ0 = positive adjectives, AJC = comparative adjectives, AJS = superlative adjectives, AV0 = adverbs)

A total of 324,005 comparatives and 141,641 superlatives were retrieved using the search patterns in table 2. Adjective types whose analytic-to-synthetic or synthetic-to-analytic ratio is smaller than 0.005Footnote 12 (i.e. 1:200) were removed. This procedure removes adjectives that do not display S-A variationFootnote 13 and adjectives for which one variant is extremely rare. For example, the analytic-to-synthetic ratio of fast is 2:1,130 (= 0.0018). The analytic form is so rare that the two examples are possibly due to production errors or characteristic of one particular speaker's idiolect. If fast were retained, the 1,130 synthetic examples would have to be included, possibly inflating the synthetic form in the dataset. This step also substantially reduces the total amount of examples to be processed. In a final step, irrelevant examples were manually discarded, e.g. mis-taggings (17), determiner uses of more (18) and adverbial uses (19).
-
(16) What meanest thou by this word Sacrament? (BNC: AC7-456)
-
(17) This makes sense in Japan where (because of stellar house prices) most young single professionals still live at home with their parents and have cash to spend, . . . (BNC: ABG-2192)
-
(18) Somehow the message isn't getting through – or worse, it's getting twisted. (BNC: G35-1788)
It should be noted that nominal uses of comparatives and superlatives are included, e.g. the funnier of the two (Mondorf Reference Mondorf2009: 12) and the coldest of stares (BNC: HGE-31). However, we discarded examples of elatives, e.g. a most lovely situation. Such intensification use of superlatives is functionally different from the superlative use. Further, elatives may skew the count of analytic superlative because the most variant is always used in such use (Mondorf Reference Mondorf2009: 25).
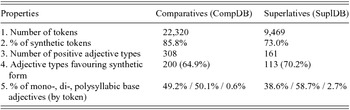
The collected examples are stored in two databases, namely, CompDB (comparatives) and SuplDB (superlatives). The basic statistics of the databases are provided in table 3. A total of 22,320 tokens (308 types) of comparatives and 9,469 tokens (162 types) of superlatives were collected. Comparative examples are more than twice as frequent as superlative examples, which is in line with Claridge (Reference Claridge2007).Footnote 14 The synthetic form accounts for 85.82 per cent of the comparative data and 72.56 per cent of the superlative data.Footnote 15 Although the synthetic variety dominates both databases, the bias is stronger in the comparative dataset.
Statistics of the two databases

4.2 Data annotation
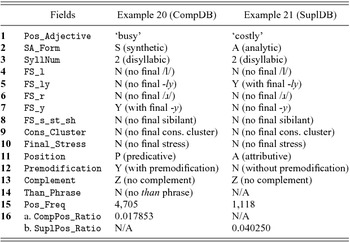
Each example in the databases is annotated with respect to a set of predictor variables. Table 4 shows the annotation of examples (20) and (21).
-
(19) In later years, after the oil fields were established, he was to be even busier when a helicopter pad was built in Unst. (BNC: H0C-1132)
-
(20) At a cost of at least $1,900 million, the implementation of UNTAC would be the largest and most costly operation in the UN's history. (BNC: HLG-992)
Two sample entries from the databases (‘N/A’ means the variable is not applicable)

4.3 Logistic regression
Logistic regression is a statistical model that predicts a binary classification using a set of categorical and/or continuous predictor variables (see Burns & Burns Reference Burns and Burns2008; Field & Miles Reference Field and Miles2010). SAS Studio Release 3.5Footnote 16 was used to construct a regression model for comparatives and another one for superlatives. The predictor variables described in section 3 serve as predictors in the regression model for predicting the choice between synthetic and analytic forms.
When a logistic regression model is constructed, it is important to ensure that it is free of multicollinearity.Footnote 17 Multicollinearity occurs when at least one predictor variable highly correlates with another predictor variable. In other words, the value of one variable can be predicted from the other with a very high degree of accuracy. Strong multicollinearity renders the estimation of the explanatory power of predictor variables unreliable (see Baayen Reference Baayen2008: 181). One way of diagnosing multicollinearity is to refer to the ‘Variance Inflation Factors’ (VIF) of variables (see Allison Reference Allison2012). A VIF of 5 or greater indicates a reason to be concerned about multicollinearity. Before the regression analysis is performed, the VIFs are computed for each predictor variable in the two models. Two pairs of variables are found to be highly correlated, namely, (i) Final_Stress and FS_y (comparative model) and (ii) Final_Stress and FS_ly (superlative model). A possible way to resolve the multicollinearity problem is to discard a correlated variable. We decided to remove Final_Stress from both models. After that, multicollinearity disappears.
4.4 Predictor variables
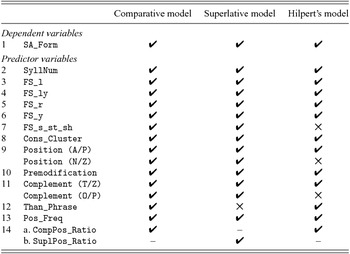
The variables entered into the models are given in table 5.
Variables entered into the regression models

4.5 Statistical tests for logistic regression models
Several sets of parameters are used to evaluate the logistic regression model and the contribution of predictors in the model.
4.5.1 Goodness of fit
The goodness of fit of a logistic regression model assesses whether the model is a better fit to the data over the intercept-only model (i.e. a model without any predictor variables). If the logistic regression model is significantly different from the null hypothesis, it means at least one predictor in the model contributes to the improvement of the fit of the model. Three chi-square tests (Likelihood Ratio, Score and Wald) are used to indicate whether the regression model differs significantly from the null hypothesis.
4.5.2 Pseudo R2 statistics
According to Allison (Reference Allison2012: 68), it is not ‘uncommon to have a model that fits well, as judged by . . . goodness-of-fit statistics, yet has very low predictive power’. To test whether this is the case, ‘R-Square’ and ‘Max-rescaled R-Square’ are also included in our report. This class of statistics assesses how well the model predicts the dependent variable based on the predictor variables.
4.5.3 Classification accuracy
Another important metric of the model is its classification accuracy. It informs us how well the model predicts the outcome of the dependent variable using sample observations. The evaluation procedure uses the model coefficients to predict values. Afterwards, the predicted target variable is compared with the observed values for each observation.
4.6 Statistical tests for contribution of predictors
4.6.1 Effect of individual predictors
The Wald chi-square statistic tests the null hypothesis that an individual predictor's regression coefficient is zero (i.e. no contribution), provided that the other predictor variables are in the model. If the predictor makes a statistically significant contribution to the alternation, one expects its p-value to be smaller than 0.05 (i.e. the null hypothesis is very unlikely). Note, however, that one cannot assess the relative magnitude of the contribution of predictors based on the p-value of the Wald statistic (Allison Reference Allison2012).
4.6.2 Relative contribution of individual predictors
The relative contribution of predictors can be compared with reference to their standardized coefficients, which measure ‘how many standard deviations the dependent variable y changes for a 1-standard deviation increase in each of the x variables’ (Allison Reference Allison2012: 89). These coefficients serve as a metric for comparing the relative importance of individual predictor variables in the logistic regression model (see Menard Reference Menard2011; Tonidandel & LeBreton Reference Tonidandel and LeBreton2011; Allison Reference Allison2012: 89), rather than comparing them at the variable group level (see section 4.6.3). The coefficients also allow comparison regardless of variable type (i.e. continuous vs categorical).
4.6.3 Contribution of predictors in groups
To evaluate the relative importance of predictors as a group (i.e. phonological vs syntactic vs frequency), Hilpert constructed three additional logistic regression models, each of which leaves out one group of predictors, i.e.:
-
• all variables except phonological ones,
-
• all variables except syntactic ones, and
-
• all variables except frequency ones.
By observing the degradation of the accuracy after a variable group is removed, one can estimate the relative impact of the respective group. This ‘variable-group removal’ method will also be used in our study.
5 Results
5.1 Comparatives
5.1.1 Evaluation of overall model
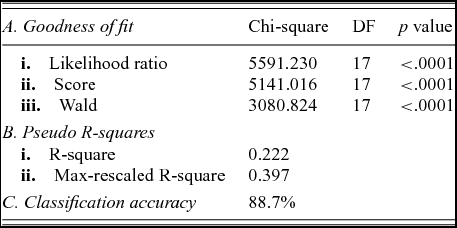
Table 6 summarizes the results of the full regression model fitted to comparatives.
Assessment of logistic regression model of comparatives

The goodness of fit tests above shows that the comparative model with the predictor variables fit the data better than the model without the variables. The p-values of the three chi-square tests (Likelihood Ratio, Score and Wald) are all less than 0.0001. The R-Square (0.222) and Max-rescaled R-Square (0.397) suggest that the predictor variables are moderately good predictors of the dependent variables. The model improves the classification accuracy from 85.8 to 88.7 per cent.
5.1.2 Evaluation of contribution of predictors
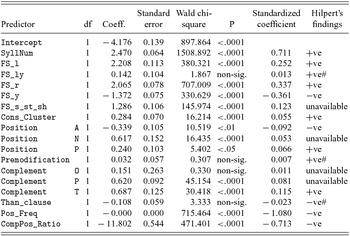
In table 7, each predictor variable demonstrates an effect on the S-A variation with p-value smaller than 0.0001. For comparison, the last column shows Hilpert's (Reference Hilpert2008: 407) findings of the comparative form that the variables favour. Among the 17 predictors, 13 of them are significant but FS_ly, Premodification, Complement(O) and Than_clause are non-significant.
Assessment of individual predictors’ contribution to the model of comparatives. Positive coefficients (or ‘+ve’) indicate a preference for analytic more; negative coefficients (or ‘–ve’) indicate a preference for synthetic -er. # indicates that the significance of the predictor in our model is different from that in Hilpert's model.

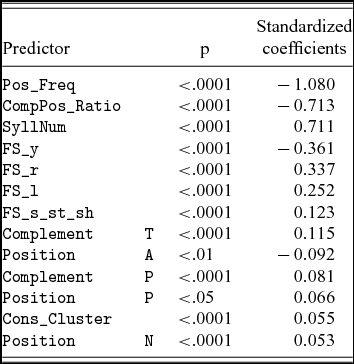
For convenience of comparing their relative importance, table 8 ranks predictors in descending order of the absolute value of standardized coefficients. Phonological and frequency variables are generally ranked high, whereas syntactic ones are low on the list. The standardized coefficients allow us to derive the following ranking of the relative strength of individual predictors.
-
(21)
-
A. Phonological variables
-
SyllNum > FS_y > FS_r > FS_l > FS_s_st_sh > Cons_Cluster
-
B. Syntactic variables
-
Complement(T)>Position(A)>Complement(P)>Position(P)>Position(N)
-
C. Frequency variables
-
Pos_Freq > CompPos_Ratio
-
Relative importance of predictors (in descending order of the absolute value of standardized coefficients)

Frequency and phonological variables are generally stronger predictors. Even though phonological variables are generally influential, Cons_Cluster is weaker than the others in the group. The impact of Position(P) and Position(N) is relatively small.
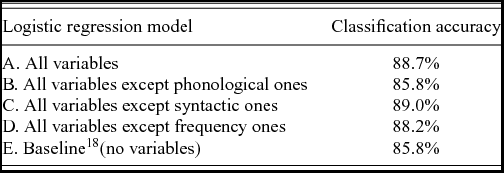
Table 9 shows the results of the contribution of variable groups using the ‘variable-group removal’ method. With all the predictors, the model has a classification accuracy of 89.0 per cent. This percentage should be compared to the rate of correct predictions achieved by always guessing the most frequent outcome (see model E), which is 85.8 per cent.
Comparison of contribution of variable groups in the comparative model

The phonological group exerts the greatest influence. The classification accuracy decreases most (–2.9%) when phonological variables are discarded, i.e. in model B. Frequency variables are fairly useful (–0.5%). Surprisingly, the inclusion of syntactic variables actually has a slight adversary effect on the classification (compare models A and C).
Last, let us compare our model with Hilpert's (Reference Hilpert2008) model. FS_s_st_sh, Position(N) and Complement(O/P) are not investigated in Hilpert's regression model. Our model largely replicates Hilpert's model in terms of the significance and the S-A preference of predictors. The major difference is that FS_ly,Footnote 19 Premodication, Complement(O) and Than_clause are significant predictors in Hilpert's model but the variable is not significant in our model.
5.2 Superlatives
5.2.1 Evaluation of overall model
The assessment of the regression model for superlatives is given in table 10.
Assessment of logistic regression model of superlatives

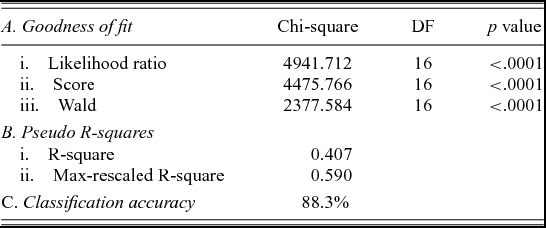
The p-values of the three chi-square tests (Likelihood Ratio, Score and Wald) for the goodness of fit of the regression models are all less than 0.0001. Again, the regression model with the predictor variables fit the data better than the model without the variables. The R-square (0.407) and Max-rescaled R-square (0.590) also suggest that the predictor variables are strong predictors of the dependent variables. The model improves the classification accuracy from 73.0 to 88.3 per cent.
5.2.2 Evaluation of contribution of predictors
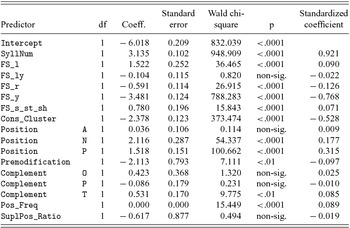
Among the 16 predictor variables, 11 of them have a p-value smaller than 0.05. FS_ly, Position(A), Complement(O), Complement(P), and SuplPos_Ratio do not have an effect on the choice of the superlative forms, as shown in table 11.
Assessment of individual predictors’ contribution to the model fitted to superlatives

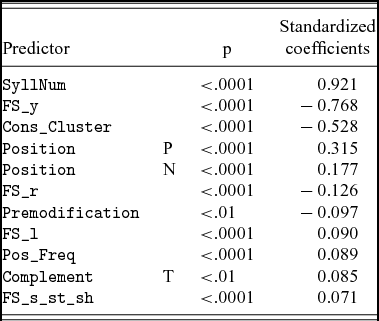
As in the comparative model, phonological variables are generally ranked high in the superlative model. Syntactic factors are found in the upper and lower half of the list. However, the frequency variable POS_Freq is pretty low in the superlative model but is very high in the comparative model (see table 12). The relative strength of individual predictors is ranked in each variable group in (23). SyllNum and FS_y emerge as more important variables in the phonological variable group, which is similar to what we found in the comparative model. The contribution of syntactic predictors in the comparative and superlative models is quite different. Important syntactic predictors in the superlative model, e.g. Position(P) and Position(N), are pretty low in the comparative model. The fact that SuplPos_Ratio is non-significant is unexpected considering the high ranking of CompPos_Ratio.
Relative importance of predictors (in descending order of the absolute value of standardized coefficients)

-
(22)
-
A. Phonological variables
-
SyllNum > FS_y > Cons_Cluster > FS_r > FS_l > FS_s_st_sh
-
B. Syntactic variables
-
Position(P) > Position(N) > Premodification > Complement(T)
-
C. Frequency variables
-
Pos_Freq
-
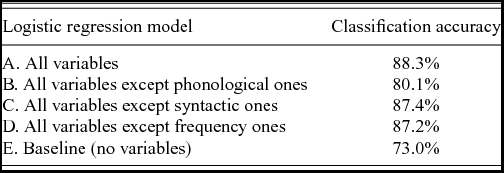
As shown in table 13, the predictors in the superlative model significantly improve the accuracy from 73.0 per cent (model E) to 88.3 per cent (model A). Discarding the phonological group has led to the greatest degradation in classification accuracy (model B), followed by the frequency group (model D) and the syntactic group (model C).
Comparison of contribution of variable groups in the superlative model

6 Discussion
6.1 Identification of predictors
We begin to address the first research question by identifying the predictors that are statistically significant in the two models based on sections 5.1.2 and 5.2.2.
Comparatives (13 predictors)
-
• SyllNum, FS_y, FS_r, FS_l, FS_s_st_sh, Cons_Cluster
-
• Complement(T), Position(A), Complement(P), Position(P), Position(N)
-
• Pos_Freq, CompPos_Ratio
Superlatives (11 predictors)
-
• SyllNum, FS_y, Cons_Cluster, FS_r, FS_l, FS_s_st_sh
-
• Position(P) > Position(N) > Premodification > Complement(T)
-
• Pos_Freq
(Note: underlined predictors are significant only in one model.)
The set of significant predictors in the two models consists of the following ten variables: SyllNum, FS_y, FS_r, FS_l, FS_s_st_sh, Cons_Cluster, Complement(T), Position(P), Position(N) and Pos_Freq. The phonological variables mostly have an effect in both models. In contrast, only three out of seven syntactic variables are significant predictors in both models.
6.2 Contribution of predictors
This section addresses the second research question about the relative contribution among the predictors. The standardized coefficient offers a measure to compare the contribution of individual predictors. Here are the top five predictors of the two models from tables 8 and 12.
Comparatives (top five in descending order)
-
• Pos_Freq > CompPos_Ratio > SyllNum > FS_y > FS_r
Superlatives (top five in descending order)
-
• SyllNum > FS_y > Cons_cluster > Position(P) > Position(N)
A more detailed discussion and comparison of important predictors can be found in the next section.
6.3 Comparative vs superlative
The crucial question of our study is how far S-A variation differs between comparatives and superlatives. The findings so far suggest that the two share some similarities but also display obvious differences.
6.3.1 Degree of syntheticity bias
The syntheticity bias has some significant implications for the role of the predictors in the models. The use of the same methodology in both models enables us to compare their degree of syntheticity bias. Among the tokens collected, 85.8 per cent in CompDB are synthetic, which contrasts with only 73.0 per cent in SuplDB. Thus, our parallel analysis of both the comparative and the superlative alternation empirically validates the claim that the synthetic bias is stronger in comparatives than in superlatives. The discrepancy has some implications for regression models. A stronger bias entails a higher baseline accuracy. Improvement of prediction accuracy becomes more difficult. Despite the inclusion of 17 predictors and the larger dataset in the comparative model, classification accuracy only raises from 85.8 to 88.7 per cent. The remaining misclassified cases are possibly those involving idiolectal or lexical preferences. In contrast, with a lesser syntheticity bias, the predictors in the superlative model play a greater role in improving the accuracy from 73.0 to 88.3 per cent.
6.3.2 Predictor contribution
Variable group level
The impact of the three variable groups looks very similar in the comparative and superlative models at the variable group level using the variable-group removal method. The influence of the three groups in both models can be summarized by the hierarchy in (24) (see also tables 9 and 13).
-
(23) Phonological group > Frequency group > Syntactic group
The phonological group is consistently more important than the other two, as the removal of the phonological group has led to a larger reduction in classification accuracy. The frequency group and syntactic group are weaker with the former being slightly stronger than the latter. Hilpert (Reference Hilpert2008) comes to a similar conclusion about the hierarchy in (24) for S-A variation in comparatives.
Readers may note that frequency variables rank even higher than phonological variables with respect to standardized coefficients in comparatives, which seems to contradict the hierarchy in (24). One explanation is that even though frequency variables tend to score high on the standardized coefficient in the comparative model, the frequency group has only two variables. In contrast, the phonological group has seven variables, possibly making the overall contribution of the phonological group much more prominent in the hierarchy.
Individual predictor level
The standardized coefficient offers an additional measure to compare the contribution at the individual predictor level. Here are the top five and bottom five predictors from the two models (see tables 8 and 12).
Comparatives (in descending order)
-
• Top five: Pos_Freq > CompPos_Ratio > SyllNum > FS_y > FS_r
-
• Bottom five: Position(A) > Complement(P) > Position(P) > Cons_Cluster > Position(N)
Superlatives (in descending order)
-
• Top five: SyllNum > FS_y > Cons_cluster > Position(P) > Position(N)
-
• Bottom five: Premodification > FS_l > Pos_Freq > Complement(T) > FS_s_st_sh
More phonological predictors are found among the top five predictors. SyllNum and FS_y outrank most other predictors on both models. Some divergences at the predictor level stand out in the results. One notable difference between the models is that although many syntactic variables are weak or non-significant predictors in comparative choice, syntactic variables seem to contribute more strongly in the superlative model, e.g. Position(N/P). While CompPos_Ratio contributes much to the comparative model, the influence of its counterpart SuplPos_Ratio is negligible in the superlative model. Moreover, even though frequency variables are important predictors in both models, higher frequency favours syntheticity in comparatives but analyticity in superlatives. These discrepancies call for further scrutiny in future research. The empirical findings show that claims about comparative variation do not carry over to superlative variation.
6.4 More support for more-support?
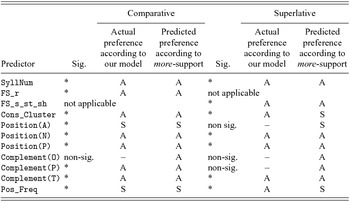
Recall that Mondorf (Reference Mondorf2003, Reference Mondorf2009) proposes the processing view of more-support to explain the S-A variation of comparatives. In essence, cognitively more complex or difficult structures tend to align with the analytic variant. The question arises whether analytic forms also serve as a support strategy with superlatives, i.e. whether Mondorf's claims can be extended to superlatives. To examine how Mondorf's (Reference Mondorf2009: 197–9) prediction fares in our two models, we have listed the predicted preferences and the actual preferences in table 14. Predictors about which Mondorf has made explicit claims are included and their equivalents in our models are shown below.
Predicted and actual preference of predictors (A = analytic, S = synthetic)

Mondorf's predictions are borne out much more accurately in the comparative model. In the superlative model, five predictors clearly support her predictions that analytic variants act as a support strategy mitigating the processing load. However, the observed preferences of Pos_Freq and Cons_Cluster are opposite to those predicted by more-support. Also, three syntactic variables have no significant influence on S-A choice. It would be interesting to scrutinize in the future whether and why ‘most-support’ does not seem to fare as well as more-support.
6.5 Context-(in)sensitivity of predictors
The regression results may imply that one should focus on phonological and frequency variables in the investigation of the S-A alternation of comparatives and superlatives. After all, syntactic variables contribute relatively little. This tendency is even stronger in the comparative model. However, it is still important not to neglect the syntactic variables even if their contribution is relatively small. Why? Recall that the goal of our research is to understand under which conditions a comparative/superlative is realized synthetically or analytically. For example, 88 per cent of the superlatives of healthy in SuplDB are rendered synthetically and the remainder analytically. Ideally, the regression model can inform us about the likelihood of each form, such as in (23) and (24).
-
(24) Taking regular exercise is one of the healthiest things that women can do. (A0J-1692)
-
(25) Today's population in their 20’s is the most healthy, [. . .] (CC3-30)
Most phonological variables, however, are not able to do this as they are based on the inherent properties of adjectives, i.e. they are context-insensitive. The values for the phonological and frequency variables, such as SyllNum, FS_y and Pos_Freq, are the same for (23), (24) and all other examples involving healthy in SuplDB. In contrast, syntactic variables are context-sensitive and thus have the potential to unveil whether there is a relationship between S-A choice and context. Unless we believe that S-A variation is independent of context, syntactic variables should remain a crucial issue of the research on S-A variation. Here we want to highlight one syntactic variable which deserves more attention in future research: Leech & Culpeper (Reference Leech and Culpeper1997) as well as Lindquist (Reference Lindquist2000) claim that coordinated comparatives or superlatives tend to promote matching S-A forms in both conjuncts, which, in turn, affects the likelihood of how comparatives/superlatives are rendered.Footnote 20 In our datasets, coordinated comparatives account for 11.8 per cent of CompDB, whereas coordinated superlatives yield 8.3 per cent of SuplDB. If the conjunct parallelism claim is correct, it can potentially explain some of the patterns we cannot account for now. However, due to the complexity of data annotation, the issue has not been taken up in the present study.
7 Conclusion
Logistic regression analysis enables us to assess and compare the simultaneous contribution of a set of predictors towards the S-A variation. Applying the same corpus methodology, we have constructed two regression models to analyse the S-A alternation of comparatives and superlatives. Our methodology is similar to that of Hilpert (Reference Hilpert2008) but our study of S-A alternation covers not only comparatives but also superlatives. We have also included some predictors not considered in Hilpert's (Reference Hilpert2008) study which have been reported to be relevant elsewhere, such as FS_s_st_sh, Position(N) and Complement(P); and they turn out to be helpful to some extent in explaining some of the variation. On the whole, the syntheticity bias is stronger in comparatives than in superlatives.
Based on the classification accuracy of the models, we find that the predictors of superlatives contribute more notably over the baseline accuracy in predicting the S-A choice than predictors of comparatives. Thirteen out of 17 predictors have a significant influence on comparative variation, whereas only 11 out of 16 predictors have a significant influence on superlative choice. Phonological variables generally contribute most to the variation, followed by frequency variables and syntactic variables. In both models, SyllNum and FS_y consistently outrank other predictors. Notable differences between comparatives and superlatives have been detected: even though some syntactic variables, e.g. Premodification and Position(N), are non-significant or weak for comparatives, they contribute much more in the superlative model.
For comparatives, the distribution of synthetic vs analytic variants is in line with Rohdenburg's Complexity Principle (Reference Rohdenburg1996) and analytic support (Mondorf Reference Mondorf, MacWhinney, Malchukov and Moravcsik2014), which predict that the more explicit variant tends to be preferred in cognitively complex environments. For superlatives, analytic variants also served as a support strategy with most factors, but more frequent adjectives triggered syntheticity in comparatives and analyticity in superlatives, a finding that calls for further research on superlative alternation.