Introduction
Early diagnosis of the borderline condition between healthy aging and dementia may be important for health policy planning for dementia prevention or early intervention, since some borderline cases are reported to be reversible (Larrieu et al., Reference Larrieu2002). This condition is referred to as mild cognitive impairment (MCI) (Petersen et al., Reference Petersen, Smith, Waring, Ivnik, Kokmen and Tangelos1997) or Clinical Dementia Rating (CDR; Morris, Reference Morris1993) 0.5, and the rate of progression to dementia is 8–20% per year. Impairment of cognitive functions such as recent memory and executive function (Chen et al., Reference Chen, Ratcliff, Belle, Cauley, DeKosky and Ganguli2000) and a lower clinical observation score (Morris et al., Reference Morris2001) are predictors of decline.
Hippocampal atrophy (Visser et al., Reference Visser, Verhey, Hofman, Scheltens and Jolles2002) shown by magnetic resonance imaging (MRI) is characteristic of the neurological background of CDR 0.5 subjects, particularly in association with early Alzheimer's disease (AD). Five major longitudinal studies of MCI have been performed using the baseline cerebral metabolic rate for glucose (CMRglc) determined by positron emission tomography (PET) with [18F]fluoro-deoxyglucose (FDG) (Arnaiz et al., Reference Arnaiz2001; Chetelat et al., Reference Chetelat, Desgranges, de la Sayette, Viader, Eustache and Baron2003; Drzezga et al., Reference Drzezga2003; Mosconi et al., Reference Mosconi2004; Fellgiebel et al., Reference Fellgiebel, Scheurich, Bartenstein and Muller2007). All these studies used clinic samples, with four using neuropsychological tests based on Petersen's MCI criteria (Petersen et al., Reference Petersen, Smith, Waring, Ivnik, Kokmen and Tangelos1997) and the fifth using Global Deterioration Scale (GDS) 3 criteria (Reisberg et al., Reference Reisberg, Ferris and de Leon1982). After following the subjects for 1–3 years, amnestic MCI subjects showing AD-like metabolic changes (decreased CMRglc in the temporoparietal areas and posterior cingulate) were found to be at risk for conversion to AD.
Follow-up FDG-PET has not been performed in CDR 0.5 subjects, but follow-up with other approaches has indicated that CDR 0.5 subjects with a higher CDR-sum of boxes (SB) score more frequently decline to AD compared with those with lower CDR-SB scores (Morris et al., Reference Morris2001). CDR 0.5 subjects with a higher SB score also show decreased metabolism in AD-specific areas (Perneczky et al., Reference Perneczky, Hartmann, Grimmer, Drzezga and Kurz2007). These results suggest that CDR 0.5 converters to AD have an AD-like metabolic pattern, and the aim of this study was to examine this hypothesis using FDG-PET in our MCI/CDR 0.5 cohort.
The Osaki-Tajiri Project, previously called the Tajiri Project, is a community-based program on stroke, dementia, and bed-confinement prevention in Osaki, northern Japan. In our Prevalence Study 1998 (Meguro et al., Reference Meguro2002), we reported rates of CDR 0.5 and MCI of 30.1% and 4.9%, respectively, with CDR 0.5 having a significantly greater prevalence (Meguro et al., Reference Meguro2004). Among the participants in Prevalence Study 1998, we were able to examine CMRglc for 68 people and follow them for five years, after which we examined the incidence of dementia that developed in CDR 0 and 0.5 subjects (Incidence Study 2003; Meguro et al., Reference Meguro2007). In the current study, we investigated whether the baseline CMRglc of CDR 0.5 converters to dementia manifests as metabolic changes specific to early AD.
Methods
Participants
In Prevalence Study 1998, 564 adults from among an epidemiologic population of 1,654 were randomly selected to undergo MRI (1.5T, Shimazu, Japan). The cost of all the MRIs was officially borne by the town. Finally, 497 participants agreed to undergo MRI: 346 CDR 0 (healthy), 119 CDR 0.5 (questionable dementia), and 32 CDR 1+ (dementia) subjects. T1-weighted (TR/TE 400/14) and T2-weighted (TR/TE 3000/90) images were used for assessing atrophy and cerebrovascular diseases, as described previously (Meguro et al., Reference Meguro2002).
Owing to the limited time available for FDG-PET examination at Tohoku University Cyclotron Radioisotope Center (an average of four patients a month), we had to select subjects who would receive PET. From the 497 subjects who underwent MRI, we randomly selected 35 CDR 0 (10% of 346) and 60 CDR 0.5 (50% of 119) subjects, and all 14 AD patients among the CDR 1+ group, for PET. Finally, we were able to examine 68 subjects using PET: 14 CDR 0, 42 CDR 0.5, and 12 AD. The other subjects refused to undergo PET examinations due to “psychological” reasons and the travelling distance between the community and the PET center (a one-hour drive).
All AD patients had a rating of CDR 1 and met the NINCDS-ADRDA criteria for probable AD (McKhann et al., Reference McKhann, Drachman, Folstein, Katzman, Price and Stadlan1984). All CDR 0.5 subjects showed mild cognitive dysfunction, but this did not affect their daily lives in the community and none met the DSM-IV criteria for dementia (American Psychiatric Association, 1994). All 68 subjects met the following inclusion criteria: (1) no history of stroke, head injury or systemic disorders that could affect brain function, and normal values of vitamin B1, B6, B12, folate, and thyroid hormones; (2) no cerebrovascular diseases as shown by MRI, and no marked neurological signs and symptoms; and (3) agreement of the subjects and family members to participate in Incidence Study 2003 and to be followed for five years.
Written informed consent was obtained from all CDR 0 and 0.5 subjects and from the families of CDR 0.5 and AD patients. The study was approved by the Ethical Committee of the Cyclotron Radioisotope Center of Tohoku University and the Tajiri SKIP Center.
CDR assessment
A clinical team of doctors and public health nurses determined the CDR while blinded to the cognitive tests (see below) and PET findings. Before being interviewed by the doctors, public health nurses visited the participants' homes to evaluate their daily activities. Observations by family members regarding the participants' lives were described in a semi-structured questionnaire; for participants who lived alone, public health nurses visited them frequently to evaluate their daily lives. The participants were interviewed by doctors to assess episodic memory, orientation, problem solving and judgment. Finally, the CDR stages were decided at a joint meeting, with reference to the information provided by the family. A reliable Japanese version of the CDR Work Sheet (Meguro, Reference Meguro2004) has been established, and one of the authors (K.M) has been certified as a CDR rater at the Alzheimer's Disease Research Center, Washington University School of Medicine. CDR 0.5 participants who converted to AD were classified as CDR 0.5/converters and those who did not convert as CDR 0.5/non-converters. The CDR was evaluated using the same approach at baseline and follow-up.
Cognitive assessment
A team of trained psychologists performed cognitive tests while blinded to the CDR stages and PET findings. These tests included the Mini-mental State Examination (MMSE; Folstein et al., Reference Folstein, Folstein and McHugh1975) and the Cognitive Abilities Screening Instrument (CASI) (Teng et al., Reference Teng1994). The CASI has nine domains: long-term memory, short-term memory, attention, concentration/mental manipulation, orientation, visual construction, abstraction and judgment, list-generating fluency, and language. The long-term memory domain evaluates knowledge and remote memory, and herein we refer to this domain as “remote memory.” The short-term memory domain assesses delayed recall of three words presented orally and immediate recall of five objects presented visually, and we refer to this domain as “recent memory.”
PET
The PET study was performed with a model PT931/04-12 scanner (CTI Inc., USA; axial/transaxial resolutions: 8 mm) using [18F]fluorodeoxyglucose (FDG) (Phelps et al., Reference Phelps, Huang, Hoffman, Selin, Sokoloff and Kuhl1979; Reivich et al., Reference Reivich1979). A short cannula was placed in a radial artery for blood sampling. Each subject was positioned with the OM line parallel to the detector rings according to brain slices collected by MRI. A cross of light was projected onto marks on the subject's head, which were set at standard points of 30 mm and 77 mm above and parallel to the OM line. A 20-minute transmission scan was performed using a 68Ge/68Ga external ring source. Thirty to 45 minutes after injection of 5–12 mCi of FDG, two emission scans were performed and data were collected simultaneously from each of seven contiguous axial sections. A total of 14 slices parallel to the OM line with a thickness of 6 mm were analyzed, encompassing virtually the whole brain. The detailed methodology has been described previously (Yamaguchi et al., Reference Yamaguchi1997).
Imaging analyses
ROI
After two different pairs of axial T1-weighted MRI and PET images were matched with each other at the same brain slice, the position of the regions of interest (circular ROIs, 2.7 cm2) were defined manually using the overlapped images. A total of 13 ROIs in each hemisphere were selected: upper frontal, anterior frontal, inferior frontal, parietal, temporo-parieto-occipital, primary auditory, temporal, hippocampus, primary visual, occipital, basal ganglia, cerebellum, and white matter. The detailed methodology has been described previously (Yamaguchi et al., Reference Yamaguchi1997).
SPM
Basic image processing and voxel-based data analysis were performed using SPM2 (Wellcome Department of Cognitive Neurology, London, U.K.) on a Windows XP machine. PET data were subjected to an affine and non-linear spatial normalization into the standard MNI PET template of SPM2, and to re-slicing of 2×2×2 mm. The PET images were smoothed using an isotropic Gaussian filter of 12 mm in diameter to compensate for intersubject gyral variability and to reduce high-frequency noise. The anatomically standardized images were then normalized by ANCOVA to a mean value of 50 mg/100 g/min. The four groups (CDR 0, CDR 0.5/non-converters, CDR 0.5/converters, AD) were compared with ANCOVA (covariance of age and educational level). Pairs of groups were compared with unpaired t-tests. For multiple comparison, significance was accepted if the voxels survived an uncorrected threshold of p<0.001.
Individual analysis
Individual CMRglc pattern analysis was conducted using the classification of Silverman et al. (Reference Silverman2001): N1, normal metabolism; N2, global hypometabolism; N3, focal hypometabolism; P1, parietal/temporal with/without frontal hypometabolism; P2, frontal predominant hypometabolism; P3, hypometabolism of both the caudate head and lentiform nuclei. N indicates non-progressive PET patterns, and P shows progressive PET patterns. P1 indicates a PET pattern consistent with AD, and P2 and P3 indicate progressive but non-AD patterns. The patterns were compared between CDR 0.5/non-converters and CDR 0.5/converters by χ2 test.
Clinical reassessments
In Incidence Study 2003, the CDR stages of all the subjects in the current PET study were reassessed to determine whether they met the criteria for dementia and AD. The reassessments were performed by evaluators who were blinded to the baseline CDR, neuropsychological tests, and PET findings. We mainly focused on CDR 0.5 subjects to determine whether they met the criteria for CDR 1 and AD.
Results
Clinical outcome
All participants in the CDR 0 group were reassessed as CDR 0 after the five-year period. In the CDR 0.5 group, 20 participants converted to AD (CDR 0.5/converters) and 22 participants remained as CDR 0.5 (CDR 0.5/non-converters). All AD patients declined to CDR 2. The demographics of the four groups are shown in Table 1. Age and educational level did not differ significantly among the groups. The AD group had significantly lower cognitive scores compared with the other groups.
Demographics of the study population at baseline

Shown are the mean (SD).
Age (one-way ANOVA, F = 2.410, p = 0.081) and educational level (F = 0.393, p = 0.0759) did not differ significantly among the groups. The AD group had significantly lower cognitive scores compared with the other groups (F = 35.810, p<0.0001)(†).
CDR = Clinical Dementia Rating, AD = Alzheimer's disease.
CASI = Cognitive Abilities Screening Instrument.
Cognitive impairment
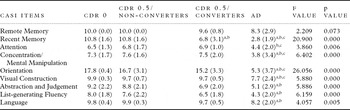
The CASI scores of the four groups are shown in Table 2. The AD group had significantly lower scores for all domains except “remote memory,” compared with the other groups. CDR 0.5/converters showed a significantly lower “recent memory” score compared with CDR 0.5/non-converters.
Cognitive performances of four groups at baseline

Showns are the mean (SD).
ANCOVA among four groups with the age and education level as covariance was performed.
The AD group had significantly lower scores for all domains except “remote memory,” compared with the other groups (ANCOVA, covariance of age and educational level, p = 0.008). CDR 0.5/converters showed a significantly lower “recent memory” score compared with CDR 0.5/non-converters (ANCOVA, covariance of age and educational level, p = 0.008). post hoc tests, significantly (p<0.05) different from Normal (a), CDR 0.5/non-converters (b), and CDR 0.5/converters (c).
CDR = Clinical Dementia Rating, AD = Alzheimer's disease.
Baseline glucose metabolism
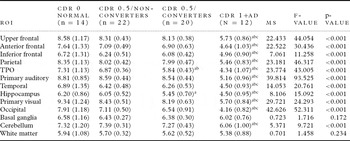
Absolute rCMRglc values were calculated using arterial blood sampling and autoradiography. Using the ROI method, we found that the AD group had severely decreased rCMRglc compared with other groups, except in the basal ganglia and white matter, as shown in Table 3. There was no significant difference between CDR 0.5/non-converters and the CDR 0 group. However, CDR 0.5/converters had decreased rCMRglc in the temporoparieto-occipital (TPO) and hippocampus compared with CDR 0 subjects, and decreased rCMRglc in the TPO compared with CDR 0.5/non-converters.
ROI values of four groups

Shown are the means (SD).
The AD group had severely decreased rCMRglc compared with other groups, except in the basal ganglia and white matter
(multiple ANOVAs and post hoc tests). There were no significant differences between CDR 0.5/non-converters and the CDR 0 group.
However, CDR 0.5/Converters had decreased rCMRglc in the TPO and hippocampus compared with CDR 0 subjects, and decreased rCMRglc in the TPO compared with CDR 0.5/non-converters.
post hoc tests, significantly (p<0.05) different from Normal (a), CDR 0.5/non-converters (b), and CDR 0.5/converters (c).
ROI = region of interests, TPO = Temporo-parieto-occipital, CDR = Clinical Dementia Rating, con. = converters, AD = Alzheimer's disease.
SPM
Comparisons of CDR 0.5 subjects with CDR 0 subjects and AD patients
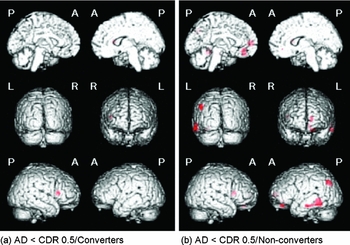
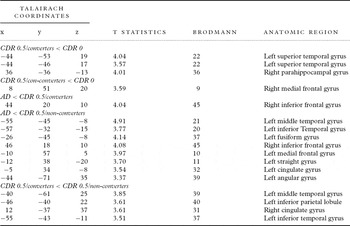
Comparisons of CDR 0.5/converters and CDR 0.5/non-converters with CDR 0 subjects are shown in Figure 1, and similar comparisons with AD patients are shown in Figure 2. A region of hypometabolism was considered significant at p<0.001 (uncorrected) for a cluster of ≥20 contiguous voxels superimposed on 3D-rendered MR images in Montreal Neurological Institute (MNI) space (Evans et al., Reference Evans1994). Brain areas reaching the significance threshold were identified by voxel coordinates and labeled according to Talairach and Trournoux after coordinate conversion from MNI to Talairach space using a non-linear transformation algorithm (http://imaging.mrc-cbu.cam.ac.uk/imaging/MniTalairach) (Talairach and Trournoux, Reference Talairach and Trournoux1998). Areas showing a significant difference (SPM2, p<0.001, uncorrected) are shown in Table 4. For multiple comparisons, the significance level was set at 0.001.
Results from voxel-based analysis with SPM2. (a) Voxels showing significant hypometabolism for CDR 0.5/converters compared to CDR 0 subjects (p<0.001, uncorrected). (b) Voxels showing significant hypometabolism for CDR 0.5/non-converters compared to CDR 0 subjects (p<0.001, uncorrected). The local maxima for the brain regions are shown in Table 3.

(a) Voxels showing significant hypometabolism for patients with AD compared to CDR 0.5/converters (p<0.001, uncorrected). (b) Voxels showing significant hypometabolism for patients with AD compared to CDR 0.5/non-converters (p<0.001, uncorrected).

Location and peak coordinates of significant voxels from voxel-based analysis using SMP2

Comparison between CDR 0.5/converters and CDR 0.5/non-converters
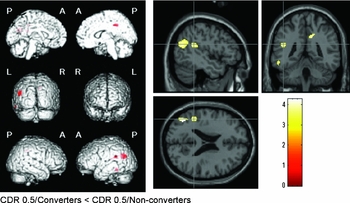
CDR 0.5/converters had significantly lower CMRglc values (SPM2, p<0.001, uncorrected) in the left middle temporal gyrus, left inferior parietal lobule, right cingulate gyrus, and left inferior temporal gyrus, compared with CDR 0.5/non-converters (Figure 3 and see Table 4).
(Left) Voxels showing significant hypometabolism for CDR 0.5/converters compared to CDR 0.5/non-converters (p<0.001, uncorrected). (Right) The same results were displayed on 2D planes of a normal MRI template provided by SPM2 to clarify their anatomic locations. The color bar represents t values derived from the voxel-based analysis.

Individual analysis using Silverman's classification
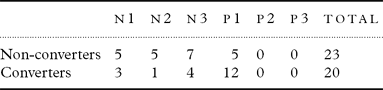
PET patterns using Silverman's classification for the two CDR 0.5 groups are shown in Table 5. The difference between the groups was significant by χ2 test (p<0.05), with CDR 0.5/converters showing a P1 pattern more frequently. No participants showed P2 or P3 patterns. Comparing all non-progressive patterns (N1–N3) with the progressive pattern (P1) for the two groups, a true positive rate (sensitivity) of 0.60, a true negative rate (specificity) of 0.74, a positive predictive value of 0.71, and a negative predictive value of 0.68 were found. Of the 14 normal subjects, 12 showed an N1 pattern and 2 had an N2 pattern. The 12 AD patients all showed P1 patterns.
PET patterns of Silverman's classification for two CDR 0.5 groups

N = non-progressive patterns, p = progressive patterns
Discussion
In this study, CDR 0.5/converters showed greater baseline hypometabolism compared with CDR 0.5/non-converters in brain areas specific for AD, suggesting that CDR 0.5 converters might have AD-like changes.
Methodological issues
There are some methodological limitations in the study. First, only 40% of the CDR 0 subjects and 70% of the CDR 0.5 subjects were scanned due to limited availability of the FDG-PET scanner (an average of four patients a month). The long distance between Tajiri and the PET center also prevented some older adults from participating in the study. Therefore, there may be some sampling bias and caution is required in interpretation of the results. Second, evaluation was only performed at two time points, rather than annually; however, the administrative situation brought about by the formation of a new city in 2006 through the merger of several towns, including Tajiri, prevented use of an annual study design. Third, although the CASI provided sufficient information for a detailed analysis, assessments such as the WMS-R for memory and the WAIS-R for general intelligence would have provided more cognitive information; however, the time required for assessing community residents prevented use of these tests.
Neuropsychological findings
Only the CASI “recent memory” score showed a significant difference between CDR 0.5/converters and CDR 0.5/non-converters (p = 0.008). This is consistent with previous studies (Arnaiz et al., Reference Arnaiz2001; Visser et al., Reference Visser, Verhey, Hofman, Scheltens and Jolles2002) and suggests that CDR 0.5/converters already have AD-like changes, since recent memory impairment is a well-known neuropsychological feature of AD.
Criteria for amnestic MCI
We evaluated the effect of amnestic MCI criteria retrospectively. Among the CDR 0.5 group, those who met the following criteria were also considered to have amnestic MCI (Meguro et al., Reference Meguro2004): memory complaints, a CASI “recent memory” score of –1.5 SD lower than the normal values for each age group, and normal MMSE scores for each educational level. Four CDR 0.5 subjects met these criteria and all converted to AD. Although the sample size was small, these results suggest that criteria for amnestic MCI are more “specific” for AD changes, whereas CDR 0.5 criteria are more “sensitive.”
Metabolic patterns of CDR 0.5 converters
The lack of metabolic differences after taking CASI scores into covariance might indicate that cognitive, rather than metabolic, differences predict conversion to AD. However, the aim of this study was to investigate whether metabolic changes in CDR 0.5 converters manifest as a decrease in CMRglc in a manner specific to early AD. Although the predictive power may be stronger for cognitive dysfunction, we believe that the findings support the hypothesis of the study.
Our findings suggest that CDR 0.5 participants who decline to AD develop hypometabolism in the posterior cingulate and other brain regions that might be specific to AD. These hypometabolic areas are similar to those observed in patients with probable AD (Hoffman et al., Reference Hoffman2000). Previous longitudinal studies on amnestic MCI have also indicated that these areas differ significantly between converters and non-converters (Arnaiz et al., Reference Arnaiz2001; Chetelat et al., Reference Chetelat, Desgranges, de la Sayette, Viader, Eustache and Baron2003; Drzezga et al., Reference Drzezga2003; Mosconi et al., Reference Mosconi2004). A follow-up SPECT study on amnestic MCI also showed asymmetric reduction of perfusion in the parahippocampus, lateral parietal lobe, and posterior cingulate cortices in converters (Ishiwata et al., Reference Ishiwata, Sakayori, Minoshima, Mizumura, Kitamura and Katayama2006). Parahippocampal gyri are very small areas and other studies may have missed these regions using the SPM method.
Since SPM reveals much more restricted abnormalities than suggested by individual classification, analysis of the individual patterns is required to provide support for SPM findings. In individual analysis of the CMRglc pattern, the AD pattern (P1) was most frequent among CDR 0.5/converters, whereas N1 and N3 patterns were frequent in CDR 0.5/non-converters (Table 5). These results are consistent with past studies and indicate that most CDR 0.5/converters already have AD pathology. The data also support the results of SPM analysis, indicating that both visual and automated methods are preferable to confirm the reliability of acquired data.
Conclusion
Neurological findings for MCI/CDR 0.5 decliners may show manifestation of hypometabolism in brain areas specific to AD. Since the prevalence of CDR 0.5 is much higher than that of MCI and the rate of decline to dementia from the two conditions is about the same, use of CDR 0.5 criteria may increase the detection rate of decliners in a community population.
Conflict of interest
None.
Description of authors' roles
K. Meguro and H. Ishii designed the study, supervised the data collection and wrote the paper. K. Meguro and S. Yamaguchi collected the data. H. Ishikawa and M. Tashiro were responsible for the statistical design of the study and for statistical analysis.
Acknowledgments
We are grateful to the town officials of Tajiri. This study was supported in part by a JST grant for research and education in molecular imaging.