Studies comparing North American (NA) and New Zealand (NZ) Holstein-Friesian (HF) cows have reported that NA cows produce similar yields of milk fat and protein when managed under intensive grazing systems, but are thinner throughout lactation as compared with NZ HF cows (Kolver et al. Reference Kolver, Roche, de Veth, Thorne and Napper2002; Roche et al. Reference Roche, Berry and Kolver2006; McCarthy et al. Reference McCarthy, Berry, Dillon, Rath and Horan2007; Macdonald et al. Reference Macdonald, Verkerk, Thorrold, Pryce, Penno, McNaughton, Burton, Lancaster, Williamson and Holmes2008). These comparisons reveal physiological differences in nutrient partitioning between divergent HF strains (Chagas et al. Reference Chagas, Lucy, Back, Blache, Lee, Gore, Sheahan and Roche2009; Lucy et al. Reference Lucy, Verkerk, Whyte, Macdonald, Burton, Cursons, Roche and Holmes2009; Roche et al. Reference Roche, Burke, Kay, Phyn, Meier and Lucy2009).
Blood plasma constituents that reflect metabolic status have enhanced understanding of the effects of nutrition on production and reproduction (Payne et al. Reference Payne, Rowlands, Manston, Dew and Parker1974; Rowlands Reference Rowlands1980; Adewuyi et al. Reference Adewuyi, Gruys and van Eerdenburg2005). A number of studies have reported effects of strain on single point measures of hormones and metabolite concentrations (Kay et al. Reference Kay, Phyn, Roche and Kolver2009; Lucy et al. Reference Lucy, Verkerk, Whyte, Macdonald, Burton, Cursons, Roche and Holmes2009; Roche et al. Reference Roche, Burke, Kay, Phyn, Meier and Lucy2009) yet many metabolites and hormones that are altered by diet or that contribute to nutrient partitioning undergo diurnal variation. These include insulin, glucose, growth hormone (GH), insulin-like growth factor-1 (IGF-1), β-hydroxybutyrate (BHBA) and non-esterified fatty acids (NEFA) (Lefcourt et al. Reference Lefcourt, Bitman, Wood and Akers1995; Lefcourt et al. Reference Lefcourt, Huntington, Akers, Wood and Bitman1999; Blum et al. Reference Blum, Bruckmaier, Vacher, Munger and Jans2000). Plasma metabolites and hormones are often used as key indicators of nutritional status with many investigators using single point samples in their studies.
Many metabolites and metabolic hormones are involved in the control of a number of reproductive processes including follicle and embryo development (Chagas et al. Reference Chagas, Bass, Blache, Burke, Kay, Lindsay, Lucy, Martin, Meier, Rhodes, Roche, Thatcher and Webb2007; Leroy et al Reference Leroy, Opsomer, Van Soom, Goovaerts and Bols2008a, Reference Leroy, Van Soom, Opsomer, Goovaerts and Bolsb). Hence, diurnal patterns of these metabolites and hormones may affect subsequent reproductive processes. The hypotheses tested was that the diurnal pattern of circulating metabolite and hormone concentrations are not affected by divergent genetic strain of cow or diet.
Materials and Methods
Experimental design and genotypes
All procedures were undertaken with the approval of the Ruakura Animal Ethics Committee (Hamilton, NZ) and were conducted at No 1 Dairy (DairyNZ Ltd, Hamilton, NZ; 37°46′S 175°18′E).
Animals
Two strains of HF cow of either NA (>87·5% NA, produced from imported embryos) or NZ (<12·5% NA genetics) ancestry were randomly allocated to one of two feeding systems offering either fresh pasture (FP) or a total mixed ration (TMR) in a 2×2 factorial arrangement (NA FP n=13, NZ FP n=12, NA TMR n=13, NZ TMR n=12). The experimental design and the origin of cow sires are described in detail elsewhere (Kolver et al. Reference Kolver, Roche, de Veth, Thorne and Napper2002).
Of the 50 cows in the trial, 28 (NZ FP n=6; NZ TMR n=9, NA FP n=7; NA TMR n=6) were included in this study. Of the 22 cows excluded from the study, 20 cows did not respond to the initial synchronization and 2 cows suffered from metabolic problems. Average parity was similar for NZ and NA cows (2·8±1·08, mean±se). The average parity of the FP cows was 3·5±1·08 and TMR-fed cows 2·5±1·08. Average milk production (4% FCM) during the experimental oestrous cycle (between 58 and 86 days in milk) were: NZ 29·9±0·58 kg/cow per day; NA 30·6±0·65 kg/cow per day; TMR-fed 33·2±0·58 kg/cow per day and cows fed FP 26·8±0·66 kg/cow per day, respectively. Average body weights of the three 7-d periods (corresponding to the experimental oestrous cycle) were: NZ 509±7·0 kg; NA 579±7·0 kg, FP 501±7·0 kg and TMR-fed cows 577±7·0 kg, respectively.
Feeding and management
Briefly, all cows were part of a multi-year farm systems study and were in their respective treatments throughout the year. Pasture-fed cows (NZ and NA groups) were offered generous access to fresh pasture (>45 kg DM/cow per day) with fresh pasture breaks offered at 7·00 and 15·00. NZ and NA groups grazed the same paddock but were separated by an electric fence. Pastures were grazed at a pre-grazing mass of 2300 kg DM/ha to post-grazing residuals of 1500 kg DM/ha (Roche et al. Reference Roche, Kolver, de Veth and Napper2001). Post-grazing residuals were used to determine pasture allocation.
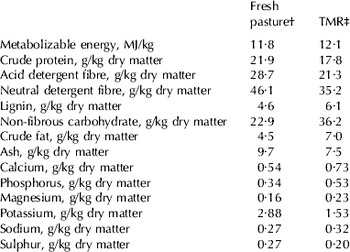
NZ and NA cows received the same TMR mix and were fed to achieve a 10% refusal rate, aimed to achieve ad-libitum intakes (Kolver et al. Reference Kolver, Roche, de Veth, Thorne and Napper2002). Fresh TMR was offered at 8·00–09·00 and again at 15·00–16·30. Cows were confined to loafing areas (in fine weather) or a free-draining loafing pad (11·5 m2 per cow) which was sheltered from wind. The TMR ration was formulated to maximize milk production (National Research Council, 2001; Roche et al. Reference Roche, Kolver, de Veth and Napper2001; Kolver et al. Reference Kolver, Roche, de Veth, Thorne and Napper2002). Feed composition is summarized in Table 1. Morning and afternoon milking occurred at 07·00–08·00 and 15·00–16·00.
Mean chemical composition of grazed fresh pasture and total mixed ration (TMR) diets offered during early lactation

† Pasture grazed consisted of a ryegrass/white clover pasture
‡ TMR fed during early lactation composed of 25% maize silage, 20% grass silage, 7% hay, 10% whole cotton seed, 38% pelleted concentrate (40·7% maize grain, 22·5% soybean meal, 8·6% barley grain, 6·4% molasses, 4·8% corn gluten meal, 5·7% fishmeal, 4·3% soy-oil, 2·1% calcium diphosphate, 1·5% lime-flour, 1·1% rumen-protected fat, 0·4% salt, 0·5% urea, 0·3% magnesium oxide, 1% sodium bicarbonate, 0·05% trace minerals and vitamin pre-mix (% concentrate DM) (Kolver et al. Reference Kolver, Roche, de Veth, Thorne and Napper2002)
Oestrous synchrony and blood sampling
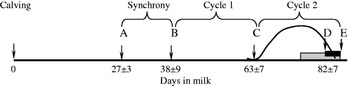
A timeline of experimental events, from calving through to the sampling period is outlined in Fig. 1. Briefly, animals were grouped by calving date (first cow calved 29 June and last cow calved 11 September) to ensure management was consistent relative to the day of calving. As part of a larger study examining the endocrine characteristics during a normal oestrous cycle, all cows were synchronized at 27±6·5 days in milk (DIM) (mean±sd), using a 8-d CIDR programme (CIDR-B™ Pfizer Animal Health, Auckland, New Zealand) and an i.m. injection of 10 μg of a GnRH analogue (Buserelin; Receptal, Intervet Limited, Auckland, New Zealand) on the day of device insertion. All cows received an i.m. injection of PGF (25 mg dinoprost; Lutalyse, Pfizer Animal Health, Auckland, New Zealand) on the day before CIDR removal and 1 mg oestradiol benzoate (CIDIROL, Bomac Laboratories Limited, Auckland, New Zealand) 24 h after CIDR withdrawal (synchronized oestrus occurred at 38±9·2 DIM). Subsequently, the experimental oestrous cycle was the result of a spontaneous oestrus (63±7·1 DIM; mean±se). Blood sampling was initiated during the late luteal/preovulatory phase of the spontaneous oestrous cycle (82±6·6 DIM). On the first day of blood sampling, a catheter (Cavafix, Braun Melsungen AG, Melsungen, Germany) was inserted into a jugular vein between 7·00 and 9·00, with the first blood sample collected at 10·00. Blood sampling continued every 4 h (14·00, 18·00, 22·00, 2·00, 6·00, and 10·00) for 3 d. Early-calving cows were sampled from 17 September, with the last cow sampled 24 November. Distances from the grazing areas or the loafing pads to the sampling area were <1·0 km and <200 m, respectively. All blood samples were collected into evacuated tubes (Vaccutainer, Becton & Dickinson, New York, USA) containing sodium heparin, immediately placed in ice water and centrifuged at 1500 g for 15 min, within <45 min of collection. Aspirated plasma fractions were stored at −20°C until analysis.
Experimental timeline from calving through to the experimental period representing approximate days in milk for each time point. Starts of the synchrony (A), ovulation resulting from synchrony (B) and the subsequent spontaneous ovulations (C and E). The blocked area (grey) indicates the period of daily measurements, (D) the start of 4-h sampling depicted by the black box. The solid line represents plasma progesterone profile during the experimental oestrous cycle.

Blood analyses
Blood samples were analysed for concentrations of glucose (hexokinase method; WAKO, Osaka, Japan), NEFA (colorimetric method, WAKO, Osaka, Japan), and BHBA (BHBA dehydrogenase assay; WAKO, Osaka, Japan) using a Hitachi 717 auto-analyser (Roche, Basel, Switzerland). The intra- and inter-assay CV were <5% for all assays (Gribbles Veterinary Laboratories, Hamilton, New Zealand). Plasma insulin, IGF-1 and GH were determined using double-antibody radioimmunoassay, as previously described (Meier et al. Reference Meier, Gore, Barnett, Cursons, Phipps, Watkins and Verkerk2008). Intra- and inter-assay CV for insulin were 13 and 10%, respectively; sensitivity of the insulin assay was 2·0 μIU/ml. Intra-and inter-assay CV for IGF-1 were 15 and <11%, respectively; sensitivity of the IGF-1 assay was 1·7 ng/ml. Intra- and inter-assay CV for GH were 11 and <14%, respectively; sensitivity of the GH assay was 0·30 ng/ml.
Statistical analyses
Statistical analyses were undertaken using GenStat 11 (Payne et al. Reference Payne, Harding, Murray, Soutar, Baird, Glaser, Channing, Welham, Gilmour, Thompson and Webster2008). Metabolite and hormone data were analysed as repeated measurements through time, modelling the within-cow covariance structure as an autoregressive model and allowing for heterogeneity across time. The fixed terms in the model included Time of day (Time), Diet and Strain, the interactions between these variables, and a constant. Significance for the fixed effects, and interactions were tested using Wald's tests. Insulin data were analysed following log transformation, with back transformed means presented.
Results and Discussion
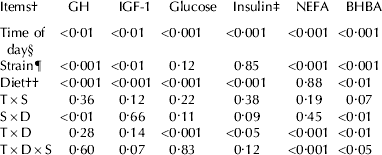
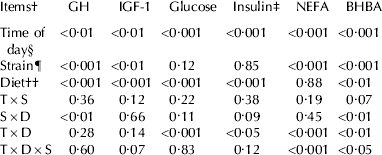
Cow genetic strain and diet altered GH and IGF-1 with time of day having little effect on these hormones. Both plasma glucose and insulin concentrations were affected by diet and were observed with specific diurnal patterns (diet×time interactions). Interestingly, significant three-way interactions (time of day×diet×strain) were observed for both NEFA and BHBA. The probability values for treatment comparisons are reported in Table 2 and diurnal profiles for circulating concentrations of GH and IGF-1, glucose and insulin, and NEFA and BHBA are presented in Figs 2, 3 and 4, respectively.
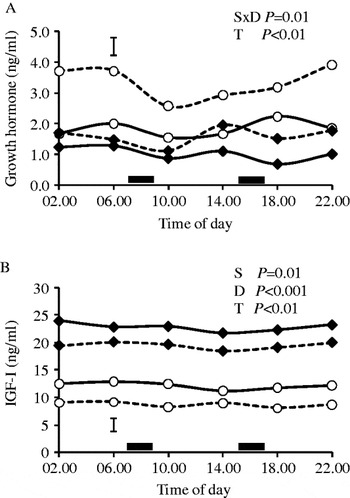
Diurnal plasma concentrations of (A) growth hormone and (B) IGF-1 in New Zealand cows fed fresh pasture (NZ-FP, –○–), North American cows fed fresh pasture (NA-FP; - -○- -), NZ cows fed TMR (NZ-TMR; –◆–) and NA cows fed TMR (NA-TMR; - -◆- -). Fresh feed and TMR were provided between 7·00 and 9·00 and between 15·00 and 17·00 (represented by the black boxes). Data are presented as the raw mean and the maximum sed. Significant effects: Strain (S), Diet (D), Time of day effect (T), and Strain by diet interaction (S×D).

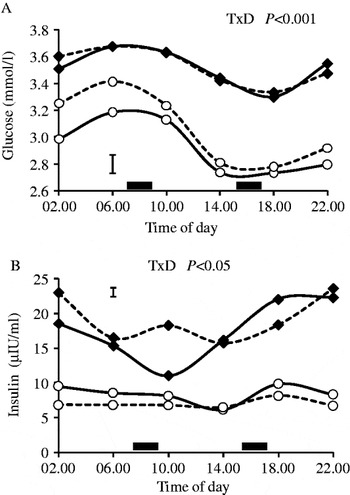
Diurnal plasma concentrations of (A) glucose and (B) insulin in New Zealand cows fed fresh pasture (NZ-FP, –○–), North American cows fed fresh pasture (NA-FP; - -○- -), NZ cows fed TMR (NZ-TMR; –◆–) and NA cows fed TMR (NA-TMR; - -◆- -). Fresh feed and TMR were provided between 7·00 and 9·00 and between 15·00 and 17·00 (represented by the black boxes). Data are presented as the raw means for glucose, and back transformed means for insulin, and the maximum sed. Significant effect: Time of day by diet interaction (T×D).

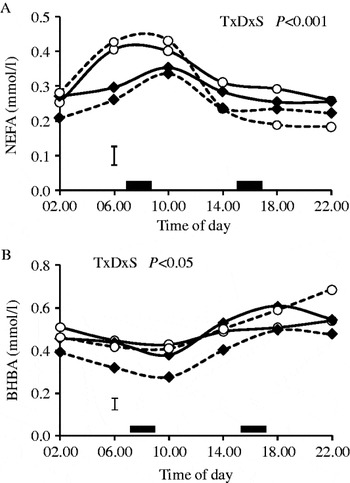
Diurnal plasma concentrations of (A) NEFA and (B) BHBA in New Zealand cows fed fresh pasture (NZ-FP, –○–), North American cows fed fresh pasture (NA-FP; - -○- -), NZ cows fed TMR (NZ-TMR; –◆–) and NA cows fed TMR (NA-TMR; - -◆- -). Fresh feed and TMR were provided between 07·00 and 09·00 and between 15·00 and 17·00 (represented by the black boxes). Data are presented as the raw mean and the maximum sed. Significant effect: Time of day by diet by strain (T×D×S).

Probability values for effects of time within day, genetic strain, diet, and any interaction on circulating concentrations of hormones and metabolites in dairy cows in early lactation
† GH, growth hormone; IGF-1, insulin-like growth factor-I; NEFA, non-esterified fatty acids; BHBA, β-hydroxybutyrate
‡ Data analysis carried out following log transformation
§ Time of day (T)=2·00, 6·00, 10·00, 14·00, 18·00 and 22·00 h
¶ Strain (S)=New Zealand or North American
† †Diet (D)=Fresh pasture or total mixed ration
North American cows had greater (P <0·001) circulating GH concentrations throughout the day; this difference was pronounced in cows fed FP (interaction: P<0·01). Consistent with this effect of pasture and NA genetics on plasma GH, plasma IGF-1 concentrations were lower in NA cows (P<0·01) and those offered FP (P<0·001). The effect of diet on plasma IGF-1 concentrations are consistent with the findings of others (Kay et al. Reference Kay, Phyn, Roche and Kolver2009; Lucy et al. Reference Lucy, Verkerk, Whyte, Macdonald, Burton, Cursons, Roche and Holmes2009; Roche et al. Reference Roche, Burke, Kay, Phyn, Meier and Lucy2009). These data support a genetic strain by diet interaction during early lactation in the re-coupling of the somatotropic axis. An uncoupled somatotropic axis refers to the phenomenon wherein higher plasma GH levels are associated with lower concentrations of plasma IGF-1, despite GH's positive role in the hepatic production of IGF-1 (Gluckman et al. Reference Gluckman, Breier and Davis1987). Roche et al. (Reference Roche, Berry and Kolver2006) hypothesized a possible interaction between strain and diet in the re-coupling of the somatotropic axis based on body condition score profiles. Lucy et al. (Reference Lucy, Verkerk, Whyte, Macdonald, Burton, Cursons, Roche and Holmes2009) confirmed that NA HF exhibited a reduced transcript abundance of GH receptor in liver compared with NZ HF and, based on weekly blood sample analyses, suggested a likely genetic strain by diet interaction in the re-coupling of the somatotropic axis. The differences in circulating GH and IGF-1 concentrations, in the current study may hence be due to a difference in the timing of re-coupling of the somatotropic axis in NA HF cows eating fresh pasture.
A time×diet interaction was recorded for circulating glucose (Fig. 3a) and insulin (Fig. 3b). Cows fed FP have lower plasma glucose and insulin concentrations compared with their TMR-fed counterparts. There was no effect of strain nor a strain×diet interaction on either plasma glucose or insulin concentrations. The data reported indicate distinct patterns in plasma glucose concentrations and variations from 2·8 to 3·4 mmol/l for NA FP cows (a change of 15–20%; Fig. 3a). The increased plasma glucose in TMR-fed cows is expected, as a greater proportion of non-fibrous carbohydrate (NFC) would lead to greater ruminal propionate production (Sutton et al. Reference Sutton, Dhanoa, Morant, France, Napper and Schuller2003) and hence greater glucose production. Supplementation with NFC during early lactation increased both plasma glucose and insulin concentrations (Nikkhah et al. Reference Nikkhah, Furedi, Kennedy, Crow and Plaizier2008). All four groups had similar diurnal patterns in plasma glucose concentrations, although the amplitude of the profile was exacerbated by FP; plasma glucose concentrations peaked between 2·00 and 10·00, probably coinciding with the onset of the first grazing bout that occurs just prior to dawn (Hafez et al. Reference Hafez, Schein and Ewbank1969; dawn occurred 6·20 in September and 5·55 in November). However, the larger diurnal patterns in FP cows are supported by previous observations in grazing cows (Kolver & Macmillan, Reference Kolver and Macmillan1993), whereas the reduced variability observed for TMR-fed cows are consistent with others who observed no diurnal pattern in plasma glucose when cows were fed TMR diets (Nielsen et al. Reference Nielsen, Ingvartsen and Larsen2003; Ametaj et al. Reference Ametaj, Emmanuel, Zebeli and Dunn2009).
Distinct diurnal patterns in plasma NEFA and BHBA were observed in the current study (Fig. 4) that were influenced by both strain and diet (3-way interaction P<0·05). The 3-way interaction observed for plasma NEFA concentrations reflected differences between the pasture-fed and TMR-fed cows during morning (6·00 and 10·00). In addition, NEFA concentrations diverged in the NZ and NA pasture-fed cows during the afternoon, with the NZ pasture-fed cows having elevated plasma NEFA from 14·00 to 22·00 compared with NA pasture-fed cows (Fig. 4b). The 3-way interaction observed for plasma BHBA concentrations (P <0·05) was associated with a reduction in BHBA concentrations between 6·00 and 14·00 in NA TMR-fed group compared with the remaining three groups; this was followed by a separation of the two pasture groups in the evening (from 18·00 and 22·00; Fig. 4b). The physiological significance of these 3-way interactions for both plasma NEFA and BHBA are unclear.
Plasma NEFA concentrations peaked between 6·00 and 10·00, and were most prominent in the cows fed FP; in comparison, plasma BHBA concentrations reached the nadir between 2·00 and 10·00 and were elevated between 14·00 and 22·00, suggesting an inverse relationship between circulating NEFA and BHBA. This inverse relationship is consistent with that previously reported for cows fed pasture (Kolver & Macmillan, Reference Kolver and Macmillan1993) and TMR (Ametaj et al. Reference Ametaj, Emmanuel, Zebeli and Dunn2009). The mechanisms controlling these short-term changes in plasma NEFA and BHBA are not well understood.
Conclusion
This study confirms that both HF strain and diet alter the diurnal patterns of metabolites and hormones such as insulin, glucose, NEFA and BHBA and need to be considered in future investigations of these metabolites and hormones. The physiological significance of the observed diurnal patterns and their impact on physiological processes require further investigation. The data presented in the current study will allow for the customization of sampling time suited to testing specific hypotheses where sampling time will affect the outcomes.
Farm and technical staff at DairyNZ Limited were invaluable in completing this study. Staff from the Biochemistry Laboratory (DairyNZ Ltd, Hamilton, NZ), and Gribbles Laboratories (Hamilton, NZ) carried out the plasma hormone and metabolite analyses. The contribution of B. Dow to the statistical analyses is acknowledged. This work was funded by New Zealand dairy farmers through DairyNZ (DairyNZ Inc., Hamilton, NZ) and the Foundation for Science, Research, and Technology (Wellington, NZ).