I. INTRODUCTION
In comparison with conventional polycrystalline alloys, bulk metallic glasses (BMGs) that were developed over the past decades manifest many attractive properties, such as high fracture strength, high elastic limit (≈2%), excellent corrosion resistance, and near-net-shape processability. However, their applications as structural materials are restricted because of their catastrophic failure under tensile loading and lower fracture toughness (small plastic zone size).Reference Schuh, Hufnagel and Ramamurty1–Reference Xu, Ramamurty and Ma3 Recently, it is revealed that fracture toughness of BMGs has a significant compositional dependency, depending on the host constituent elements and even on the micro-alloying.Reference Lewandowski, Wang and Greer4–Reference He, Cheng, Ma and Xu9
Among the BMG family, Mg-based BMGs exhibit significant brittleness with respect to the Zr-, Ti-, and Cu-based glassy alloys, even though their glass-forming ability (GFA) is no longer a bottle-neck to fabricate the centimeter-scale bulk materials.Reference Ma, Shi, Xu, Li and Ma10, Reference Zheng, Xu and Ma11 However, very few studies considering the compositional dependency on fracture toughness of Mg-based BMGs were carried out so far. As shown by limited data, notch toughness of Mg65Cu25Tb10 BMG is quite lower (≈2 MPa√m),Reference Lewandowski, Wang and Greer4, Reference Xi, Zhao, Pan, Wang, Wu and Lewandowski12 comparable to the silicate glasses. Thus, it remains an open question whether such low toughness can be improved through the alloy screening and composition tuning.
Recently, it is suggested that the toughness/plasticity of metallic glasses (MGs) has a “one-to-one” correlation with their elastic properties,Reference Lewandowski, Wang and Greer4, Reference Demetriou, Kaltenboeck, Suh, Garrett, Floyd, Crewdson, Hofmann, Kozachkov, Wiest, Schramm and Johnson7, Reference Schroers and Johnson13, Reference Cheng, Cao and Ma14 such as the Poisson ratio ν, equivalently as a ratio of the shear modulus μ to bulk modulus B owing to a relation of μ/B = (3/2)(1 − 2ν)/(1+ν), and even the single shear modulus. It is understood from several different views, including (i) the fracture processes ahead of a crack tip are mainly controlled by two competing factors: plastic flow and dilatation caused by the opening of the crack,Reference Lewandowski, Wang and Greer4 (ii) the shear-flow energy barrier based on “cooperative shear model (CSM)”,Reference Demetriou, Kaltenboeck, Suh, Garrett, Floyd, Crewdson, Hofmann, Kozachkov, Wiest, Schramm and Johnson7, Reference Johnson and Samwer15 and (iii) the atomic-scale structural perspective.Reference Cheng, Cao and Ma14, Reference Zhang, Cheng, Cao, Xu and Ma16 Then, the ν (or μ/B) and μ are expected to be used as the indicators for designing the tough/ductile BMGs. Furthermore, it is suggested that there is a critical value of the ν, in a range of ≈0.31–0.32, corresponding to the brittle-to-tough transition (BTT)Reference Lewandowski, Wang and Greer4 and that different BMG systems may have their respective critical ν value for this transition, such as 0.32 for the Fe-basedReference Gu, Mcdermott, Poon and Shiflet17 and 0.35–0.375 for the Ti-based BMGs.Reference Gu, Poon, Shiflet and Lewandowski18 Meanwhile, from the alloy design perspective, Zhang and GreerReference Zhang and Greer19 indicate that the elastic properties of an MG can be predicted from the properties of the constituent elements. It is promising to estimate the glass properties and to provide guidelines for the selection of compositions for toughness improvement. In this regard, it is, therefore, of interest to examine the validity of this approach in the case of Mg-based BMGs.
The purpose of this study is 4-fold. First, quaternary Mg−Cu−Ag−Y system is selected owing to its large GFA, as indicated in previous work.Reference Ma, Shi, Xu, Li and Ma10, Reference Ma, Shi, Xu, Li and Ma20 Starting from Mg54Cu28Ag7Y11 alloy with a critical diameter (D c) of 16 mm for BMG formation, the compositional dependence of elastic moduli in a series of Mg54(Cu1−xAgx)35Y11 (0 < x ≤ 0.5) BMGs is investigated. To ensure the modest GFA (i.e., the D c is maintained at least at 4 mm), the increase of Ag fraction in Cu1−xAgx is expected to increase the ν of the BMG owing to the highest ν (0.37) of Ag element among the four constituents. In the meantime, by comparison with the measured data, validity of predictions of elastic moduli of BMGs based on composite mechanics is examined and weighted by volume fraction of the moduli of the elements in crystalline form. Second, ten representative Mg–TM–RE (TM = Cu, Ni; RE = rare earth) BMGs are optimized for toughness assessed by notch toughness (K Q), measured with three-point single-edge notched bend (SENB) tests. Correlations of the toughness with ν or μ are critically assessed. It is examined if a critical ν value for the BTT is adequate in the case of Mg-based BMGs. Third, combined with previous data on the GFA,Reference Ma, Shi, Xu, Li and Ma10, Reference Zheng, Xu and Ma11, Reference Ma, Shi, Xu, Li and Ma20–Reference Shi and Xu23 the Mg BMG is optimized for a good combination of the GFA and toughness. Finally, the relationship between the glass transition temperature T g and the elastic moduli for Mg BMGs are discussed.
II. EXPERIMENTAL
Elemental pieces with purity better than 99.9 wt% were used as starting materials. Cu (or Cu–Ag, Ni)-RE [RE (rare earth) = Yttrium (Y), Gadolinium (Gd), Terbium (Tb), Neodymium (Nd)] ingots as an intermediate alloy were prepared by arc melting under a Ti-gettered argon atmosphere in a water-cooled copper crucible. This alloy was then melted with Mg pieces by induction melting under purified inert atmosphere in graphite crucible to obtain a master alloy with the nominal composition (in at%). The alloy ingots were melted at least three times to ensure compositional homogeneity. The master alloy was remelted in a tilting crucible with coil and subsequently cast into the copper mold that has internal rod-shaped cavity of 4 mm in diameter and 105 mm in length.
The amorphous nature of the as-cast rods was verified by x-ray diffraction (XRD) using a D/max 2400 diffractometer (Rigaku, Tokyo, Japan) with monochromated Cu K α radiation. The glass transition and crystallization behavior of the as-cast BMGs were investigated in a differential scanning calorimeter [(DSC) diamond; Perkin-Elmer, Shelton, CT] with graphite container under flowing purified argon at a heating rate of 20 K·min−1. A second run under identical conditions was used to determine the baseline after each run. All the measurements of the T g were reproducible within the error of ±1 K.
Elastic properties of the BMGs were measured by a resonant ultrasound spectroscopy (Quasar; Albuquerque, NM). For each alloy, at least three machined cylindrical samples taken from as-cast BMG rods of 4 mm in diameter were measured. The sample with the height to diameter ratio from 0.75 to 1 was placed in the middle of two piezoelectric transducers. Two independent elastic constants C11 and C44 were obtained for calculating the elastic moduli, including Young’s modulus (E), μ, B, and ν. The uncertainties in the calculated values of μ, B, ν, and E are less than ±0.6%. Sample mass density was measured by the Archimedean method, with the tests more than three times for each composition.
Samples for notch toughness testing were taken from the as-cast BMG rods of 4 mm in diameter. The cylindrical specimens were notched using a slow-speed diamond wire saw with a root radius of 150 μm to a depth of approximately half diameter of the rod. The three-point SENB tests, with span distance of 16 mm, were performed on a 5848 micromechanical tester (Instron, Norwood, MA) at a constant displacement rate of 0.1 mm·min−1. At least four samples were measured to ensure that the results were reproducible. The stress intensity factor for the cylindrical configuration was evaluated using the analysis by Murakami.Reference Murakami24 The toughness values obtained on the specimens were reported as K Q instead of valid K IC (plane-strain fracture toughness) due to the lack of a fatigue precrack and nonstandard specimen geometries. Nonetheless, K Q data are meaningful to distinguish the variation in toughness of materials under identical testing conditions.Reference Lewandowski, Wang and Greer4–Reference Demetriou, Kaltenboeck, Suh, Garrett, Floyd, Crewdson, Hofmann, Kozachkov, Wiest, Schramm and Johnson7 Fracture surfaces of the failure samples after three-point bending (3PB) tests were examined in a Quanta 600 scanning electron microscope [(SEM); FEI, Eindhoven, The Netherlands].
III. RESULTS
A. Compositional dependence of elastic moduli for Mg–Cu–Ag–Y BMGs and comparison with the predicted values
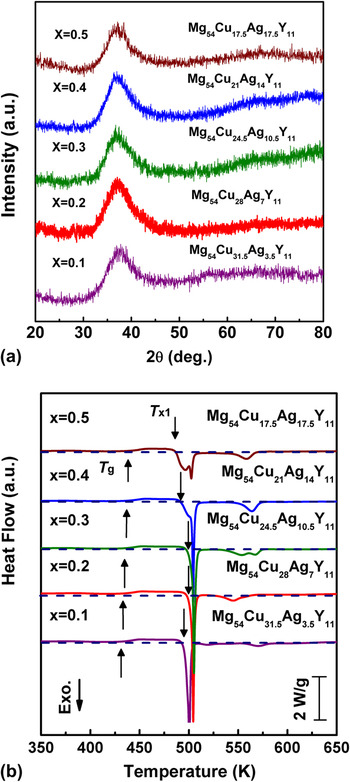
Starting from the Mg54Cu28Ag7Y11 alloy with a ratio of Cu0.8Ag0.2, the Mg54(Cu1−xAgx)35Y11 (x = 0.1, 0.2, 0.3, 0.4, 0.5) series BMG rods of 4-mm diameter were fabricated by using copper mold casting. Figures 1(a) and 1(b) display the XRD patterns taken from the cross sectional surface and DSC curves for these as-cast rods, respectively. In all cases, broad diffusive maxima in the 2θ range of 30–45° indicate the typical amorphous feature without detectable crystalline phases within XRD resolution. The DSC curves show a clear endothermic event associated with the glass transition and more than two exothermic peaks caused by crystallization of glassy phase. It is observed that with increase in the Ag fraction, the T g slightly increases from 431 K at x = 0.1 to 438 K at x = 0.5. In addition, as seen in Fig. 1 (b), when the x increases up to 0.4, the crystallization processes of glassy phase evolve through the multiple steps.
(a) X-ray diffraction patterns taken from the cross-sectional surface and (b) differential scanning calorimeter scans measured at a heating rate of 20 K·min−1 of as-cast rods with 4-mm diameter for the Mg54(Cu1−xAgx)35Y11 (0 < x ≤ 0.5) alloys.

By virtue of the approach that the averages of the moduli can be weighted by volume fraction of constituent elements,Reference Zhang and Greer19 the elastic moduli, X, of the Mg-based BMGs can be estimated. The upper bound of elastic modulus given under an iso-strain condition based on composite mechanics, X upper, is then calculated by using
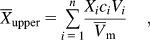
where Xi, ci, Vi, and  are the moduli (E, μ, or B), atomic fraction, volume per atom for the ith component element, and the average atomic volume of the glassy alloy, respectively. The lower bound of elastic modulus given under iso-stress condition, X lower, is calculated by using
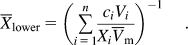
With the average of the X upper and X lower, the Poisson’s ratio ν or μ/B of the Mg-based BMGs can be obtained.
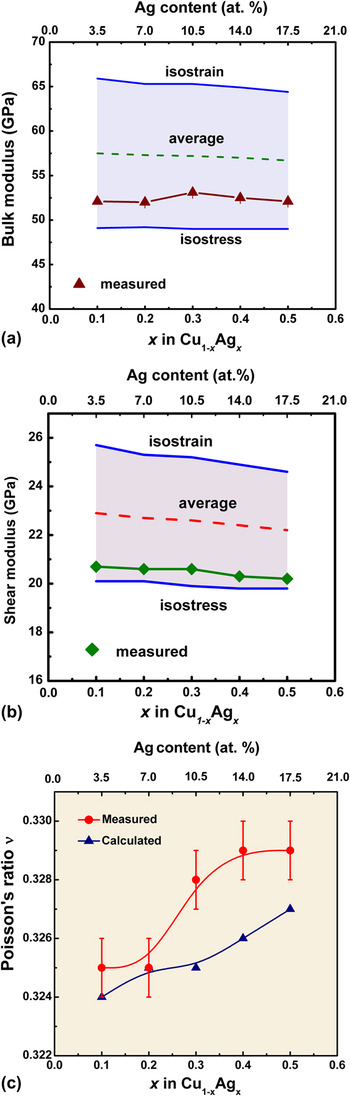
Figures 2(a) and 2(b) show the variation of the B and μ against the ratio of Cu1−xAgx in the Mg54(Cu1−xAgx)35Y11 BMGs. For the purpose of comparison, the calculated values using Eqs. (1) and (2) and the average values from the X upper and X lower are plotted together. As shown in Fig. 2(a), the measured B does not yield a significant change with the changes in composition, remaining at ≈52 GPa, even though the maximum Ag concentration in the alloys reached up to 14 at%. It is noticed that the calculated average B values is about 10% greater than the measured values. The predicted B values with the iso-stress assumption are more accurate than those with the iso-strain assumption. Similar tendency is also observed in the case for the μ, as shown in Fig. 2(b). With increase in the Ag concentration in the alloys, the measured μ value is reduced by ≈2.4%, from 20.7 GPa at x = 0.1 to 20.2 GPa at x = 0.5, as seen in Fig. 2(b). The calculated average μ values are about 9% greater than the measured values. Similarly, Fig. 2(c) illustrates the variation of the ν with the Ag fraction in the Mg54(Cu1−xAgx)35Y11 BMGs, including both the calculated and the measured cases. For the measured data, the ν increases by ≈1.2%, from 0.325 at x = 0.1 to 0.329 at x = 0.5, as the Ag fraction increases. In addition, the calculated ν values are underestimated to be less than 0.6% with respect to the measured data.
(a) Bulk modulus B, (b) shear modulus μ, and (c) Poisson’s ratio ν as a function of Ag fraction in Mg54(Cu1−xAgx)35Y11 (0 < x ≤ 0.5) BMGs. In (a) and (b), three calculated values are shown for a comparison: upper bound under iso-strain condition, lower bound under iso-stress condition, and the average of the two bounds.

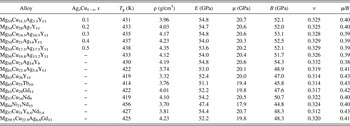
Besides the aforementioned Mg54(Cu1−xAgx)35Y11 (0 < x ≤ 0.5) series BMGs, we also investigated the compositional dependence of elastic moduli at the pseudoternary Mg−(Cu0.6Ag0.4)−Y compositional plane. Among the tested alloys, a BMG with the largest Poisson ratio (ν = 0.332) is located at Mg56Cu21Ag14Y9. To our knowledge, this alloy exhibits the largest ν among the currently reported Mg-based BMGs. It is noteworthy that this value more or less exceeds the critical ν value of 0.31–0.32 for the BTT of the BMGs, as previously suggested by Lewandowski et al.Reference Lewandowski, Wang and Greer4 Moreover, several additional Mg BMGs with optimal GFA in their respective alloy systems are also selected, as the representative, to measure the elastic moduli. Together with quaternary Mg–Cu–Ag–Y BMGs, the measured data of the elastic moduli, T g, and mass density (ρ), for overall 15 alloys are listed in Table I for a comparison.
Glass transition temperature T g, mass density ρ, Young’s modulus E, shear modulus μ, bulk modulus B, and Poisson’s ratio v for the investigated Mg-based BMGs.

B. Notch toughness and fracture surface morphology of Mg-based BMGs
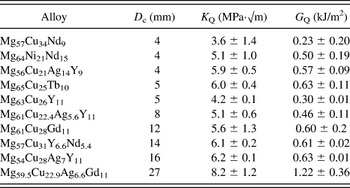
Notch toughness (K Q) measured with 3PB tests and fracture energy (G Q) calculated using the relationship  for ten representative Mg-based BMGs, together with their respective D c, are summarized in Table II. As seen in Table II, the K Q of the investigated BMGs manifests the compositional dependence and varies from 3.6 MPa√m of Mg57Cu34Nd9 to 8.2 MPa√m of Mg59.5Cu22.9Ag6.6Gd11, whereas the corresponding G Q varies from 0.23 kJ·m−2 of Mg57Cu34Nd9 to 1.22 kJ·m−2 of Mg59.5Cu22.9Ag6.6Gd11. The plastic zone size in plane-strain state is roughly estimated in terms of r p = 1/6π (K Q/σ y)Reference Ashby and Greer2, where σ y is taken to be 800 MPa.Reference Shi and Xu23 Then, the r p of Mg57Cu34Nd9 and Mg59.5Cu22.9Ag6.6Gd11 is determined to be about 1 and 6 μm, respectively. In addition, for our sample geometry, the K Q of Mg65Cu25Tb10 BMG is 3-fold larger than that previously reported (≈2 MPa√m).Reference Lewandowski, Wang and Greer4, Reference Xi, Zhao, Pan, Wang, Wu and Lewandowski12
Critical diameter D c of glass formation, notch toughness K Q, and fracture energy G Q for investigated Mg-based BMGs.

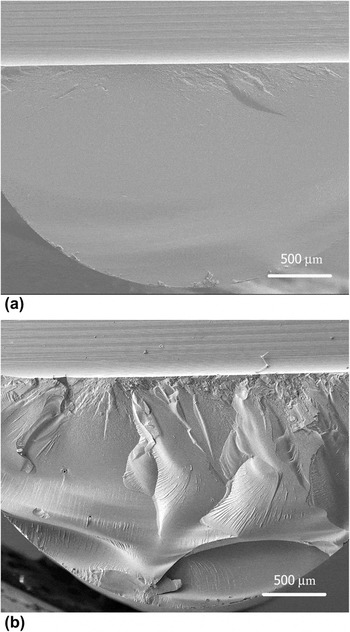
After selecting the brittle Mg63Cu26Y11 (K Q = 4.2 MPa√m) and the less brittle Mg59.5Cu22.9Ag6.6Gd11 (K Q = 8.2 MPa√m) BMGs as the representatives, fracture surface morphology of the samples that fail after the 3PB tests is observed. In Figs. 3(a) and 3(b), SEM images show the fracture surface of the ternary Mg63Cu26Y11 and quaternary Mg59.5Cu22.9Ag6.6Gd11 BMGs, respectively. As seen in Fig. 3(a), the fracture surface of Mg63Cu26Y11 BMG is quite smooth, with “mirror/cleavage-like” feature. It implies that the niche is resistant to crack propagation as long as the cracks are initiated under overloading. Such brittle fracture in the way of a cleavage-like process occurs when the open stress at the stress concentrator (notch tip here) reaches the yield/fracture stress of the materials before the shear-induced plastic flow can blunt the crack and relieve the stress. In contrast, the fracture surface of less-brittle Mg59.5Cu22.9–Ag6.6Gd11 BMG shows apparently jagged rough zone (mountainous topography) in the length scale of several hundreds of micrometers, as seen in Fig. 3(b). Such a “rough zone” would be associated with the deflection of crack path during crack propagation, accompanied by more energy dissipation for the fracture. In other words, the length scale of the roughness of the fractured surface correlates well with the intrinsic brittleness of Mg-based BMGs. As a matter of fact, similar motif that the rough fracture surface corresponds to tough BMGs is also observed in Zr-based BMGs as shown in recent work.Reference Suh, Conner, Kim, Demetriou and Johnson25
SEM images of the fracture surface of notched samples after three-point bending tests. (a) Ternary Mg63Cu26Y11 BMG and (b) quaternary Mg59.5Cu22.9Ag6.6Gd11 BMG. The crack propagation direction is from top to bottom.

C. Toughness versus elastic properties for Mg-based BMGs
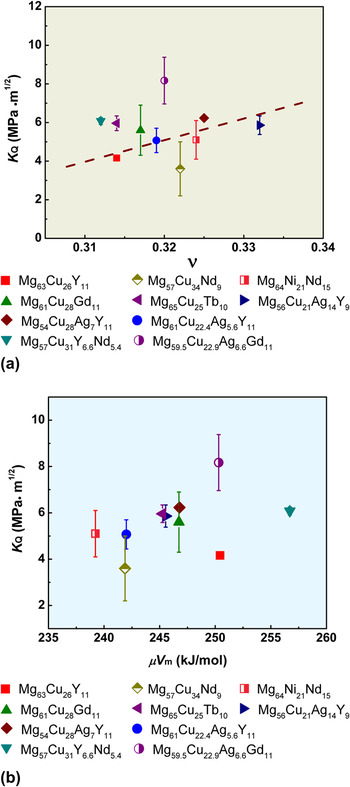
In Figs. 4(a) and 4(b), the notch toughness K Q is plotted against the Poisson’s ratio ν and shear modulus multiplied by molar volume, μV m, for the ten considered Mg BMGs, respectively. The K Q of Mg56Cu21Ag14Y9 with the largest ν of 0.332 (μ/B = 0.38) is 5.9 MPa√m, which is actually comparable to the Mg57Cu31Y6.6Nd5.4 (K Q = 6.1 MPa√m) with the smallest ν value (ν = 0.312 or μ/B = 0.43). It is noticed that the Mg59.5Cu22.9Ag6.6Gd11 manifests the highest toughness (K Q = 8.2 MPa√m), although its ν value (ν = 0.320 or μ/B = 0.41) is only the intermediate within a variation range of the ν overall for Mg glasses, as seen in Fig. 4(a). Evidently, no clear tendency that the toughness can be improved as the ν increases is presented. Nevertheless, on taking account of only four MgCu(Ag)Y glasses, there exists a tendency that the toughness increases as the ν increases, dashed line in Fig. 4(a). Similar to the case of ν, the correlation between K Q and μV m is quite scattered as well, as shown in Fig. 4(b). As unexpected, it is not shown that a reduction in the μV m leads to any marked increase in K Q, which happens already in the Fe7- and Zr9-based BMGs.
Notch toughness K Q versus (a) Poisson’s ratio ν and (b) shear modulus multiplied by molar volume μV m for ten typical Mg-based BMGs with different chemistry. In (a), a dashed line drawn by eye-view indicates a general trend.

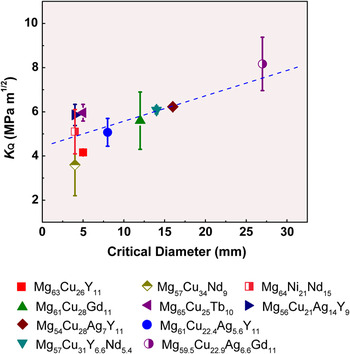
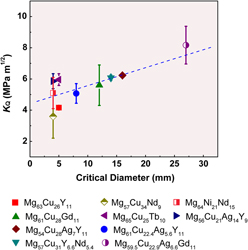
Figure 5 displays a plot of the K Q against the critical diameter of glassy-rod formation for eight Mg-based BMGs with different chemistry. As seen in Fig. 5 and Table II, the K Q for the Mg57Cu34Nd9, Mg63Cu26Y11, Mg64Ni21Nd15, Mg65Cu25Tb10, and Mg56Cu21Ag14Y9 ranges between 3.6 and 6.0 MPa√m, even though the GFA of these five BMGs is nearly comparable, as indicated by their D c around 4–5 mm. It is noteworthy that among these Mg glasses, the Mg59.5Cu22.9Ag6.6Gd11 stands out, as it presents a good combination of relatively higher toughness (K Q = 8.2 MPa√m) and strong GFA (D c = 27 mmReference Zheng, Xu and Ma11). Therefore, contrary to conventional consideration that the better the GFA, the more it is likely to be brittle, it is at least not the case for the Mg BMGs when the chemistry changes, in contrast to the Fe-based glasses.Reference Demetriou, Kaltenboeck, Suh, Garrett, Floyd, Crewdson, Hofmann, Kozachkov, Wiest, Schramm and Johnson7
Notch toughness K Q versus critical diameter of BMG rods for the investigated Mg-based BMGs. A dashed line drawn by eye-view indicates a general trend.

As seen in Table II, with respect to the ternary Mg63Cu26Y11 and Mg61Cu28Gd11 without Ag, the quaternary Mg54Cu28Ag7Y11 and Mg59.5Cu22.9Ag6.6Gd11 with Ag manifest the improved toughness. These alloys have the best GFA in their respective system. It means that the Ag substitution for Cu in the alloys not only improves the GFA but also enhances the toughness. In this regard, it is consistent with the result that the ν of element Ag in crystalline form (ν Ag = 0.37) is higher than that of Cu (ν Cu = 0.34). On comparison of the alloys with different RE elements, toughness of Cu-bearing Mg glasses with Gd (ν Gd = 0.26) or Tb (ν Tb = 0.26) is observed to be somewhat superior to that with Y (ν Y = 0.24) and Nd (ν Nd = 0.28). It reflects the chemistry effect of RE elements on toughness for Mg–Cu BMGs. As a consequence, it is not surprising that the Mg59.5Cu22.9Ag6.6Gd11 has the optimal toughness due to simultaneously alloying with Ag and Gd.
D. Glass transition temperature versus elastic properties for Mg-based BMGs
As seen in Table I, the T g of Mg BMGs exhibits the compositional dependence and varies from 414 K of Mg65Cu25Tb10 to 456 K of Mg64Ni21Nd15, with an extended span of 42 K. Meanwhile, the Young’s modulus E varies from 47.4 GPa of Mg64Ni21Nd15 to 54.8 GPa of three MgCuAgY alloys, with a maximum difference of ≈15%.
Based on the concept of topological fluctuations in the atomic bonding network, Egami et al.Reference Egami, Poon, Zhang and Keppens26 proposed a microscopic model to predict T g quantitatively from measurable elastic properties in BMGs. It is suggested that kT g (k is the Boltzmann constant) is not a function of a single parameter, such as BV m, μV m, or EV m, but depends on both BV m and μV m or equivalently on BV m and ν. Then, the relation between the B and T g for BMGs can be expressed as
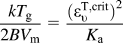
and
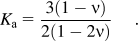
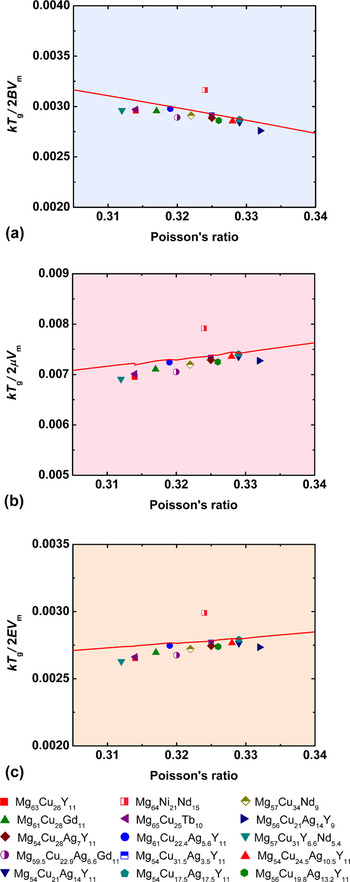
For the elastic moduli measured at room temperature,  , which is the transformation volume strain. Figure 6(a) is a plot of the T g multiplied by k/(2BV m) as Eq. (3) against the ν for the current 15 Mg-based BMGs listed in Table I. Similarly, Figs. 6(b) and 6(c) show kT g/2μV m and kT g/2EV m versus ν, respectively. The solid line in these figures indicates Eq. (3). In these plots, a weak dependence on ν is shown, but kT g/2BV m, kT g/2μV m, and kT g/2EV m are not constant, suggesting that T g depends not only on B but also on both B and μ. Note that the E describes a response of a free object to uniaxial stress, which is not consistent with the fluctuations of a continuous network. These findings indicate that even in a given alloy class, such as Mg-based glasses, the relationship between the T g and the elastic moduli can be well described by Egami’s model.Reference Egami, Poon, Zhang and Keppens26
Glass transition temperature T g multiplied by (a) k/(2BV m), (b) k/2μV m, and (c) k/2EV m as a function of the Poisson’s ratio ν for the investigated Mg-based BMGs. The solid line indicates Eq. (3).

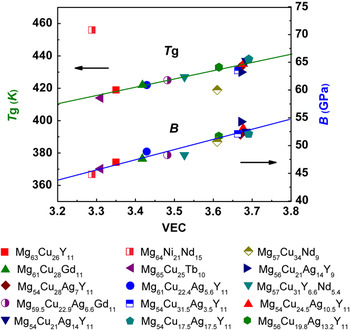
In addition, based on the established correlation of μ with quadrupole polarizability and B with valence electron density,Reference Zhang and Greer19, Reference Gilman27 we examined the relationship between the T g, the B, and the valence electron concentration (VEC) for the Mg-based BMGs. The VECs of the alloys are calculated using the same method as in Ref. Reference Fukuhara, Takahashi, Kawazoe and Inoue28. In Fig. 7, the T g and B is plotted against the VEC for the investigated Mg glasses. Aside from the Mg64Ni21Nd15, the T g and B as a function VEC for the Mg–Cu–RE glasses can be linearly expressed as

Glass transition temperature T g and bulk modulus B versus valence electron concentration for Mg-based BMGs.

and

In these two equations, the positive slope means that the T g of the BMGs increases with increase in the number of valence electrons of the alloys. This corresponds to reduction of interatomic distance due to the unsynchronized resonance of electron-pair bonds. Meanwhile, a similar trend appears also for B.
IV. DISCUSSION
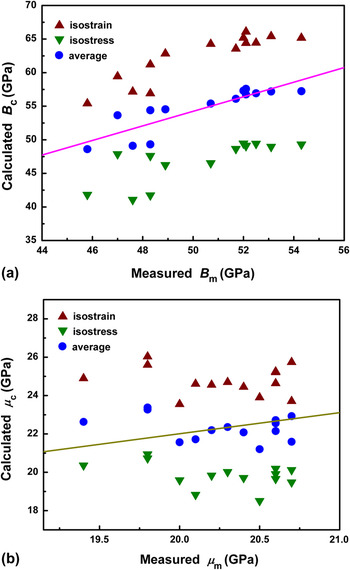
Since the ν (or μ/B) and μ are expected to be the indicators for searching the tough/ductile BMGs, the power to predict ν (or μ/B) for an MG of given composition is significantly important for alloy design. The Mg–TM–RE BMGs, without metalloid elements, are characterized by metallic bonding, with the valence electrons from each constituent element being mixed and interacting to form an itinerant electron cloud. As indicated by Jóváril et al.,Reference Jóváril, Saksl, Pryds, Lebech, Bailey, Mellergård, Delaplane and Franz29 Mg–Mg and Mg–Cu nearest neighbor distances in the Mg60Cu30Y10 glass are similar to the values found in crystalline Mg2Cu. The majority of Cu atoms are bonded to Y because of a strong attraction between Cu and Y. Moreover, the atomic structure in the Mg80Cu8Y12 glass may be viewed as the randomly distributed Mg atoms, in which the Cu–Y clusters may be embedded.Reference Fukunaga, Sugiura, Takeichi and Mizutani30 In light of the electronic structure, the hybridization of the Mg 3p states, particularly with Cu 3d states, is weaker than the hybridization with Y 4d. Consequently, the intrinsic elemental contribution to the properties of Mg-based glasses can be reasonably estimated by the weighted average of the properties of each constituent element in its pure metallic state, as previously proposed in Ref. Reference Zhang and Greer19. With the current data from 15 Mg glasses as tabulated in Table I, we address the accuracy of such estimation.
Figures 8(a) and 8(b) illustrate the plots of the calculated values from Eqs. (1) and (2) against the measured values of B and μ, respectively, for Mg-based BMGs. The straight line shown in the figures is a fit to the average of upper and lower bounds. The correlations between calculated and measured values of the B and μ are obtained as B c = 1.08B m and μ c = 1.10μ m, respectively. This means that the predicted values of B and μ are, respectively, 8% and 10% greater than the measured values. Note that, when the BMGs with diverse host metals are considered, the predicted values of B and μ are, respectively, 8% less and 20% greater than the measured values (see Ref. Reference Zhang and Greer19).
Calculated versus measured values of (a) bulk modulus B and (b) shear modulus μ for Mg-based BMGs. The straight line is a fit to the average of upper and lower bounds.

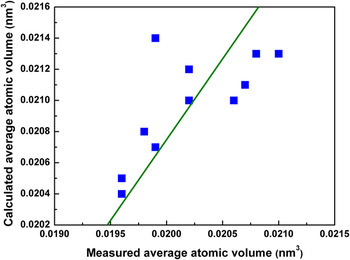
Moreover, the measured average atomic volume  of the Mg BMG is compared with the average of the atomic volume of the constituent elements
 as well. Figure 9 shows a plot with a straight-line fit:
 . It indicates that the predicted value of average atomic volume is 4% greater than the measured value, whereas it is 1% greater than the measured value in previous work, which is over a broad range of MGs.Reference Zhang and Greer19
Calculated versus measured average atomic volume of Mg-based BMGs.

Chen et al.Reference Chen, Krause and Coleman31 first suggested that the high ν of MGs, as indicative of the ease of atomic regroupings, is responsible for the ductile plastic deformation. Recently, Schroers et al.Reference Schroers and Johnson13 found that the Pt-based BMG with the high ν of 0.42 exhibits large compressive plasticity and high fracture toughness (K Q ≈ 80 MPa√m). Independently, Lewandowski et al.Reference Lewandowski, Wang and Greer4 proposed a critical value of μ/B (0.41–0.43), or equivalently ν (0.31–0.32), at which the BTT occurs. Indeed, a critical ν value (ν ≈ 0.31–0.32) for such transition is present in Fe-based BMGs.Reference Lewandowski, Gu, Nouri, Poon and Shiflet5, Reference Gu, Mcdermott, Poon and Shiflet17 Correlation of toughness/ductility with ν (or μ/B) for MG is explained in terms of competition between shear and dilatation or competition between plastic flow and cleavage propagation that controls the fracture process in MG. A higher ν decreases the potential energy of the shear transformation zone (STZ), thereby increasing the tendency of plastic deformation in mitigating fracture stress concentration.Reference Poon, Zhu and Shiflet32
Nevertheless, it has been indicated in some experiments that the ν-correlation with plasticity/toughness is the lack of well-defined tendency within a specific alloy system,Reference Jia, Zhu, Ma and Xu6, Reference Kim, Suh, Wiest, Lind, Conner and Johnson8, Reference He, Cheng, Ma and Xu9 although it was suggested over a broad range of MGs. Poon et al.Reference Poon, Zhu and Shiflet32 proposed a simple model that considered the competition between plastic flow initiations and crack growth or shear softening at the yield point of MGs. It provided a theoretical basis for understanding the role of ν on plasticity. It was noted that the local topological and chemical disordering in the STZ lead to the shear modulus fluctuations, which can modify the critical Poisson’s ratio ν c. Therefore, in addition to ν, shear modulus fluctuations at the STZ scale also play an important role. Higher Poisson’s ratios do not necessarily result in improved plasticity. Moreover, different MG alloy systems can have different ν c due to μ fluctuations. In this study, as seen in Section IIIC [Fig. 4(a)], the highest notch toughness at the Mg59.5Cu22.9Ag6.6Gd11 does not correspond to the highest ν. This can be due to some extrinsic or fundamental effects such as the quenched-in glassy structure of the samples. Additionally, ν = 0.332 cannot be treated as a critical ν for the BTT in the scenario of Mg BMGs. Intrinsic brittleness of Mg glasses is associated with its small plastic zone size (in micrometer scale), without a massive shear-banding initiation ahead of crack tip and weak resistance to crack propagation, as shown in Fig. 3.
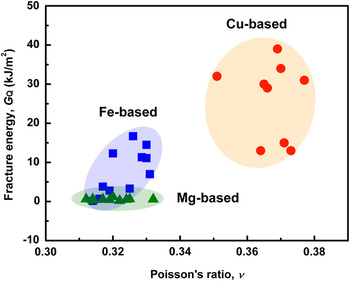
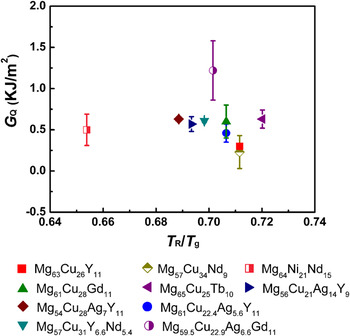
Furthermore, we note that in previous works, the authors often plot fracture energy G Q of various BMG classes on a logarithmic scale, thus compressing the data, such that the ν correlation may not catch the variations in each BMG class. For the purpose of comparison, the G Q obtained by notched sample testing is plotted against ν for Cu-, Fe-, and Mg-based BMGs (Fig. 10). The data for the Cu-Reference Jia, Zhu, Ma and Xu6 and Fe-Reference Lewandowski, Gu, Nouri, Poon and Shiflet5, Reference Demetriou, Kaltenboeck, Suh, Garrett, Floyd, Crewdson, Hofmann, Kozachkov, Wiest, Schramm and Johnson7based BMGs are collected from literature. For approximation, the blunting effect of notch root radius and geometry of the samples on fracture energy are ignored. As seen in Fig. 10, even if the ν extension of Mg-based BMGs is comparable to the Fe-based BMGs, fracture energy of the Mg-based BMGs is only comparable to the lower bound of Fe-based BMGs, but significantly lower than that of the Cu-based BMGs.
Fracture energy G Q measured with notched samples versus Poisson’s ratio ν for Cu-, Fe-, and Mg-based BMGs. The collected data of the Cu6 and Fe5,7 BMGs are from literature.

Based on the CSM,Reference Johnson and Samwer15 the shear-flow energy barrier (W g) for an MG with a frozen-in atomic configuration at T g can be expressed as

where Ωg is the STZ volume and γ c is the shear strain limit (0.036). The W g value for most MGs ranges between 2 × 10⁻¹⁹ and 3 × 10⁻¹⁹ J.Reference Johnson, Demetriou, Harmon, Lind and Samwer33 Taking into consideration that the typical value for μ g of Mg glasses is 20 GPa (see Table I), the STZ volume can be estimated as

Using the average atomic volume of 0.02 nm3 (see Fig. 11), the effective number of atoms participating in an STZ can be estimated to be N ≈ 500. For a comparison, we note that the Ωg and N for Pd43Ni10Cu27P20 glass is estimated to be 9.2 nm3 and 700, respectively.Reference Demetriou, Johnson and Samwer34 In terms of Eq. (8), the low μ corresponds to a low shear-flow barrier, thereby to favor the toughness of MGs because the shear bands instead of the cracks are expected to be easily initiated in flaw related to stress concentration regions. As indicated in our cases, the toughness assessed by the K Q of Mg-based BMGs is insensitive to the change in μV m, as shown in Fig. 4(b). It is plausible that, since Mg-based BMGs have relatively low T g (close to room temperature), accompanied by high homologous temperature T R/T g (near 0.7), as-cast glassy rods have been subjected to structural relaxation, to some extent, during freezing into glass from the melt. As a matter of fact, the μ for the investigated Mg-based BMGs does not exhibit a strong compositional dependence, maintaining around 20 GPa.
Fracture energy G Q measured with notched samples versus homologous temperature T R/T g for the investigated Mg-based BMGs.

On the other hand, it is of interest to concern whether structural relaxation of the as-prepared Mg BMGs probably happens when ageing even at room temperature. Actually, Castellero et al.Reference Castellero, Moser, Uhlenhaut, Dalla Torre and Löffler35 observed that structural relaxation occurs at room temperature and induces embrittlement in the splat-quenched MgCuY glassy foils with a thickness of ≈50 μm. However, the marked heat release associated with structural relaxation before glass transition events is not observed in the DSC scans for the current Mg BMG rods, as shown in Fig. 1(b) as the representative. It is different from the case of rapidly quenched glassy ribbons/foils.Reference Castellero, Moser, Uhlenhaut, Dalla Torre and Löffler35, Reference Niikura, Tsai, Inoue and Masumoto36 The cooling rate of the as-cast glassy rods is about two order of magnitude lower than that of the splat-quenched thin foils, resulting in a more relaxed state in the MG. Figure 11 displays the fracture energy G Q versus homologous temperature T R/T g for the investigated Mg-based BMGs. As seen in Fig. 11, within the variation from 0.65 of Mg64Ni21Nd15 to 0.72 of Mg65Cu25Tb10, the effect of T R/T g on toughness is absent of a well-defined trend. It is plausible that the lower energy (or more ordered configuration in atomic scale) level has been established in the glassy rods during cooling, without any more potential/room for further structural relaxation.
V. SUMMARY
(1) By compositional tuning, a BMG with the ν of 0.332 is located at Mg56Cu21Ag14Y9, ν value for which is in excess of the previously suggested critical value (ν = 0.31–0.32) for the BTT in metallic glasses. As indicated from 15 representative Mg-based BMGs, the predicted values of the bulk modulus, shear modulus, and average atomic volume of BMGs by weighting the volume fraction of the moduli and atomic volume of the constituent elements in crystalline form are, respectively, 8%, 10%, and 4% greater than the measured values.
(2) For the investigated Mg-based BMGs with different chemistry, notch toughness varies between 3.6 and 8.2 MPa√m. Intrinsic brittleness of Mg glasses is associated with its tiny plastic zone size (in micrometer scale) ahead of crack tip and weak resistance to crack propagation. Meanwhile, the toughness improvement does not simply correlate either with higher ν or with lower μ. Regarding the alloying effects, Mg–TM–RE BMGs can be toughened, to some extent, by Ag substitution for Cu and by addition of Gd or Tb rather than Y and Nd. Among the investigated alloys, the Mg59.5Cu22.9Ag6.6Gd11 BMG manifests a good combination of toughness and GFA.
(3) For the Mg-based BMGs, the relationship between the glass transition temperature, T g, and the elastic moduli can be well described by Egami’s model, suggesting that T g depends not only on B but also on both B and μ. For 14 Mg–Cu–RE BMGs, the T g and bulk modulus B scales with valence electron concentration (VEC), which is expressed as T g = 51VEC + 248 and B = 18VEC − 15, respectively.
ACKNOWLEDGMENTS
The authors gratefully acknowledge the stimulating discussions with Profs. A.L. Greer and E. Ma. This work was supported by the National Basic Research Program of China (973 Program) under Contract No. 2007CB613906 and National Natural Science Foundation of China under Grant No. 50871112.